The (bad) stuff of legend

What is a legend? Merriam–Webster says:

  1. A story from the past that is believed by many people but cannot be proved to be true.
  2. An explanatory list of the symbols on a map or chart.

I think we can combine these:

An explanatory list from the past that is believed by many to be useful but which cannot be proved to be.

Maybe that goes too far, sometimes you need a legend. But often, very often, you don't. At the very least, you should always try hard to make the legend irrelevant. Why, and how, can you do this? 

A case study

On the right is a non-scientific caricature of a figure from a paper I just finished reviewing for Geophysics. I won't give any more details because I don't want to pick on it unduly — lots of authors make the same mistakes.

Here are some of the things I think are confusing about this figure, detracting from the science in the paper. 

  • Making the reader cross-reference the line decoration with the legend makes it harder to make the comparison you're asking them to make. Just label the lines directly. 
  • Using unhelpful, generic names like 1, 2, and 3 for the models leads the reader into cross-reference Inception. The models were shown and explained on the previous page. 
  • Inception again: the models 1, 2, and 3 were shown in the previous figure parts (a), (b), and (c) respectively. So I had to cross-reference deeper still to really find out about them. 
  • The paper used colour elsewhere, so the use of black and white line decoration here seems unnecessary. There are other ways to ensure clarity if the paper is photocopied.
  • Everything on the same visual plane, so to speak, so the chart cannot take any more detail, such as gridlines. 

Getting better

I have tried to fix some of this in the version of the figure shown here. It's the same size as the original. The legend, such as it is, is now a visual key to the models. Careful juxtaposition of figures could obviate the need even for this extra key. The idea would be to use the colours and names of the models in every figure, to link them more intuitively.

The principles at work:

  • Reduce the fatigue of reading by labeling things directly.
  • Avoid using 'a' and 'b' or other generic names. Call the parts before and after, or 8 ms gate and 16 ms gate
  • Put things you want people to compare next to each other: models with data, output with input, etc. 
  • Use less ink for decoration, more ink for data. Gently direct the reader's attention. 

I'm sure there are other improvements we could make. Do you have any tips to share for making better figures? Leave them in the comments. 


Update, 30 Jan 2015

Some great comments came in today, and the point about black and white is well taken. Indeed, our 52 Things books are all black and white, and I end up transforming most images and figures to (I hope) make them clearer without colour. Here's how I'd do this figure in black and white.

Geocomputing: Call for papers

52 Things .+? Geocomputing is in the works.

For previous books, we've reached out to people we know and trust. This felt like the right way to start our micropublishing project, because we had zero credibility as publishers, and were asking a lot from people to believe anything would come of it.

Now we know we can do it, but personal invitation means writing to a lot of people. We only hear back from about 50% of everyone we write to, and only about 50% of those ever submit anything. So each book takes about 160 invitations.

This time, I'd like to try something different, and see if we can truly crowdsource these books. If you would like to write a short contribution for this book on geoscience and computing, please have a look at the author guidelines. In a nutshell, we need about 600 words before the end of March. A figure or two is OK, and code is very much encouraged. Publication date: fall 2015.

We would also like to find some reviewers. If you would be available to read at least 5 essays, and provide feedback to us and the authors, please let me know

In keeping with past practice, we will be donating money from sales of the book to scientific Python community projects via the non-profit NumFOCUS Foundation.

What the cover might look like. If you'd like to write for us, please read the author guidelines.

What the cover might look like. If you'd like to write for us, please read the author guidelines.

The road to Modelr: my EuroSciPy poster

At EuroSciPy recently, I gave a poster-ized version of the talk I did at SciPy. Unlike most of the other presentations at EuroSciPy, my poster didn't cover a lot of the science (which is well understood), or the code (which is esoteric).

Instead it focused on the advantages of spreading software via web applications, rather than only via source code, and on the challenges that we overcame — well, that we're still overcoming — to get our Modelr tool out there. I wanted other programmer-scientists to think about running some of their code as a web app for others to enjoy, but to be aware of the effort involved in doing this.

I've written before about my dislike of posters, though I'm told they are an important component at, say, the AGU Fall Meeting. I admit I do quite like the process of making them, and — on advice from Colin Purrington's useful page — I left a space on the poster for people to write comments or leave sticky notes. As a result, I heard about Docker, a lead I'll certainly follow up,

What's new in modelr

This wasn't part of the poster, but I might as well take the chance to let you know what we've updated recently:

  • You can now add noise to models by specifying the signal:noise.
  • Instead of automatic scaling, you can choose your own gain.
  • The app now returns the elastic moduli of the rocks in the model.
  • You can choose a spatial cross-section view or a space–offset–frequency view.

All of these features are now available to subscribers for only $9/month. Amazing value :)

Figshare

I've stored my poster on Figshare, a data storage site and part of Macmillan's Digital Science effort. What I love about Figshare, apart from the convenience of cloud-based storage and easy access for others, is that every item gets a digital object identifier or DOI. You've probably seen these on journal articles. They're a bit like other persistent and unique IDs for publications, such as ISBNs for books, but the idea is to provide more interactivity by making it easily linkable: you can get to any object with a DOI by prepending it with "http://dx.doi.org/".

Reference

Hall, M (2014). The road to modelr: building a commercial web app on an open source foundation. EuroSciPy, Cambridge, UK, August 29–30, 2014. Poster presentation. DOI:10.6084/m9.figshare.1151653

Whither technical books?

Pile of geophysics booksLeafing through our pile of new books on seismic analysis got me thinking about technical books and the future of technical publishing. In particular:

  • Why are these books so expensive? 
  • When will we start to see reproducibility?
  • Does all this stuff just belong on the web?

Why so expensive?

Should technical books really cost several times what ordinary books cost? Professors often ask us for discounts for modelr, our $9/mo seismic modeling tool. Students pay 10% of what pros pay in our geocomputing course. Yet academic books cost three times what consumer books cost. I know it's a volume game — but you're not going to sell many books at $100 a go! And unlike consumer books, technical authors usually don't make any money — a star writer may score 6% of net sales... once 500 books have been sold (see Handbook for Academic Authors).

Where's the reproducibility?

Compared to the amazing level of reproducibility we saw at SciPy — where the code to reproduce virtually every tutorial, talk, and poster was downloadable — books are still rather black box. For example, the figures are often drafted, not generated. A notable (but incomplete) exception is Chris Liner's fantastic (but ridiculously expensive) volume, Elements of 3D Seismology, in which most of the figures seem to have been generated by Mathematica. The crucial final step is to share the code that generated them, and he's exploring this in recent blog posts (e.g. right).

I can think of three examples of more reproducible geophysics in print:

  1. Gary Mavko has shared a lot of MATLAB code associated with Quantitative Seismic Interpretation and The Rock Physics Handbook. The code to reproduce the figures is not provided, and MATLAB is not really open, but it's a start.
  2. William Ashcroft's excellent book, A Petroleum Geologist's Guide to Seismic Reflection contains (proprietary, Windows only) code on a CD, so you could in theory make some of the figures yourself. But it wouldn't be easy.
  3. The series of tutorials I'm coordinating for The Leading Edge has, so far, includes all code to reproduce figures, exclusively written in open languages and using open or synthetic data. Kudos to SEG!

Will the web win?

None of this comes close to Sergey Fomel's brand of fully reproducible geophysics. He is a true pioneer in this space, up there with Jon Claerbout. (You should definitely read his blog!). One thing he's been experimenting with is 'live' reproducible documents in the cloud. If we don't see an easy way to publish live, interactive notebooks in the cloud this year, we'll see them next year for sure.

So imagine being able to read a technical document, a textbook say, with all the usual features you get online — links, hover-over, clickable images, etc. But then add the ability to not only see the code that produced each figure, but to edit and re-run that code. Or add slider widgets for parameters — "What happens to the gather if if I change Poisson's ratio?" Now, since you're on the web, you can share your modification with your colleagues, or the world.

Now that's a book I'd be glad to pay double for.

Some questions for you

We'd love to know what you think of technical books. Leave a comment below, or get in touch

  • Do you purchase technical books regularly? What prompts you to buy a book?
  • What book keeps getting pulled off your shelf, and which ones collect dust?
  • What's missing from the current offerings? Workflows, regional studies, atlases,...?
  • Would you rather just consume everything online? Do you care about reproducibility?

400 posts

The last post was our 400th on this blog. At an average of 500 words, that's about 200,000 words since we started at the end of 2010. Enough for a decent-sized novel, but slightly less likely to win a Pulitzer. In that time, according to Google, almost exactly 100,000 individuals have stopped by agilegeoscience.com — most of them lots of times — thank you readers for keeping us going! The most popular posts: Shale vs tight, Rock physics cheatsheet, and Well tie workflow. We hope you enjoy reading at least half as much as we enjoy writing.

Atlantic geology hits Wikipedia

WikiProject Geology is one of the gathering places for geoscientists in Wikipedia.Regular readers of this blog know that we're committed to open scientific communication, and that we're champions of wikis as one of the venues for that communication, and that we want to see more funky stuff happen at conferences. In this spirit, we hosted a Wikipedia editing session at the Atlantic Geoscience Society Colloquium in Wolfville, Nova Scotia, this past weekend. 

As typically happens with these funky sessions, it wasn't bursting at the seams: The Island of Misfit Toys is not overcrowded. There were only 7 of us: three Agilistas, another consultant, a professor, a government geologist, and a student. But it's not the numbers that matter (I hope), it's the spirit of the thing. We were a keen bunch and we got quite a bit done. Here are the articles we started or built upon:

The birth of the Atlantic Geoscience Society page gave the group an interesting insight into Wikipedia's quality control machine. Within 10 minutes of publishing it, the article was tagged for speedy deletion by an administrator. This sort of thing is always a bit off-putting to noobs, because Wikipedia editors can be a bit, er, brash, or at least impersonal. This is not that surprising when you consider that new pages are created at a rate of about one a minute some days. Just now I resurrected a stripped-down version of the article, and it has already been reviewed. Moral: don't let anyone tell you that Wikipedia is a free-for-all.

All of these pages are still (and always will be) works in progress. But we added 5 new pages and a substantial amount of material with our 28 or so hours of labour. Considering most of those who came had never edited a wiki before, I'm happy to call this a resounding success. 

Much of my notes from the event could be adapted to any geoscience wiki editing session — use them as a springboard to get some champions of open-access science together at your next gathering. If you'd like our help, get in touch.

6 questions about seismic interpretation

This interview is part of a series of conversations between Satinder Chopra and the authors of the book 52 Things You Should Know About Geophysics (Agile Libre, 2012). The first three appeared in the October 2013 issue of the CSEG Recorder, the Canadian applied geophysics magazine, which graciously agreed to publish them under a CC-BY license.


Satinder Chopra: Seismic data contain massive amounts of information, which has to be extracted using the right tools and knowhow, a task usually entrusted to the seismic interpreter. This would entail isolating the anomalous patterns on the wiggles and understanding the implied subsurface properties, etc. What do you think are the challenges for a seismic interpreter?

Evan Bianco: The challenge is to not lose anything in the abstraction.

The notion that we take terabytes of prestack data, migrate it into gigabyte-sized cubes, and reduce that further to digitized surfaces that are hundreds of kilobytes in size, sounds like a dangerous discarding of information. That's at least 6 orders of magnitude! The challenge for the interpreter, then, is to be darn sure that this is all you need out of your data, and if it isn't (and it probably isn't), knowing how to go back for more.

SC: How do you think some these challenges can be addressed?

EB: I have a big vision and a small vision. Both have to do with documentation and record keeping. If you imagine the entire seismic experiment upon a sort of conceptual mixing board, instead of as a linear sequence of steps, elements could be revisited and modified at any time. In theory nothing would be lost in translation. The connections between inputs and outputs could be maintained, even studied, all in place. In that view, the configuration of the mixing board itself becomes a comprehensive and complete history for the data — what's been done to it, and what has been extracted from it.

The smaller vision: there are plenty of data management solutions for geospatial information, but broadcasting the context that we bring to bear is a whole other challenge. Any tool that allows people to preserve the link between data and model should be used to transfer the implicit along with the explicit. Take auto-tracking a horizon as an example. It would be valuable if an interpreter could embed some context into an object while digitizing. Something that could later inform the geocellular modeler to proceed with caution or certainty.

SC: One of the important tasks that a seismic interpreter faces is the prediction about the location of the hydrocarbons in the subsurface.  Having come up with a hypothesis, how do you think this can be made more convincing and presented to fellow colleagues?

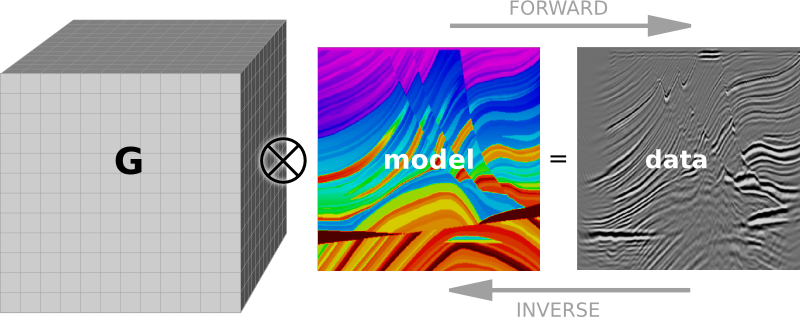
EB: Coming up with a hypothesis (that is, a model) is solving an inverse problem. So there is a lot of convincing power in completing the loop. If all you have done is the inverse problem, know that you could go further. There are a lot of service companies who are in the business of solving inverse problems, not so many completing the loop with the forward problem. It's the only way to test hypotheses without a drill bit, and gives a better handle on methodological and technological limitations.
SC: You mention "absolving us of responsibility" in your article.  Could you elaborate on this a little more? Do you think there is accountability of sorts practiced in our industry?

EB: I see accountability from a data-centric perspective. For example, think of all the ways that a digitized fault plane can be used. It could become a polygon cutting through a surface on map. It could be a wall within a geocellular model. It could be a node in a drilling prognosis. Now, if the fault is mis-picked by even one bin, this could show up hundreds of metres away, depending on the dip of the fault, compared to the prognosis. Practically speaking, accounting for mismatches like this is hard, and is usually done in an ad hoc way, if at all. What caused the error? Was it the migration or was it the picking? Or what about the error in the measurement of the drill-bit? I think accountability is loosely practised at best because we don't know how to reconcile all these competing errors.

Until data can have a memory, being accountable means being diligent with documentation. But it is time-consuming, and there aren’t as many standards as there are data formats.

SC: Declaring your work to be in progress could allow you to embrace iteration.  I like that. However, there is usually a finite time to complete a given interpretation task; but as more and more wells are drilled, the interpretation could be updated. Do you think this practice would suit small companies that need to ensure each new well is productive or they are doomed?

EB: The size of the company shouldn't have anything to do with it. Iteration is something that needs to happen after you get new information. The question is not, "do I need to iterate now that we have drilled a few more wells?", but "how does this new information change my previous work?" Perhaps the interpretation was too rigid — too precise — to begin with. If the interpreter sees her work as something that evolves towards a more complete picture, she needn't be afraid of changing her mind if new information proves us to be incorrect. Depth migration, for example, exemplifies this approach. Hopefully more conceptual and qualitative aspects of subsurface work can adopt it as well.

SC: The present day workflows for seismic interpretation for unconventional resources demand more than the usual practices followed for the conventional exploration and development.  Could you comment on how these are changing?

EB: With unconventionals, seismic interpreters are looking for different things. They aren't looking for reservoirs, they are looking for suitable locations to create reservoirs. Seismic technologies that estimate the state of stress will become increasingly important, and interpreters will need to work in close contact to geomechanics. Also, microseismic monitoring and time-lapse technologies tend to push interpreters into the thick of the operations, which allow them to study how the properties of the earth change according to operations. What a perfect place for iterative workflows.


You can read the other interviews and Evan's essay in the magazine, or buy the book! (You'll find it in Amazon's stores too.) It's a great introduction to who applied geophysicists are, and what sort of problems they work on. Read more about it. 

Join CSEG to catch more of these interviews as they come out. 

2013 retrospective

It's almost the end of the year, so we ask for your indulgence as we take our traditional look back at some of the better bits of the blog from 2013. If you have favourite subjects, we always like feedback!

Most visits

Amazingly, nothing we can write seems to be able to topple Shale vs tight, which is one of the firsts posts I wrote on this blog. Most of that traffic is coming from Google search, of course. I'd like to tell you how many visits the posts get, but web stats are fairly random — this year we'll have had either 60,000 or 245,000 visits, depending on who you believe — very precise data! Anyway, here are the rest...

Most comments

We got our 1000th blog comment at the end of September (thanks Matteo!). Admittedly some of them were us, but hey, we like arbitrary milestones as much as the next person. Here are the most commented-on posts of the year:

Hackathon skull

Hackathon skull

Proud moments

Some posts don't necessarily win a lot of readers or get many comments, but they mark events that were important to us. A sort of public record. Our big events in 2013 were...

Our favourites

Of course we have our personal favourite posts too — pieces that were especially fun to put together, or that took an unusual amount of craft and perspiration to finish (or more likely a sound beating with a blunt instrument).

Evan

Matt

I won't go into reader demographics as they've not changed much since last year. One thing is interesting, though not very surprising — about 15% of visitors are now reading on mobile devices, compared to 10% in 2012 and 7% in 2011. The technology shift is amazing: in 2011 we had exactly 94 visits from readers on tablets — now we get about 20 tablet visits every day, mostly from iPads.

It only remains for me to say Thank You to our wonderful community of readers. We appreciate every one of you, and love getting email and comments more than is probably healthy. The last 3 years have been huge fun, and we can't wait for 2014. If you celebrate Christmas may it be merry — and we wish you all the best for the new year.

Ten ways to make a difference

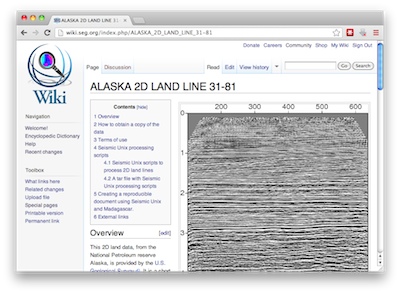
SEG WikiAfter reading my remarks yesterday about geoscience wikis, perhaps you're itching to share some of what you know. Below are ten quick ways to get started. And if you're going to SEG next week, you're in luck: you'll find a quick way to get started. 

Ten things you can do

First, if you really just want to dive in, here are ten easy things you can do in almost any wiki. Let's use SEG Wiki as an example — but this applies equally well to SubSurfWiki, PetroWiki, or Wikipedia.

  1. Read it — find a page or category that interests you, and start exploring the content
  2. Edit it — nothing tricky, but if you find a typo or other small error, hit Edit and fix it (you can do this without logging in on Wikipedia, but most other wikis require you to make an account first. This isn't usually a deliberate effort to put you off — allowing anonymous editing results in an amazing amount robot spam. Yes, robot spam.)
  3. Share it — like most of the web, wikis need to be shared to survive. When you find something useful, share it.
  4. Add a profile — if you're an SEG member, you already have an account on SEG Wiki. Why not add some info about yourself? Go log in to SEG.org then click this link. Here's mine
  5. Add a sandbox — Edit your user page, add this: [[/Sandbox/]], then save your page. You'll see a red link. Click on it. Try some editing — you can do anything you like here. Again, here's mine — click Edit and copy my code. 
  6. Fix equations — most of the equations in the SEG Encyclopedic Dictionary are poorly formatted. If you know LaTeX, you can help fix them. Here's one that's been fixed. Here's a bad one (if it looks OK, someone beat you to it :)
  7. Add references — Just like technical papers, wikis need citations and references if they are to be useful and trusted. Most articles in SEG Wiki have citations, but the references are on another page. Here's one I've fixed. 
  8. Add a figure — Again, the figures are mostly divorced from their articles. The Q article shows one way to integrate them. Some articles have lots of figures. 
  9. Improve a definition — Many of the Dictionary definitions are out of date or unhelpfully terse. Long articles probably belong in the 'main' namespace (that is, not the Dictionary part) — so for example I split Spectral decomposition into a main article, apart from the short dictionary definition.
  10. Add an article — This may seem like a big step, but don't be shy. Be bold! We can worry later if the new article needs to be split or combined or renamed or reformatted. The point is to start.

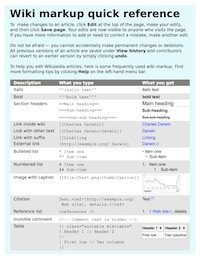
Wiki markup takes a little getting used to, but you can get a very long way with a little know-how. This wiki markup cheatsheet will give you a head start.

One place you can start

SEG Annual MeetingAt the SEG Annual Meeting next week, I'll be hanging about the Press Room from 11 am till 1 pm every day, with John Stockwell, Karl Schleicher and some other wiki enthusiasts. We'd be happy to answer any questions or help you get started.

Bring your laptop! Spread the word! Bring a friend! See you there!

Wiki world of geoscience

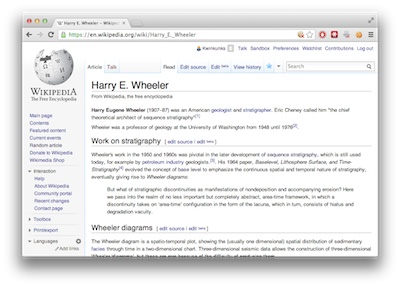
This weekend, I noticed that there was no Wikipedia article about Harry Wheeler, one of the founders of theoretical stratigraphy. So I started one. This brings the number of biographies I've started to 3:

  • Karl Zoeppritz — described waves almost perfectly, but died at the age of 26
  • Johannes Walther — started as a biologist, but later preferred rocks
  • Harry Wheeler — if anyone has a Wheeler diagram to share, please add it!

Many biographies of notable geoscientists are still missing (there are hundreds, but here are three): 

  • Larry Sloss — another pioneer of modern stratigraphy
  • Oz Yilmaz — prolific seismic theoretician and practioner
  • Brian Russell — entrepreneur and champion of seismic analysis

It's funny, Wikipedia always seems so good — it has deep and wide content on everything imaginable. I think I must visit it 20 or 30 times a day. But when you look closely, especially at a subject you know a bit about, there are lots of gaps (I wonder if this is one of the reasons people sometimes deride it?). There is a notability requirement for biographies, but for some reason this doesn't seem to apply to athletes or celebrities. 

I was surprised the Wheeler page didn't exist, but once you start reading, there are lots of surprises:

I run a geoscience wiki, but this is intended for highly esoteric topics that probably don't really belong in Wikipedia, e.g. setting parameters for seismic autopickers, or critical reviews of subsurface software (both on my wish list). I am currently working on a wiki for AAPG — is that the place for 'deep' petroleum geoscience? I also spend time on SEG Wiki... With all these wikis, I worry that we risk spreading ourselves too thinly? What do you think?

In the meantime, can you give 10 minutes to improve a geoscience article in Wikipedia? Or perhaps you have a classful of students to unleash on an assignment?

Tomorrow, I'll tell you about an easy way to help improve some geophysics content.