Colouring maps

Over the last fortnight, I've shared five things, and then five more things, about colour. Some of the main points:

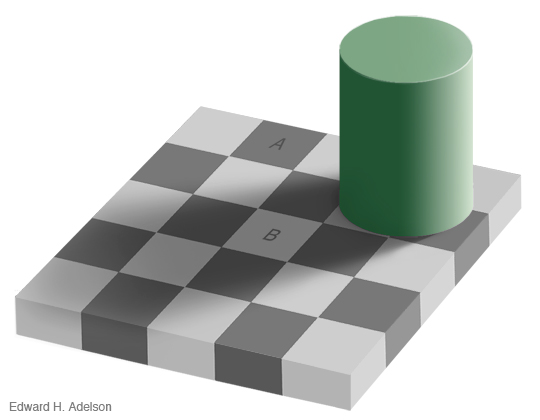
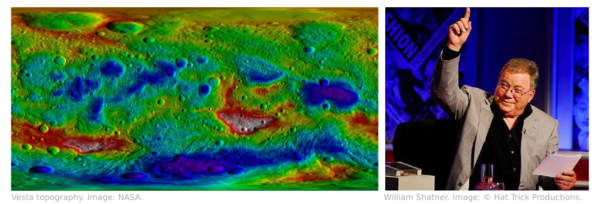
  • Our non-linear, heuristic-soaked brains are easily fooled by colour.
  • Lots of the most common colour bars (linear ramps, bright spectrums) are not good choices.
  • You can learn a lot by reading Robert Simmon, Matteo Niccoli, and others.

Last time I finished on two questions:

  1. How many attributes can a seismic interpreter show with colour in a single display?
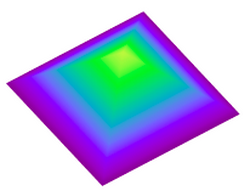
  2. On thickness maps should the thicks be blue or red?

One attribute, two attributes

The answer to the first question may be a matter of personal preference. Doubtless we could show lots and lots, but the meaning would be lost. Combined red-green-blue displays are a nice way to cram more into a map, but they work best on very closely related attributes, such as seismic amplitude of three particular frequencies

Here's some seismic reflection data — the open F3 dataset, offshore Netherlands, in OpendTect

A horizon — just below the prominent clinoforms — is displayed (below, left) and coloured according to elevation, using one of Matteo's perceptual colour bars (now included in OpendTect!). A colour scale like this varies monotonically in hue and luminance.

Some of the luminance channel (sometimes called brightness or value) is showing elevation, and a little is being used up by the 3D shading on the surface, but not much. I think the brain processes this automatically because the 3D illusion is quite good, especially when the scene is moving. Elevation and shape are sort of the same thing, so we've still only really got one attribute. Adding contours is quite nice (above, middle), and only uses a narrow slice of the luminance channel... but again, it's the same data. Much better to add new data. Similarity (a member of the family that includes coherence, semblance, and so on) is a natural fit: it emphasizes a particular aspect of the shape of the surface, but which was measured independently of the interpretaion, directly from the data itself. And it looks awesome (above, right).

Three attributes, four

OK, we have elevation and/or shape, and similarity. What else can we add? Another intuitive attribute of seismic is amplitude (below, left) — closely related to the strength of the reflected energy. Two things: we don't trust amplitudes in areas with low fold — so we can mask those (below, middle). And we're only really interested in bright spots, so we can edit the opacity profile of the attribute and make low values transparent (below, right). Two more attributes — amplitude (with a cut-off that reflects my opinion of what's interesting — is that an attribute?) and fold.

Since we have only used one hue for the amplitude, and it was not in Matteo's colour bar, we can layer it on the original map without clobbering anything. Unfortunately, there's no easy way for the low fold mask to modulate amplitude without interfering with elevation, because the elevation map needs to be almost completely opaque. What I need is a way to modulate a surface's opacity with an attribute it is not displaying with hue...

Thickness maps

The second question — what to colour thicks — is easy. Thicks should be towards the red end of the spectrum, sometimes not-necessarily-intuitively called 'warm' colours. (As I mentioned before in the comments, a quick Google image poll suggests that about 75% of people agree). If you colour your map otherwise, perhaps because you like the way it suggests palaeobathymetry in some depositional settings, be careful to make this very clear with labels and legends (which you always do anyway, right?). And think about just making a 'palaeobathymetry' map, not a thickness map.

I suspect there are lots of quite personal opinions out there. Like grammar, I do think much of this is a matter of taste. The only real test is clarity. Do you agree? Is there a right and wrong here? 

Make some geophysics!

Last month we announced the Geophysics Hackathon. It's one month away today, so I thought I'd post a quick update with the latest developments.

First: good news. The event will be completely free to attend.

Second, I wanted to clear something up. The hackathon is not about hacking, as in gaining illicit access to other people's computers. That would be bad. Today, 'hacking' has reverted to its original MIT meaning, and tends to mean rapid prototyping and tool creation — playing! — with software, with hardware, or with life in general

START Houston

We'll be camped out at START Houston, a progressive co-working and incubation space in the East Downtown area of Houston. This is exciting because START is plugged right in to the most innovative, fast-moving, energetic people in Houston. Some of them even work in the energy business! 

What you can hack

You can come to the hackathon and do anything you like — closed or open source, on your own or in a team, web or mobile or desktop or mainframe. But we are holding a contest, for those that are interested. The contest has some rules. But the first rule of the day is, you don't have to enter the contest. If you prefer, just come and learn something new — I will be there to get you started. Stuck for ideas? There are loads on the wiki page.

Prizes

I'm rather excited about the prizes. I don't want to let the cat completely out of the bag, but we have some Nexus 7 tablets to give away, some Raspberry Pi kits, lots of must-read books, and several years' worth of access to MyBalsamiq — a cloud-based user-interface design tool.

Huge thanks to Enthought and Balsamiq for helping to make all this awesome happen.

Join us! Sign up...

As of right now, there are 16 people coming to the two days. Can you help us get to 25? Send this post to someone you know would be into it... and come along yourself. If you know geophysics or seismic interpretation, or you have a good head for business, or you like math and stats, or you know how to code — you'll fit right in. See you there!

Five more things about colour

Last time I shared some colourful games, tools, and curiosities, including the weird chromostereopsis effect (right). Today, I've got links to much, much more 'further reading' on the subject of colour...


The provocation for this miniseries was Robert 'Blue Marble' Simmon's terrific blog series on colour, which he's right in the middle of. Robert is a data visualization pro at NASA Earth Observatory, so we should all listen to him. Here's his collection (updated after the original writing of this post):

Perception is everything! One of Agile's best friends is Matteo Niccoli, a quantitative geophysicist in Norway (for now). And one of his favourite subjects is colour — there are loads of great posts on his blog. He also has a fine collection of perceptual colour bars (left) for most seismic interpretation software. If you're still using Spectrum for maps, you need his help.

Dave Green is a physicist at the University of Cambridge. Like Matteo, he has written about the importance of using colour bars which have a linear increase in perceived brightness. His CUBEHELIX scheme (above) adapts easily to your needs — try out his colour bar creator. And if this level of geekiness gets you going, try David Dalrymple or Gregor Aisch.

ColorBrewer is a legendary web app and add-in for ArcGIS. It's worth playing with the various colour schemes, especially if you need a colour bar that is photocopy friendly, or that can still be used by colour blind people. The equally excellent, perhaps even slightly more excellent, i want hue is also worth playing with (thanks to Robert Simmon for that one). 

In scientific publishing, the Nature family of journals has arguably the finest graphics. Nature Methods carries a column called Points of View, which looks at scientific visualization. This mega-post on their Methagora blog links to them all, and covers everything from colour and 3D graphics to broader issues of design and typography. Wonderful stuff.

Since I don't seem to have exhausted the subject yet, we'll save a couple of practical topics for next time:

  1. A thought experiment: How many attributes can a seismic interpreter show with colour in a single display?
  2. Provoked by a reader via email, we'll think about that age old problem for thickness maps — should the thicks be blue or red?

Five things about colour

The fact that colour is a slippery subject is powerfully illustrated by my favourite optical illusion. Look at this:

Squares A and B are the same shade of grey. It's so hard to believe that you might need to see the proof to be convinced. 

Chromostereopsis is a similarly disarming effect that you may have noticed on maps with bright spectrum colour bars. Most people perceive blue and red on different depth planes, so the pseudo-3D effect can work in your favour and make the map 'pop' (This is not a good reason to use a spectrum colour bar, however... more on this next time). I notice that at least one set designer knows about the effect, making William Shatner pop on the TV show Have I Got News For You:

Color is a fun way to test your colour intuition. The game starts easy, but is very hard by the end as you simulatneously match colour tetrads. The first time I played I managed 9.8, which I am not-very-secretly quite pleased about. But I haven't been able to repeat the performance.

X-Rite's Online Color Challenge is also tough. You have to sort the very subtle colours into order. It takes a while to play but is definitely worth it. If your job depends on spotting subtle effects in images (like seismic data, for example) then stand by to learn something about your detection system. 

Color blindness will change how these games work, of course, and should change how we make maps, figures, and slides. Since up to about 5% of a large audience might be colour blind, you might want to think about how your presentations look to them. You can easily check with Vischeck and correct images for colourblind people with the Daltonizer. They can still be beautiful, but you can avoid certain colour combinations and reach a wider audience.

I have lots more links about colour to share in the next post, including some required reading from Rob Simmon and Matteo Niccoli, among others. In the meantime, have you come across any handy colour tools, or has colour ever caught you out? Let us know in the comments.

The image of William Shatner is copyright and courtesy of Hat Trick Productions Ltd, London, UK, and used with permission.

First appearance datum at Green Point

Armed with the Geologic Field Guide of Newfoundland, last week I ventured to one of the most intensely scrutinized outcrops in the world. Green Point in Gros Morne National Park provides continuous exposure to more than 30 million years of sediment accumulation in the Iapetus ocean. The rocks formed in deep water near the base of the ancient continental slope. It was awesome and humbling.

In January 2000, the International Union of Geological Sciences designated Green Point as a Global Stratotype Section and Point (GSSP). That's an official international reference point for the geologic time scale. I learned after the fact that there are only a handful of these in North America.

Researchers and students at Memorial University and elsewhere studied more than 10,000 fossils from Green Point, using tiny conodonts and delicate graptolites to locate the boundary between the Cambrian and Ordovician periods, 488 Ma in the past. They have narrowed it down to a single layer, Bed 23, that contains the first appearance of the conodant species, Iapetognathus fluctivagus.

To the best of my estimatation, I have indicated the location of Bed 23 with the white dashed line in the figure to the right, and with the pointing figure of my *ahem* geologic scale marker in the photograph below.

Snapshots from the Outcrop

Being the massive natural exhibition that it is, there are likely volumes of things to observe and measure at Green Point. I had no agenda whatsoever, but here are four observations that caught my interest:

  1. Cavities from core plugs at regularly spaced intervals. Each piece taken and studied as part of an international scientific experiment, aimed at accurately identifying major turning points in earth's history. 
  2. Small scale fault with some antithetic joints reminiscent of some artifacts I have seen on seismic.
  3. and 4. A faulted limestone conglomerate bed. Shown from two different points of view. I am increasingly curious about the nature of the aperture of deformation zones. Such formidable forces, such a narrow region of strain.

I left with a feeling that I am sure is felt by most geologists leaving a site of extreme interest. Did I make enough observations? Did I collect enough data? I wish I had a GigaPan, or maybe portable LiDAR station. I feel reconnected to the vastness of scales over which earth processes occur, and the heterogeneity caused by well-understood systems playing out over inconceivable expanses of time. 

I'd like to flip the outcrop 120° counterclockwise, and build another stupid seismic model. What could mathematicians, programmers, and geoscientists do at this outcrop? A digital playground for integration awaits.

Your next employment contract

You own your brain. The hackathon we're hosting has reminded me of this. 

More than one person has expressed difficulty with reconciling their wish to participate in the event with their employment contract, which probably says something like this:

Everything you do belongs to us.

Your family photos belong to you

Yesterday I read something about US government intellectual property. I knew that most government content is free of copyright, and what I read confirmed it. It's a sort of mirror image of the situation we have in industry (this is from ACQuipedia): 

Works created by Federal employees in the course of their official duties are automatically in the public domain and may not be copyrighted by anyone.

Interestingly, works not created in the course of their duties are their copyright as normal. So a soldier's photographs on her cellphone are her intellectual property, even if they were taken on duty (provided she's not a photographer).

Our community should stand up for something resembling this same rule in the corporate environment. Of course works created in the course of your duties as an employed geoscientist or engineer belong to your employer. But clearly your family vacation photographs do not. And just as clearly, your edits to Wikipedia articles do not (unless that's your job, you lucky thing). And neither, with certain provisos, do your contributions to a hackathon.

What provisos? Well, there are other, equally important clauses about confidentiality in your contract. You may not legally disclose the company's proprietary intellectual property. So you can't show up at a hackathon and code up your company's latest migration algorithm. But coding up a new, previously unknown algorithm would be ethically OK, but if you're a geophysical programmer I can see the potential conflict there — it's a judgment call. I hope your company trusts you to make a fair decision. If the algorithm turns out to be awesome, and had 3 collaborators from different companies, then I say they should all be glad you got together to invent it. Innovation is not a zero-sum game.

Shop rights

It turns out that there's a common law provision for the ownership of your brain. So-called shop rights are generally upheld by courts, at least in the US. According to an excellent guide to IP from the IEEE, they go like this (there are variants):

  1. confidential information and inventions or other creations made during the course of employment as a normal part of job duties belong to the employer
  2. inventions made by the employee off the job, using the employee's own time and materials, will generally belong to the employee (absent fraud, related inplant work of which the employee might be aware, or other special circumstances); and
  3. inventions not related to work duties, but created with some nontrivial use of the employer's time, funds or materials still belong to the employee, but the employer has limited rights to exploit the invention without payment of royalties or other compensation.

Awesome! This is perfectly sensible. Unfortunately, employers can write almost anything they like in their contracts, and it sounds to me like clauses that trample on these rights are fairly common. And they will continue to be common until people start refusing to sign contracts that contain them.

Demand change

In light of all this, here are 3 things to demand (yes, demand — you do actually have some bargaining power when someone tries to hire you) in your next employment contract:

  • At the very least, clauses limiting your shop rights should be removed. In their absence, conflicts will be resolved by the application of common law.
  • You may contribute to Wikipedia, SEG Wiki, PetroWiki, SubSurfWiki, and other open content projects.
  • You may contribute to OpendTect, Madagascar, and other open source software projects.
  • You may contribute to unstructured events, including but not limited to unconferences, hackathons, and idea jams. 

Bottom line: your employer owns some of your creations, specifically the ones you make for them, at work, with their data, their tools, their employees, and their ideas. But you own the rest, and you emphatically own your creativity.

Changing how we are employed is entirely up to us. Legal professionals will pin us down to the bare minimum of openness and freedom otherwise — it's their job. So push back, ask for change, and retain your brain.

Review: First Steps in Seismic Interpretation

Thomas Martin is a first-year graduate student at Scripps Institution of Oceanography. He got bored of waiting for us to review the seismic interpretation books (we are tectonically slow sometimes) and offered to review some for us. Thank you, Thomas! He's just about to set off on a research cruise to the Canadian Arctic on USCGC Healy to collect CHIRP seismic reflection data and sediment cores.


Herron, D (2012). First Steps in Seismic Interpretation. Geophysical Monograph Series 16. Society of Exploration Geophysicists, Tulsa, OK. Print ISBN 978-156080280-8. Ebook DOI 10.1190/1.9781560802938. List price: USD62. Member price: USD49. Student price: USD39.20

As a graduate student, this book has become quite the resource for me. It gives a good handle on basic seismic properties, and provides a solid introduction. Some of the topics it covers are not typically discussed in a geoscience journal papers that use seismic reflection data (migration comes to mind). The table of contents gives an idea of the breadth:

  1. Introduction
  2. Seismic response
  3. Seismic attributes — including subsections on amplitude, coherence, and inversion
  4. Velocity — sonic logs, well velocity surveys, seismic velocities, anisotropy, and depth conversion
  5. Migration
  6. Resolution
  7. Correlation concepts — horizons and faults, multiples, pitfalls, automatic vs manual picking
  8. Correlation procedures — loop tying, jump correlations, visualization
  9. Data quality and management — keeping track of everything
  10. Other considerations — e.g. 4D seismic, uncertainty and risk, and ergonomics

One of the great things about this book is that it's designed to be light on math, so all levels of geoscientists can pick it up. I have found this book invaluable because it is a great bridge from the 'pure' geophysicist to the seismic interpreter, and can improve the dialogue between these two camps. Chapter 10 is 'leftover' subjects, but it is one of the most helpful in the book as it covers approximations, career development, and a fantastic section on time spent and value added.

The book covers a lot of ground but, with the book coming in at under 200 pages, nothing in detail — this is not meant to be the ultimate text for seismic interpretation. I think the book is a little light for nearly $40 plus shipping, however (student price; the list price is over $60). I would recommend it to graduate students or early career scientists with an interest in seismic data, across the full range of geoscience disciplines. The price for a student is high for a small paperback book under 200 pages, but the content is worth it.

If you liked this review please leave an encouraging comment for Thomas.