What technology?

This is my first contribution to the Accretionary Wedge geology themed community blog. Charles Carrigan over at Earth-like Planet is hosting this months topic where he posts the question, "how do you perceive technology impacting the work that you do?" My perception of technology has matured, and will likely continue to change, but here are a few ways in which technology works for us at Agile. 

My superpower

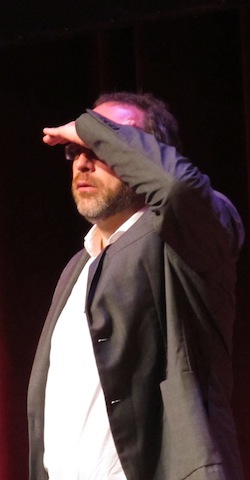
I was at a session in December where one of the activities was to come up with one (and only one) defining superpower. A comic-bookification of my identity. What is the thing that defines you? The thing that you are or will be known for? It was an awkward experience for most, a bold introspection to quickly pull out a memorable, but not too cheesy, superpower that fit our life. I contemplated my superhuman intelligence, and freakish strength... too immodest. The right choice was invisibility. That's my superpower. Transparency, WYSIWYG, nakedness, openness. And I realize now that my superpower is, not coincidentally, aligned with Agile's approach to technology. 

For some, technology is the conspicuous interface between us and our work. But conspicuous technology constrains your work, ordains it even. The real challenge is to use technology in a way that makes it invisible. Matt reminds me that how I did it isn't as important as what I did. Making the technology seem invisible means the user must be invisible as well. Ultimately, tools don't matter—they should slip away into the whitespace. Successful technology implementation is camouflaged. 

I is for iterate

Technology is not a source of ideas or insights, such as you'd find in the mind of an experienced explorationist or in a detailed cross-section or map. I'm sure you could draw a better map by hand. Technology is only a vehicle that can deliver the mind's inner constructs; it's not a replacement for vision or wisdom. Language or vocabulary has nothing to do with it. Technology is the enabler of iteration. 

So why don't we iterate more in our scientific work? Because it takes too long? Maybe that's true for a hand-drawn contour map, but technology is reducing the burden of iteration. Because we have never been taught humility? Maybe that stems from the way we learned to learn: homework assignments have exact solutions (and are done only once), and re-writing an exam is unheard of (unless you flunked it the first time around).

What about writing an exam twice to demonstrate mastery? What about reading a book twice, in two different ways? Once passively in your head, and once actively—at a slower pace, taking notes. I believe the more ways you can interact with your media, data, or content, the better work will be done. Students assume that the cost required to iterate outweighs the benefits, but that is no longer the case with digital workflows. Embracing technology's capacity to iterate seemlessly and reliably is what a makes a grand impact in our work.

What do we use?

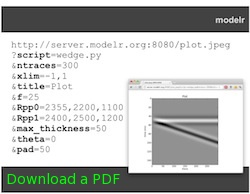
Agile strives to be open as a matter of principle, so when it comes to software we go for open source by default. Matt wrote recently about the applications and workstations that we use. 

First class in India

I wrote this post yesterday morning, sitting in the Indira Ghandi International Airport in Delhi, India.

Where am I?

I'm in India. Some quick facts:

I met some of these recent graduates last week, in an experimental corporate training course. Cairn India has been running a presentation skills course for several years, provided by a local trainer called Yadhav Mehra. Yadhav is a demure, soft-spoken man, right up until he stands up in front of his students. Then he becomes a versatile actor and spontaneous stand-up, swerving with the confidence of a Delhi cab driver between poignant personal stories and hilarious what-not-to-do impressions. I’ve been on the receiving end of plenty of courses before, but Yadhav really made me see ‘training’ as a profession in itself, with skills and standards of its own. I am grateful for that.

How did I end up here?

Serendipity is a wonderful thing. Last fall, Susan Eaton—whom I’d met in the pub after teaching for the first time—wrote a nice piece about my then-new writing course. One of my long-lost PhD supervisors, Stuart Burley, read this article in his office at Cairn India in Delhi, and it triggered a thought. He had Yadhav, a pro trainer, helping his super-bright geoscience and engineering grads with their presentation skills, but they also needed coaching in writing. 

Their education provides them with...

the traditional written communication vernacular employed in the physical sciences, in which exposition is lengthily embellished with extraneous verbiage, and the passivum, or passive voice in its not uncommon appellation, is unfailingly and rigorously exercised.

You get my point. Stuart’s thought was: let’s do combine the two courses!

What happened?

The great thing about Stuart is that, along with breadth of experience and penetrating geological insight, he’s practical—he gets stuff done. (Like almost everything else in my dim-witted student days, I didn’t appreciate how valuable this was at the time.) So the three of us planned a 3-day course that combined my day's worth of writing coaching with Yadhav's two-day presentation course. Yadhav brought some didactic rigour, and I brought some technical depth. Like all collectable first edition, it had some rough edges, but it went beautifully. Students wrote an extended abstract for a conference paper on Tuesday, then presented their paper on Thursday—they made a great effort, and all did brilliantly.

I hope we run the course again—I'd love to see it reach its full potential. 

In the meantime, if you're interested in exploring ways to get more people in your organization writing a little better, or a little more often, do get in touch! You can find out more here. 

The evolution of open mobile geocomputing

A few weeks ago I attended the EAGE conference in Copenhagen (read my reports on Day 2 and Day 3). I presented a paper at the open source geoscience workshop on the last day, and wanted to share it here. I finally got around to recording it:

As at the PTTC Open Source workshop last year (Day 1Day 2, and my presentation), I focused on mobile geocomputing — geoscience computing on mobile devices like phones and tablets. The main update to the talk was a segment on our new open source web application, Modelr. We haven't written about this project before, and I'd be the first to admit it's rather half-baked, but I wanted to plant the kernel of awareness now. We'll write more on it in the near future, but briefly: Modelr is a small web app that takes rock properties and model parameters, and generates synthetic seismic data images. We hope to use it to add functionality to our mobile apps, much as we already use Google's chart images. Stay tuned!

If you're interested in seeing what's out there for geoscience, don't miss our list of mobile geoscience apps on SubSurfWiki! Do add any others you know of.

Turning students into maniacs

In Matt's previous post, he urged people to subscribe to Jimmy Wales' vision of expanding collective intelligence. And it got me thinking about why the numbers aren't as high as they could be (should be), and why they might be dropping. Here are a few excuses that I have plucked from the university-student mindset and I submit them as a micro-model of this problem. And let's face it, we are all students, in a loose sense of the word.

STUDENT EXCUSES

  • I don't know where to start: Students, those most adequately positioned to give back to the knowledge base of which they are at the forefront, don't know where to start. Looking out towards the vast sea of what already exists, it is hard to imagine what is missing. Walking up to a blank page, pen in hand, is way harder than being handed an outline, a rough sketch that needs some filling in and filling out. 
  • I didn't sign up to be a volunteer: Being a student has always been, and always will be, a selfish endeavour. To do anything outside what is expected is essentially volunteering. Most students, don't see it as their job, their problem, or haven't yet learned the benefits and advantages it brings.
  • Someone else is better than me: Sounds timid and insecure, which I suppose may require some creative coaxing. Surely, there is probably somebody else out there more suited to draw seismic polarity cartoons than I, but volunteers don't wait for someone else to volunteer, if that were the case, there would be no volunteering at all. 
  • Institutions stomped out my collabortive spirit: It might not be spoken this way, but the student has a number of forces acting against the survival of their natural collaborative and creative tendencies. You'd think they would be the first to "get it", but the student mindset (bright, ambitious, curious, tech-savvy, etc) has been ratcheted into one of discipline and conformance to the academic status quo. One filled with traditional notions of text books, unaffordable publication subscriptions, bureacratic funding and research processes.
  • Peer review is better than the commons: Students are not allowed to use Wikipedia in their research. Instead, it is reinforced that a handful of expert editors set the standards of academic diligence, which is supposedly superior to thousands of editors in the fray of the wiki. I say we place too much confidence in too few peer reviewers. Sure wikis have trust issues, but that may be deservedly detrimental to those who are too credulous. Has anyone been massively led astray by incorrect or sabotaged Wikipedia content? I doubt it.

Making maniacs

Of these excuses, all of them but the first have to do with the culture of traditional learning. But for the first, for people who want to get involved but really don't know how, maybe all they need is to be handed a few stubs. Give me a stub! Imagine a questionaire or widget that takes a user profile, and quasi-intelligently suggests sparse pages in need of work. This stub needs chippers, and you fit the profile. Like a dating site that matches you not with another person, but with gaps in the content web.

It occurs to me that the notion of studentship will transform—for those who want it. For some it will be a choice, and a privilege, to act less like a student, and more like a maniac.

Wiki maniacs wanted

Jimmy Wales, saluting the crowd at Wikimania 2012Jimmy Wales (right) believes profoundly in the Wikimedia Foundation's mission:

Imagine a world in which every single person on the planet is given free access to the sum of all human knowledge. That's what we're doing.

If that mission sounds a bit grand, that's because it is. The amazing thing about this crusade, possibly the most altruistic and ambitious goal ever undertaken, is that you can help. The grand mission, should you choose to accept it, belongs to you—and to every other highly privileged, highly educated person you know.

Wikipedia needs you

One of the most surprising things I heard last week at Wikimania was that the number of active editors is falling, down 4000 since 2011 at 85 000. You can help fix it: 

  • Create an account to watch pages, change the look and behaviour of Wikipedia, and edit articles without revealing your IP address.
  • Next time you see something wrong or incomplete, edit it! Just click Edit.
  • Help improve articles on your home town, your hobbies, and your profession.
  • Pick a subject you care about (Well logging?) and look for red links, which are articles in need of creation.
  • Join a project like WikiProject:Geology to collaborate with other editors.
  • The Wikimedia Foundation runs on donations. Donate!
  • If you want somewhere to practise, use your Wikipedia Sandbox (requires an account), or poke around on SEGwiki or SubSurfWiki, where you're always welcome.

Imagine a world in which you can contribute to the sum of all human knowledge. That's what we have.

Wiki maniacs unite

Last year, we decided to go to at least one non-geoscience conference every year. The idea is to meet other communities, learn about other fields, have some new ideas, and find more ways to be useful. So far, Evan and I have been to symposiums on mathematics, geothermal energy, being more awesome, and science online. Continuing in this vein, I just got home from Wikimania 2012 — the international conference about all things wiki.

Strictly speaking, Wikimania is about the Wikimedia movement, the global effort to "give to every single person on the planet free access to the sum of all human knowledge". This quest is supported by the Wikimedia Foundation, a non-profit organization of professional enthusiasts. Their most conspicuous project is Wikipedia, but it's far from being the only one. Have you heard of Wikimedia Commons? Wikisource? Wikibooks? Read all about them.

The conference was unlike anything I've ever been to. Despite attracting over 950 delegates, it felt more like a meeting of colleagues and friends than a conference of professionals and strangers. I've never felt such a strong undertow of common purpose, and quiet, deliberate action. The phrase intentional community was made for this group.

In short, Wikipedia looks even more awesome from the inside than it does from the outside.

If you too are a Wikipedia enthusiast, here are some things I learned:

  • The number of active editors has fallen by 4000 since 2011, to 85k
  • During the conference, the number of articles in English Wikipedia passed 4 million
  • Developers are working hard to make Wikipedia easier to edit, and big changes are coming
  • Wikipedia Zero is an important effort to make the site available to everyone
  • Developers are working on making Wikipedia available via SMS and other channels
  • Wikis—both private and public—are everywhere: schools, museums, libraries, galleries, academia, government, societies, and corporations

Next time, I'll list a few ways you can get more involved.

The photo is from Wikimedia Commons, licensed CC-BY-SA by User:Awersowy

Fabric facies

I set out to detect patterns in images, with the conviction that they are diagnostic of more telling physical properties of the media. Tea towel textures can indicate absorbency, durability, state of wear and tear, etc. Seismic textures can indicate things like depositional environment, degree of deformation, lithologic content, and so on:

Facies: A rock or stratified body distinguished from others by its appearance or composition.

Facies are clusters distinguishable in all visual media. Geophysicists shouldn't be afraid of using the word normally reserved by geologists—seismic facies. In the seismic case, instead of lithology, grain size, bedding patterns, and so on, we are using attributes such as amplitude, energy, coherency, and Haralick textures for classification.

The brain is good at pattern recognition and picking out subtleties. I can assign facies to the input data (A), based on on hues (B), or patterns (C). I can also count objects (D), interpret boundaries (E), and identify poorly resolved regions of an image (F) caused by shadows or noise. I can even painstakingly draw the pockmarks or divets in the right hand teatowel (G). All of these elements can be simultaneously held in the mind of the viewer and comprise what we naturally perceive as the properties of visual media. Isolating, extracting, and illustrating these visual features by hand remains tedious.

I am not interested in robot vision so computers can replace geophysical interpreters, but I am interested in how image classification can be used to facilitate, enrich, and expedite the interpretive process. You can probably already think of attributes we can use to coincide with this human interpretation from the examples I gave in a previous post.

Identifying absorbency

Let's set an arbitrary goal of classifying the ability to soak up water, or absorbency. Surely a property of interest to anyone studying porous media. Because absorbency is a media-property, not an optical property (like colour) or a boundary property (like edges), it makes sense to use texture classification. From the input image, I can count 5 different materials, each with a distinct pattern. The least tractable might be the rightmost fabric which has alternating waffle-dimple segments, troublesome shadows and contours, and patterns at two different scales. The test of success is seeing how this texture classification compares to the standard approach of visual inspection and manual picking. 

I landed on using 7 classes for this problem. Two for the white tea-towels, two for the green tea-towel, one for the blue, and one that seems to be detecting shadows (shown in dark grey). Interestingly, the counter top on the far left falls into the same texture class as the green tea-towel. Evidence that texture alone isn't a foolproof proxy for absorbency. To improve the classification, I would need to allow more classes (likely 8 or 9). 

It seems to me that the manual picks match the classification quite well. The picks lack detail, as with any interpretation, but they also lack noise. On the contrary, there are some locations where the classification has failed. It stuggles in low-light and over-exposed regions. 

If you are asking, "is one approach better than the other?", you are asking the wrong question. These are not mutually exclusive approaches. The ideal scenario is one which uses these methods in concert for detecting geologic features in the fabric of seismic data. 

Fabric clusters

There are many reasons we might want to use cluster analysis in our work. Geologists might want to sort hundreds of rock samples into a handful of rock types, a petrophysicist might want to group data points from well logs (as shown here), or a curious kitchen dweller may want to digitally classify patterns found in his (or her) linen collection.

Two algorithms worth knowing about when faced with any clustering problem are called k-means and fuzzy c-means clustering. They aren't the right solution for all clustering problems, but they are a good place to start.

k-means clustering — each data point gets assigned to one of k centroids (or centres) according to the centroid it is closest to. In the image shown here, the number of clusters is 2. The pink dots are closest to the left centroid, and the black dots are closest to the right centroid. To see how the classification is done, watch this short step-by-step video. The main disadvantage with this method is that if the clusters are poorly defined, the result seems rather arbitrary.

Fuzzy c-means clustering — each data point belongs to all clusters, but only to a certain degree. Each data point is assigned a probability of belonging to each cluster, and is thus easily assigned the class for which it has a highest probability. If a data point is midway between two clusters, it is still assigned to its closest cluster, but with lower probability. As the bottom image shows, data points on the periphery of cluster groups, such as those shown in grey may be equally likely to belong to both clusters. Fuzzy c-means clustering provides a way of capturing quantitative uncertainty, and even visualizing it.

Some observations fall naturally into clusters. It is just a matter of the observer choosing an adequate combination of attributes to characterize them. In the fabric and seismic examples shown in the previous post, only two of the four Haralick textures are needed to show a diagnostic arrangement of the data for clustering. Does the distribution of these thumbnail sections in the attribute space align with your powers of visual inspection?