Pick This again, again

Today we're proud to be launching the latest, all new iteration of Pick This!

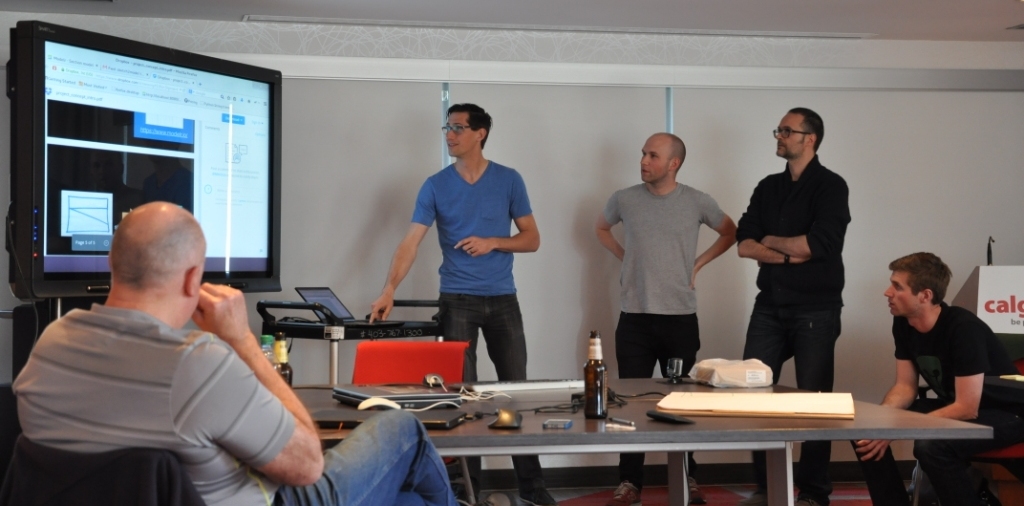
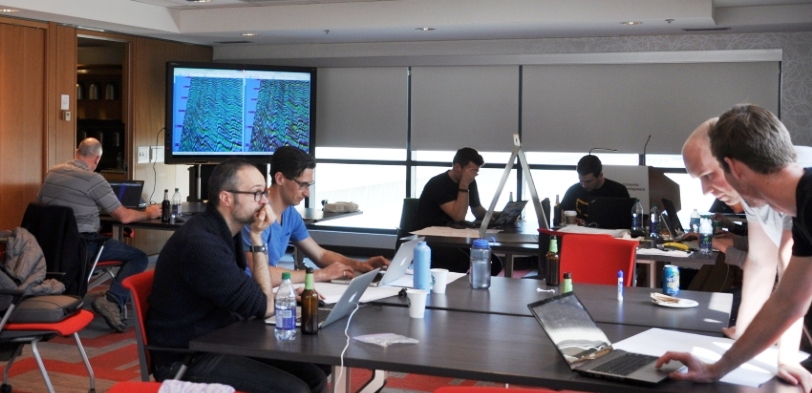
Last June I told you about some new features we'd added to our social image interpretation tool. This new release is not really about features, but more about architecture. Late in 2015, we were challenged by BG Group, a UK energy company, to port the app to Amazon's cloud (AWS), so that they could run it in their own environment. Once we'd done that, we brought the data over from Google — where it was hosted — and set up the new public site on AWS. It will be much easier for us to add new features to this version.

One notable feature is that you no longer have to have a Google account to log in! This may have been a show-stopper for some people.

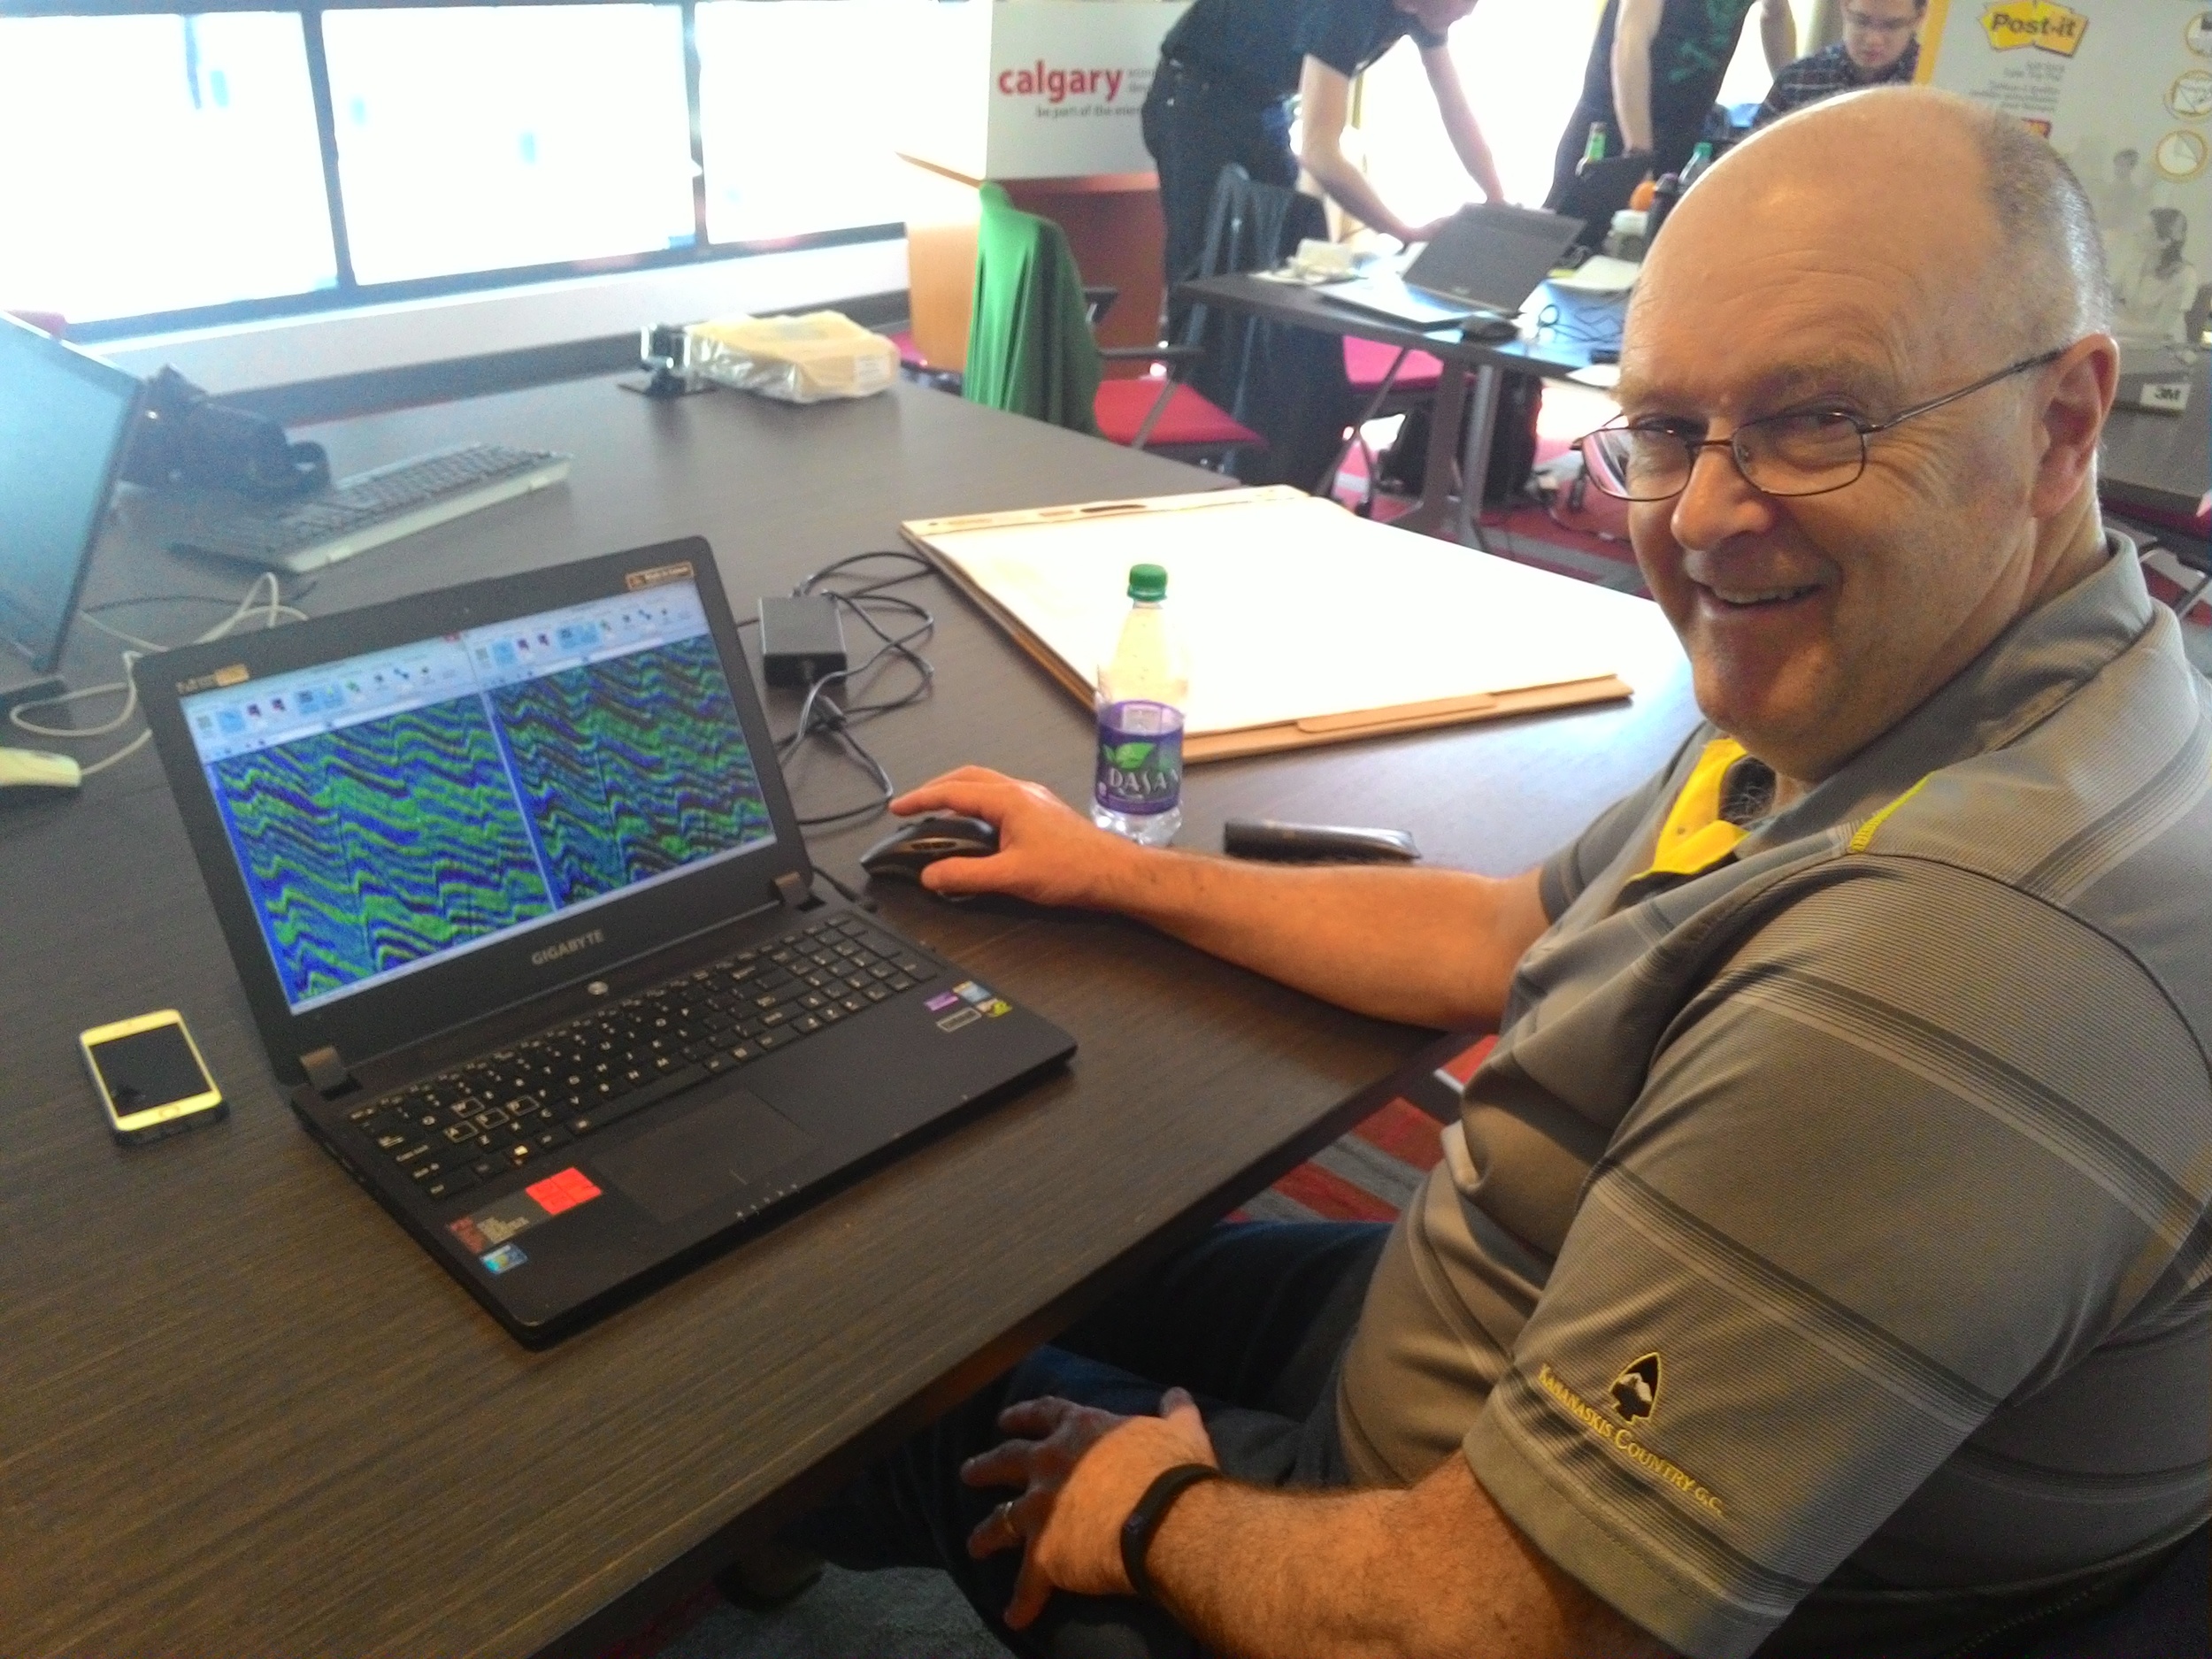
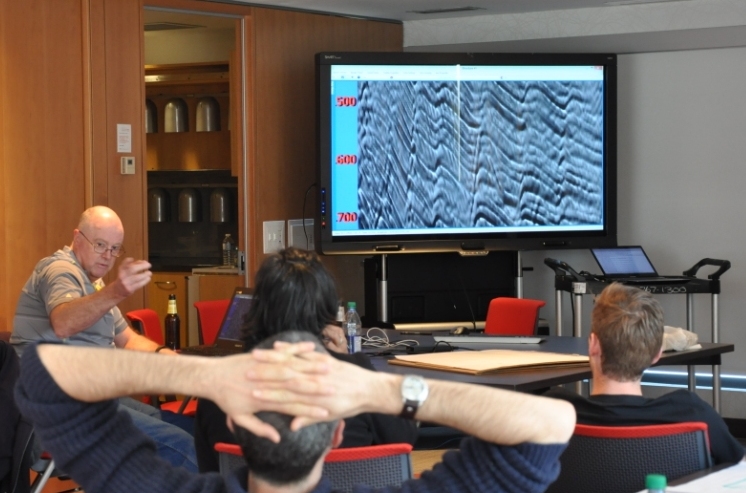
The app has been completely re-written from scratch, so there are a few differences. But fundamentally it's the same as before — you can ask your peers questions about images, and they can draw their answers. For example, Don Herron's "Where's the unconformity?" now has over 450 interpretations!

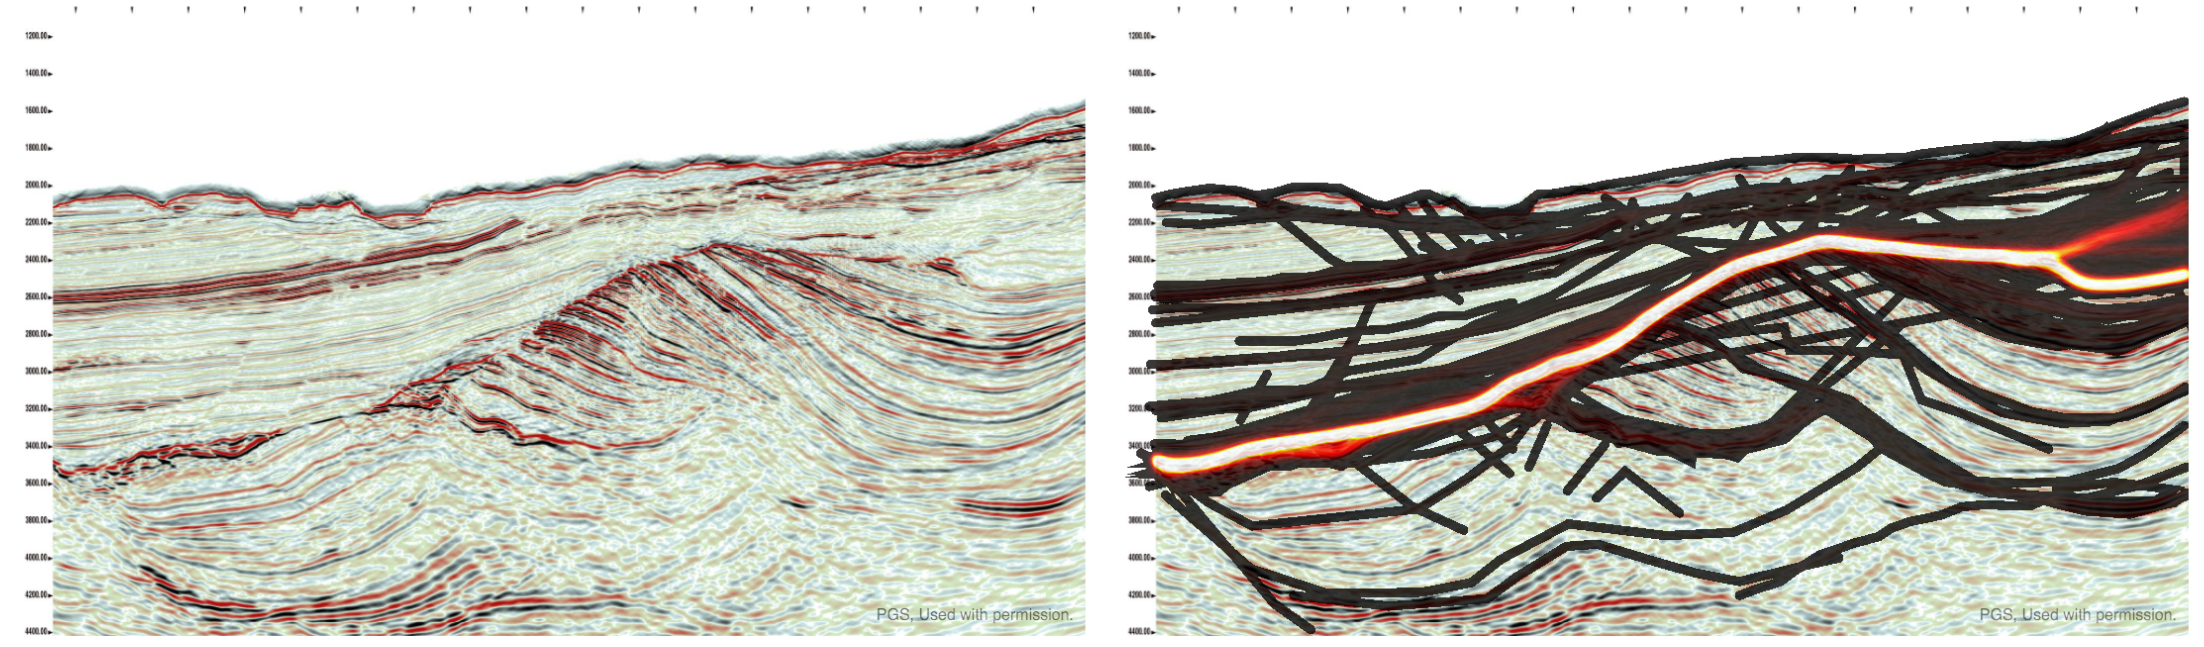
As we improve the tool over the coming weeks, we'll add ways to filter the results down, to attenuate some of the 'interpretation noise'. It's interesting to think about ways to represent this result — what is the 'true interpretation'? Is it the cloud of all opinions? Is there one answer?

Click here to visit the new site. For now it only plays nicely on a desktop computer (mobile is such a headache, but we will get there!). But you should be able to log in, interpret images, and upload new ones. You can let me know about bugs, or tweet @nowpickthis. If you like it, and I really hope you do, please tell your friends!


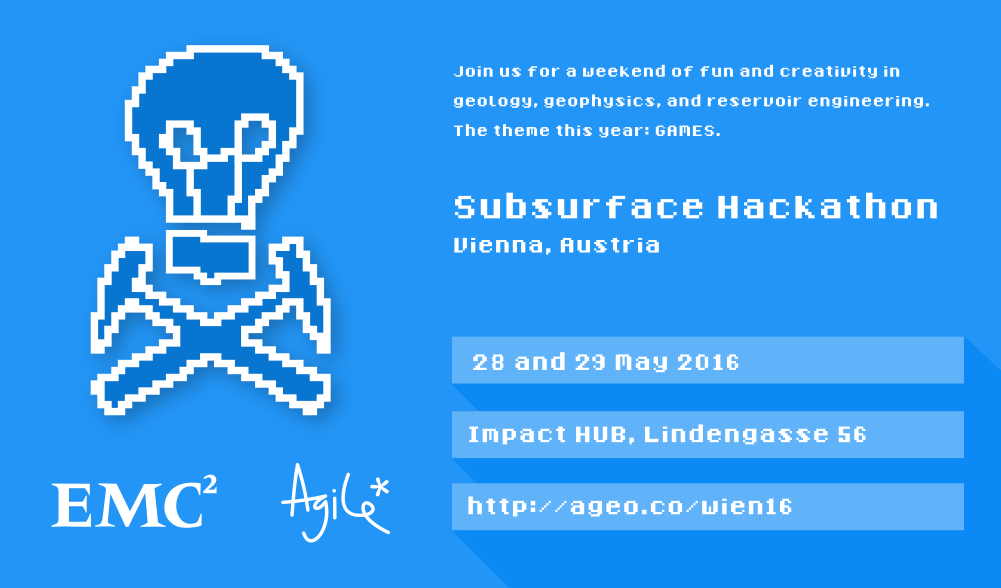
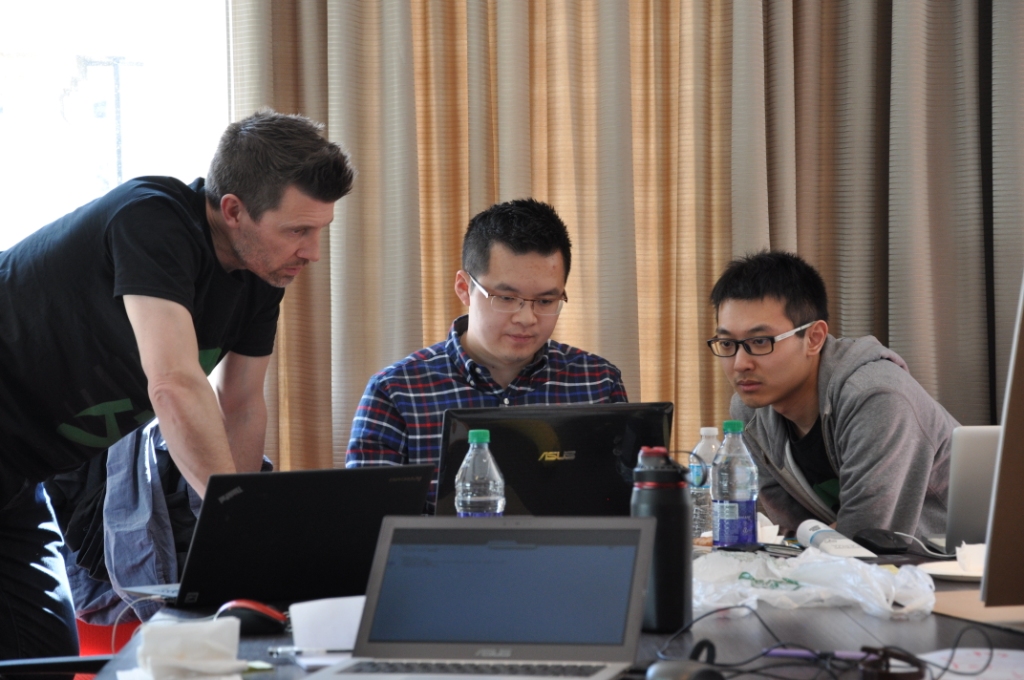
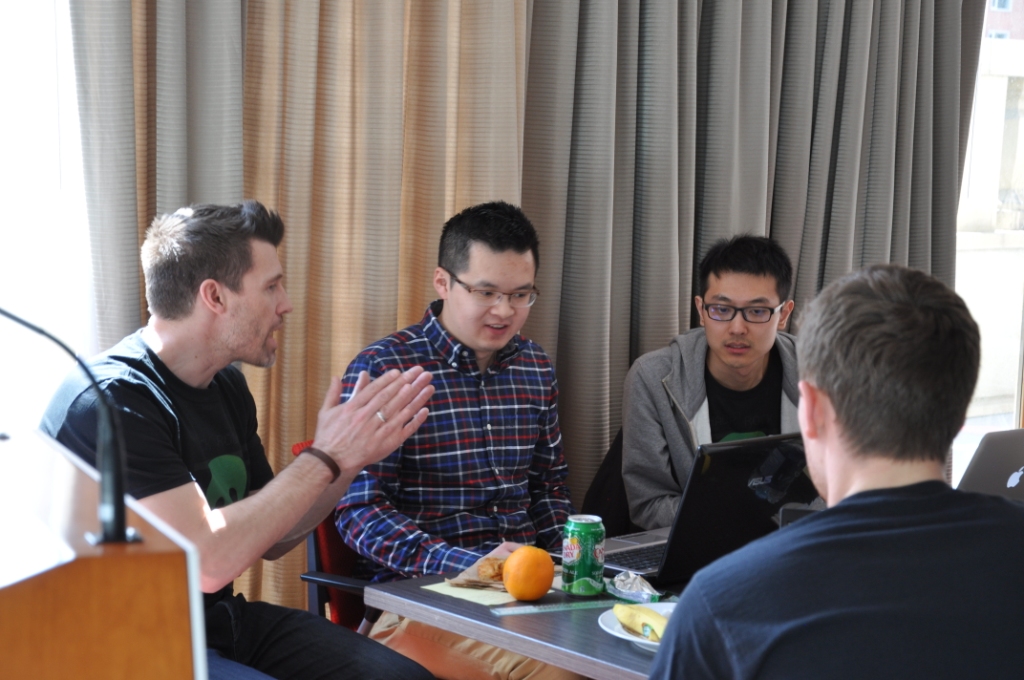
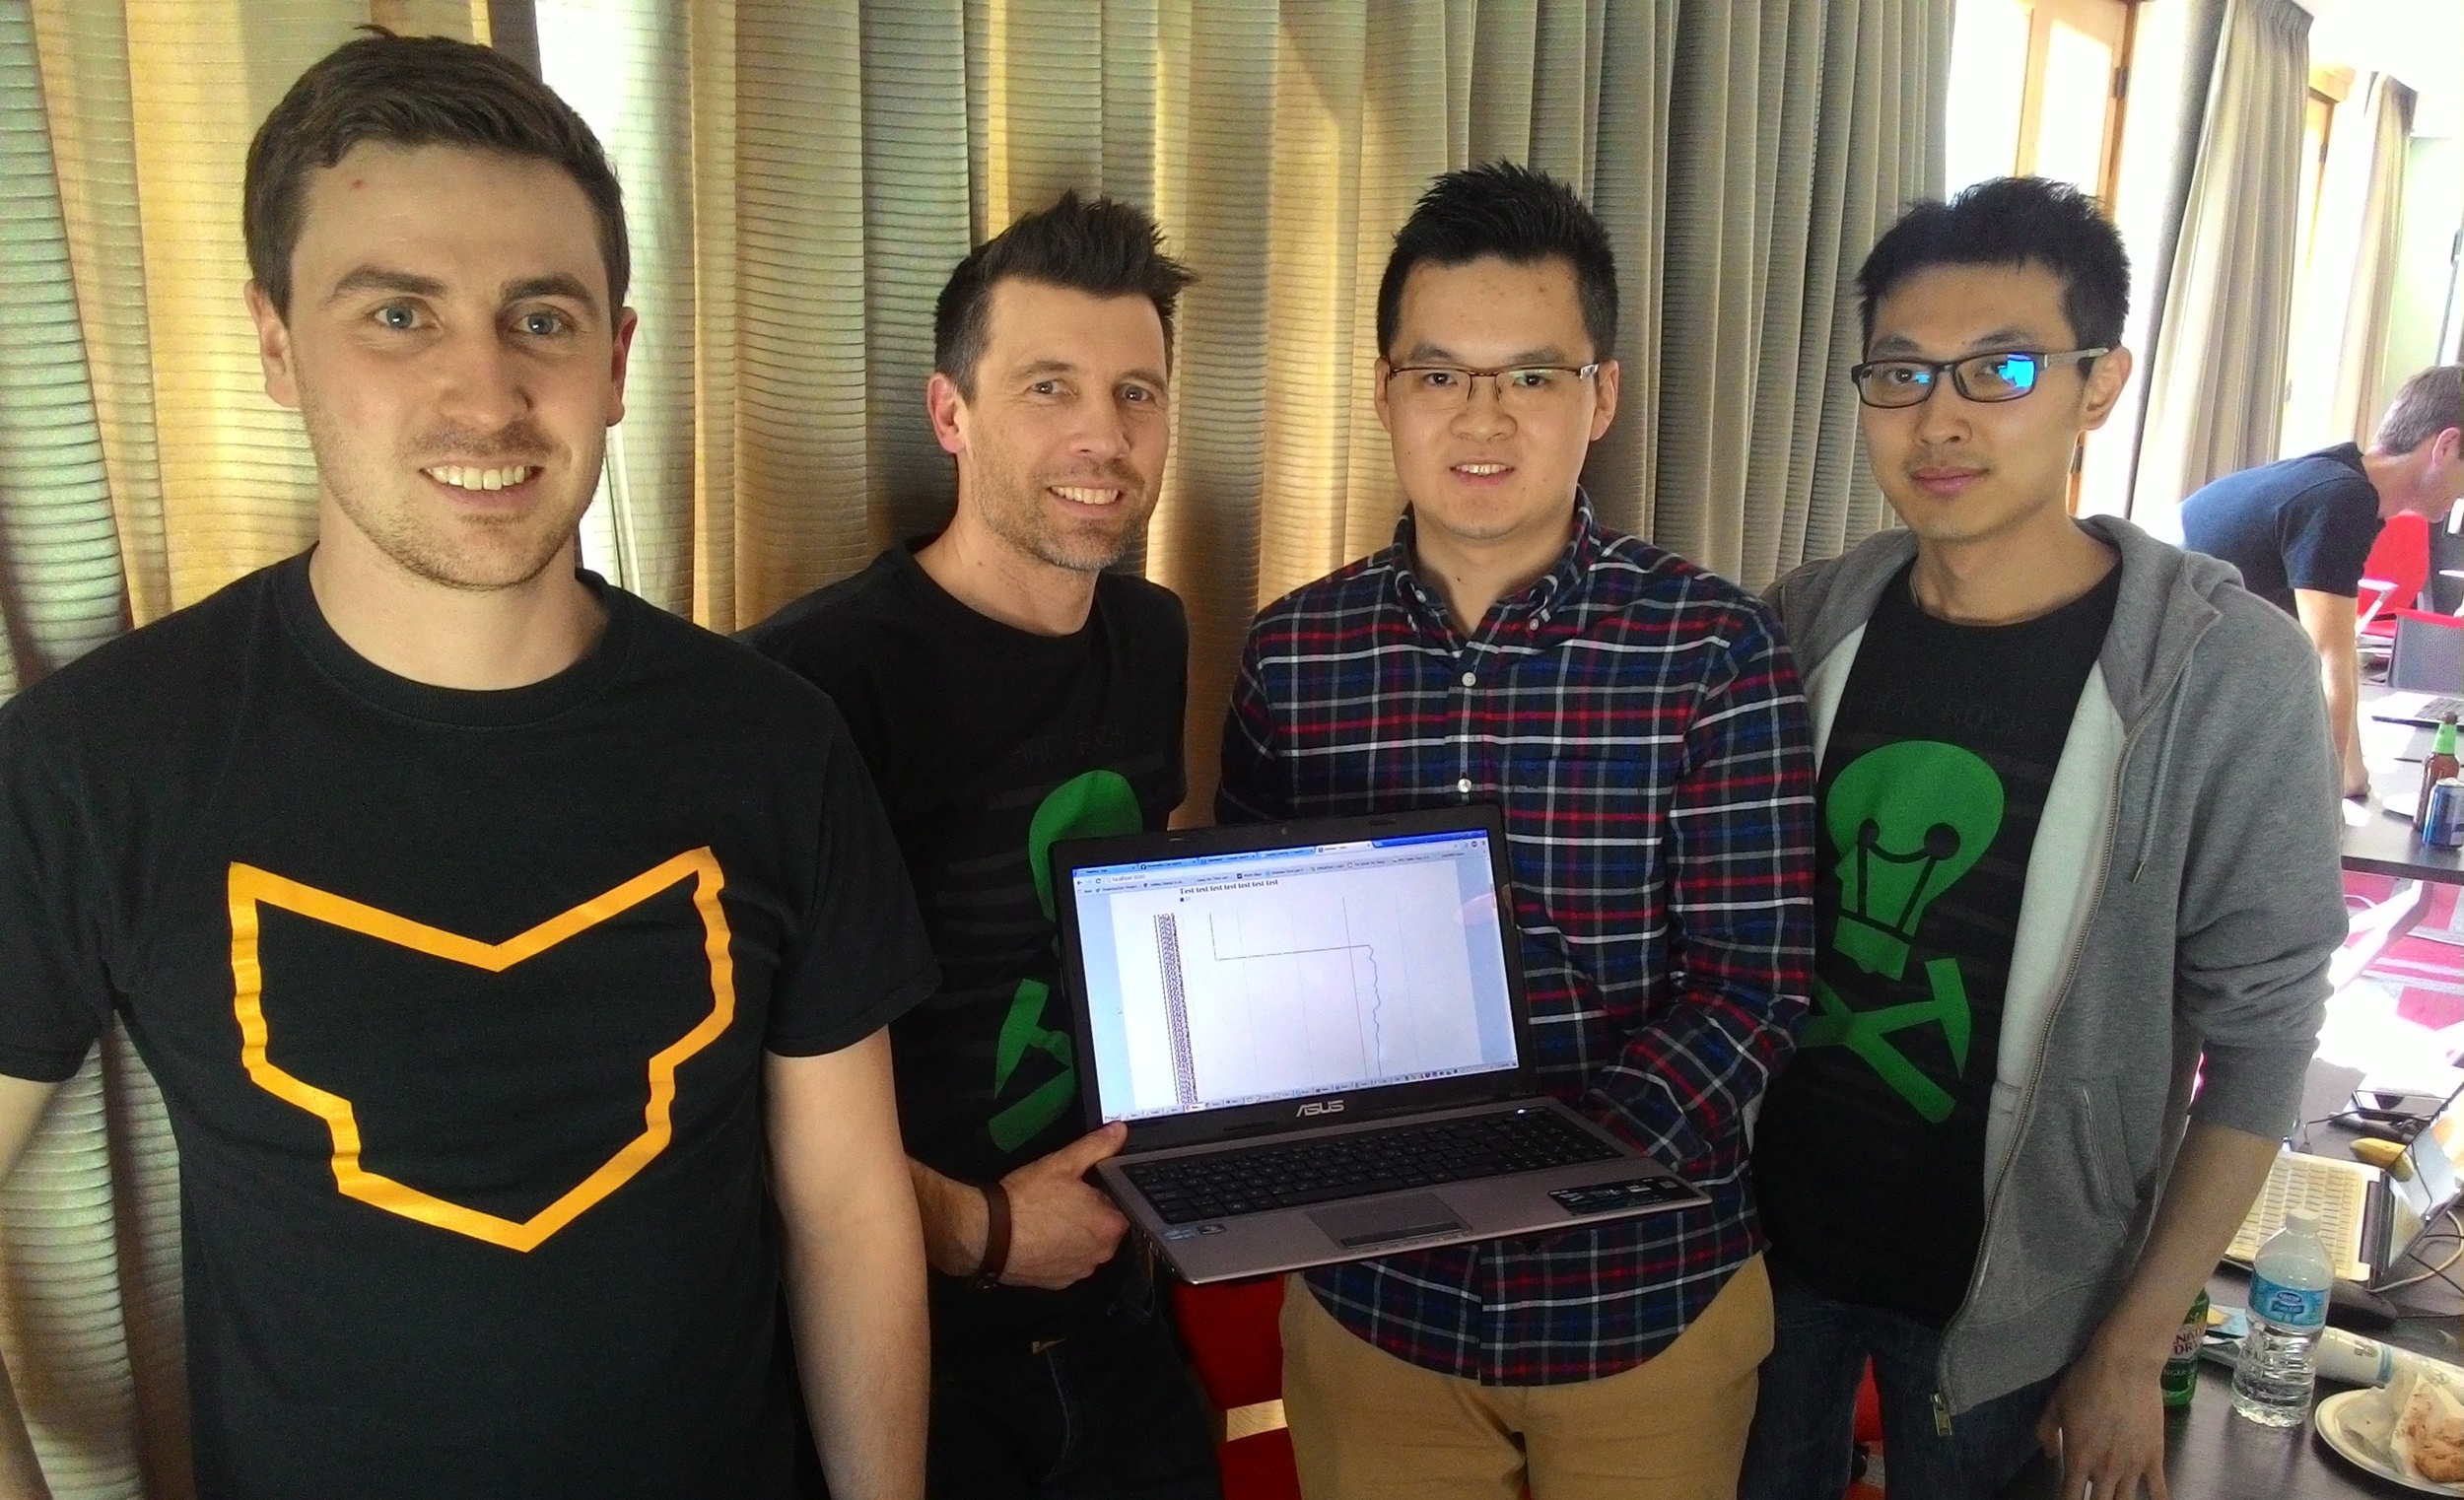
A quick reminder about the hackathon in Vienna next month. It will be an intense weekend of learning about programming and building some fun projects. I hope you can come, and if you know any geos in central Europe, please let them know!

Moving ahead with social interpretation

After quietly launching Pick This — our social image interpretation tool — in February, we've been busily improving the tool and now we're moving into 2016 with a plan for world domination. I summed up the first year of development in one of the interpretation sessions at SEG 2015. Here's a 13-minute version of my talk:

In 2016 we'll be exploring ways to adapt the tool to in-house corporate use, mainly by adding encryption and private groups. This way, everyone with @awesome.com email addresses, say, would be connected to each other, and their stuff would only be shared among the group, not with the general public.

Some other functionality is on the list of things to do:

  • Other types of interpretation than points, lines and polygons.
  • Ways to find content more easily, for example with tags like 'Seismic' or 'Outcrop'.
  • Ways to follow individuals, or get notifications of new interpretations on an image.
  • More ways to visualize and generally get at the data Pick This produces.

We're always open to suggestions. Please get in touch if you have a neat idea!

Canadian codeshow

Earlier this month we brought the world-famous geoscience hackathon to Calgary, tacking on a geocomputing bootcamp for good measure. Fourteen creative geoscientists came and honed their skills, leaving 4 varied projects in their wake. So varied in fact that this event had the most diversity of all the hackathons so far. 

Thank you to Raquel Theodoro and Penny Colton for all the great photographs. You both did a great job of capturing what went on. Cheers!

Thank you as well to our generous and generally awesome sponsors. These events would not be possible without them.

Bootcamp

The bootcamp was a big experiment. We have taught beginner classes before, but this time we also invited beyond-novice programmers to come and learn together. Rather than making it a classroom experience, we were trying to make a friendly space where people could learn from us, from each other, or from books or the web. After some group discussion about hackathons and dream projects (captured here), we split into two groups: beginners and 'other'. The beginners got an introduction to scientific Python; the others got a web application masterclass from Ben Bougher (UBC master's student and Agile code ninja). During the day, we harvested a pretty awesome list of potential future hackathon projects. 

Hackathon

The hackathon itself yielded four very cool projects, fuelled this time not by tacos but by bánh mì and pizza (separately):

  1. Hacking data inside Seismic Terrain Explorer, by Steve Lynch of Calgary
  2. Launching GLauncher, a crowdfunding tool, by Raquel Theodoro of Rio de Janeiro and Ben Bougher of UBC
  3. Hacksaw: A quick-look for LAS files in a web app, by Gord Foo, Gerry Cao, Yongxin Liu of Calgary, plus me
  4. Turning sketches in to models, by Evan Saltman, Elwyn Galloway, and Matteo Niccoli of Calgary, and Ben again

Sketch2model was remarkable for a few reasons: it was the first hackathon for most of the team, they had not worked together before, Elwyn dreamt up the idea more or less on the spot, and they seemed to nail it with a minimum of fuss. Matteo quietly got on with the image processing magic, Evan and Ben modified modelr.io to do the modeling bit, and Elwyn orchestrated the project, providing a large number of example sketches to keep the others from getting too cocky.

We'll be doing it all again in New Orleans this fall. Get it in your calendar now!

Pick This! Social interpretation

PIck This is a new web app for social image interpretation. Sort of Stack Exchange or Quora (both awesome Q&A sites) meets Flickr. You look for an interesting image and offer your interpretation with a quick drawing. Interpretations earn reputation points. Once you have enough rep, you can upload images and invite others to interpret them. Find out how others would outline that subtle brain tumour on the MRI, or pick that bifurcated fault...

A section from the Penobscot 3D, offshore Nova Scotia, Canada. Overlain on the seismic image is a heatmap of interpretations of the main fault by 26 different interpreters. The distribution of interpretations prompts questions about what is 'the' an…

A section from the Penobscot 3D, offshore Nova Scotia, Canada. Overlain on the seismic image is a heatmap of interpretations of the main fault by 26 different interpreters. The distribution of interpretations prompts questions about what is 'the' answer. Pick this image yourself at pickthis.io.

The app was born at the Geophysics Hackathon in Denver last year. The original team consisted of Ben Bougher, a UBC student and long-time Agile collaborator, Jacob Foshee, a co-founder of Durwella, Chris Chalcraft, a geoscientist at OpenGeoSolutions, Agile's own Evan Bianco of course, and me ordering pizzas and googling domain names. By demo time on Sunday afternoon, we had a rough prototype, good enough for the audience to provide the first seismic interpretations.

Getting from prototype to release

After the hackathon, we were very excited about Pick This, with lots of ideas for new features. We wanted it to be easy to upload an image, being clear about its provenance, and extremely easy to make an interpretation, right in the browser. After some great progress, we ran into trouble bending the drawing library, Raphael.js, to our will. The app languished until Steve Purves, an affable geoscientist–programmer who lives on a volcano in the middle of the Atlantic, came to the rescue a few days ago. Now we have something you can use, and it's fun! For example, how would you pick this unconformity

This data is proprietary to MultiKlient Invest AS. Licensed CC-BY-SA. 

This data is proprietary to MultiKlient Invest AS. Licensed CC-BY-SA. 

This beautiful section is part of this month's Tutorial in SEG's The Leading Edge magazine, and was the original inspiration for the app. The open access essay is by Don Herron, the creator of Interpreter Sam, and describes his approach to interpreting unconformities, using this image as the partially worked example. We wanted a way for readers to try the interpretation themselves, without having to download anything — it's always good to have a use case before building something new. 

What's next for Pick This?

I'm really excited about the possibilities ahead. Apart from the fun of interpreting other people's data, I'm especially excited about what we could learn from the tool — how long do people spend interpreting? How many edits do they make before submitting? And we'd love to add other modes to the tool, like choosing between two image enhancement results, or picking multiple features. And these possibilities only multiply when you think about applications outside earth science, in medical imaging, remote sensing, or astronomy. So much to do, so little time! 

We trust your opinion. Maybe you can help us:

  • Is Pick This at all interesting or fun or useful to you? Is there a use case that occurs to you? 
  • Making the app better will take time and therefore money. If your organization is interested in image enhancement, subjectivity in interpretation, or machine learning, then maybe we can work together. Get in touch!

Whatever you do, please have a look at Pick This and let us know what you think.

Private public data

Our recent trip to the AAPG Annual Convention in Houston was much enhanced by meeting some inspiring geoscientist–programmers. People like...

  • Our old friend Jacob Foshee hung out with us and built his customary awesomeness.
  • Wassim Benhallam, at the University of Utah, came to our Rock Hack and impressed everyone with his knowledge of clustering algorithms, and sedimentary geology.
  • Sebastian Good, of Palladium Consulting, is full of beans and big ideas — and is a much more accomplished programmer than most of us will ever be. If you're coding geoscience, you'll like his blog.
  • We had a laugh with Nick Thompson from Schlumberger, who we bumped into at a 100% geeky meet-up for Python programmers interested in web sockets. I cannot explain why we were there.

Perhaps the most animated person we met was Ted Kernan (right). A recent graduate of Colorado School of Mines, Ted has taught himself PHP, one of the most prevalent programming languages on the web (WordPress, Joomla, and MediaWiki are written in PHP). He's also up on all the important bits of web tech, like hosting, and HTML frameworks.

But the really cool thing is what he's built: a search utility for public well data in the United States. You can go and check it out at publicwelldata.com — and if you like it, let Ted know!

Actually, that's not even the really cool thing. The really cool thing is how passionate he is about exposing this important public resource, and making it discoverable and accessible. He highlights the stark difference between Colorado's easy access to digital well data, complete with well logs, and the sorry state of affairs in North Dakota, where he can't even get his app in to read well names. 'Public data' can no longer mean "we'll sell you a paper printout for $40". It belongs on the web — machines can read too.

More than just wells

There's so much potential power here — not only for human geoscientists looking for well data, but also for geoscientist–programmers building tools that need well data. For example, I imagine being able to point modelr.io at any public well to grab its curves and make a quick synthetic. Ready access to open services like Ted's will free subsurface software from the deadweight of corporate databases filled with years of junk, and make us all a bit more nimble. 

We'll be discussing open data, and openness in general, at the Openness Unsession in Calgary on the afternoon of 12 May — part of GeoConvention 2014. Join us!

The most important thing nobody does

A couple of weeks ago, we told you we were up to something. Today, we're excited to announce modelr.io — a new seismic forward modeling tool for interpreters and the seismically inclined.

Modelr is a web app, so it runs in the browser, on any device. You don't need permission to try it, and there's never anything to install. No licenses, no dongles, no not being able to run it at home, or on the train.

Later this week, we'll look at some of the things Modelr can do. In the meantime, please have a play with it.
Just go to modelr.io and hit Demo, or click on the screenshot below. If you like what you see, then think about signing up — the more support we get, the faster we can make it into the awesome tool we believe it can be. And tell your friends!

If you're intrigued but unconvinced, sign up for occasional news about Modelr:

This will add you to the email list for the modeling tool. We never share user details with anyone. You can unsubscribe any time.

Invitation to a geophysics hackathon

Do you like to build things? Join us for two days of scientific software creation. We'll be in Houston on 21 & 22 September, right before the SEG Annual Meeting, building web and mobile apps to attack one of the unsolved problem themes we exposed in Calgary in May — error and uncertainty

Let's build something together

What displays, or calculators, or simulators, could you dream up to help understand, or compute, or visualize, or communicate, or reduce error and uncertainty in your work? How about stochastic synthetics? Well logs with error bars? Fuzzy inversion?

You don't have to be a programmer — teams need ideas, they need science, they need design, and they need presentation skills. Please bring your creativity and your courage. Bring whatever you have, but mainly your brain

I'm in, what now? 

If want to take part, sign up at hackathon.io. If you have an idea already, start a project there. We are still filling in some blanks but can say that the event will be in downtown Houston, starting at 9 am on Saturday 21 Sept and running till 6 pm on Sunday 22 Sept. It will be free for students; there will probably be a small fee for professionals. We can only take 8 teams, so get in early and be sure not to miss out! 

If you'd like to help make this event happen, we'd love to have you as a sponsor for the event. The two main opportunities for sponsorship are the catering, and the prizes, but we're open to ideasDrop us a line.

Last thing: Please share this post with someone you know who loves to make things. Or help spread us on social media with the hashtag #geophysicshack. Cheers!

News of the month

The last news of the year. Here's what caught our eye in December.

Online learning, at a price

There was an online university revolution in 2012 — look for Udacity (our favourite), Coursera, edX, and others. Paradigm, often early to market with good new ideas, launched the Paradigm Online University this month. It's a great idea — but the access arrangement is the usual boring oil-patch story: only customers have access, and they must pay $150/hour — more than most classroom- and field-based courses! Imagine the value-add if it was open to all, or free to customers.

Android apps on your PC

BlueStacks is a remarkable new app for Windows and Mac that allows you to run Google's Android operating system on the desktop. This is potentially awesome news — there are over 500,000 apps on this platform. But it's only potentially awesome because it's still a bit... quirky. I tried running our Volume* and AVO* apps on my Mac and they do work, but they look rubbish. Doubtless the technology will evolve rapidly — watch this space. 

2PFLOPS HPC 4 BP

In March, we mentioned Total's new supercomputer, delivering 2.3 petaflops (quadrillion floating point operations per second). Now BP is building something comparable in Houston, aiming for 2 petaflops and 536 terabytes of RAM. To build it, the company has allocated 0.1 gigadollars to high-performance computing over the next 5 years.

Haralick textures for everyone

Matt wrote about OpendTect's new texture attributes just before Christmas, but the news is so exciting that we wanted to mention it again. It's exciting because Haralick textures are among the most interesting and powerful of multi-trace attributes — right up there with coherency and curvature. Their appearance in the free and open-source core of OpendTect is great news for interpreters.

That's it for 2012... see you in 2013! Happy New Year.

This regular news feature is for information only. We aren't connected with any of these organizations, and don't necessarily endorse their products or services. Except OpendTect, which we definitely do endorse.

The evolution of open mobile geocomputing

A few weeks ago I attended the EAGE conference in Copenhagen (read my reports on Day 2 and Day 3). I presented a paper at the open source geoscience workshop on the last day, and wanted to share it here. I finally got around to recording it:

As at the PTTC Open Source workshop last year (Day 1Day 2, and my presentation), I focused on mobile geocomputing — geoscience computing on mobile devices like phones and tablets. The main update to the talk was a segment on our new open source web application, Modelr. We haven't written about this project before, and I'd be the first to admit it's rather half-baked, but I wanted to plant the kernel of awareness now. We'll write more on it in the near future, but briefly: Modelr is a small web app that takes rock properties and model parameters, and generates synthetic seismic data images. We hope to use it to add functionality to our mobile apps, much as we already use Google's chart images. Stay tuned!

If you're interested in seeing what's out there for geoscience, don't miss our list of mobile geoscience apps on SubSurfWiki! Do add any others you know of.

Building Tune*

Last Friday, I wrote a post on tuning effects in seismic, which serves as the motivation behind our latest app for Android™ devices, Tune*. I have done technical and scientific computing in the past, but I am a newcomer to 'consumer' software programming, so like Matt in a previous post about the back of the digital envelope, I thought I would share some of my experiences trying to put geo-computing on a mobile, tactile, always-handy platform like a phone.

Google's App Inventor tool has two parts: the interface designer and the blocks editor. Programming with the blocks involves defining and assembling a series of procedures and variables that respond to the user interface. I made very little progress doing the introductory demos online, and only made real progress when I programmed the tuning equation itself—the science. The equation only accounts for about 10% of the blocks. But the logic, control elements, and defaults that (I hope) result in a pleasant design and user experience, take up the remainder of the work. This supporting architecture, enabling someone else to pick it up and use it, is where most of the sweat and tears go. I must admit, I found it an intimidating mindset to design for somebody else, but perhaps being a novice means I can think more like a user? 

This screenshot shows the blocks that build the tuning equation I showed in last week's post. It makes a text block out of an equation with variables, and the result is passed to a graph to be plotted. We are making text because the plot is actually built by Google's Charts API, which is called by passing this equation for the tuning curve in a long URL. 

Agile Tune app screenshotUpcoming versions of this app will include handling the 3-layer case, whereby the acoustic properties above and below the wedge can be different. In the future, I would like to incorporate a third dimension into the wedge space, so that the acoustic properties or wavelet can vary in the third dimension, so that seismic response and sensitivity can be tested dynamically.

Even though the Ricker wavelet is the most commonly used, I am working on extending this to include other wavelets like Klauder, Ormsby, and Butterworth filters. I would like build a wavelet toolbox where any type of wavelet can be defined based on frequency and phase spectra. 

Please let me know if you have had a chance to play with this app and if there are other features you would like to see. You can read more about the science in this app on the wiki, or get it from the Android Market. At the risk (and fun) of nakedly exposing my lack of programming prowess to the world, I have put a copy of the package on the DOWNLOAD page, so you can grab Tune.zip, load it into App Inventor and check it out for yourself. It's a little messy; I am learning more elegant and parsimonious ways to build these blocks. But hey, it works!