Geophysics cheatsheet

A couple of weeks ago I posted the first cheatsheet, with some basic science tables and reminders. The idea is that you print it out, stick it in the back of your notebook, and look like a genius and/or smart alec next time you're in a meeting and someone asks, "How long was the Palaeogene?" (21 Ma) or "Is the P50 the same as the Most Likely? I can never remember," (no, it's not).

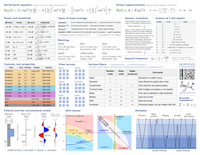
Today I present the next instalment: a geophysics cheatsheet. It contains mostly basic stuff, and is aimed at the interpreter rather than the weathered processor or number-crunching seismic analyst. I have included Shuey's linear approximation of the Zoeppritz equations; it forms the basis for many simple amplitude versus offset (AVO) analyses. But there's also the Aki–Richards equation, which is often used in more advanced pre-stack AVO analysis. There are some reminders of typical rock properties, modes of seismic multiples, and seismic polarity. 

As before, if there's anything you think I've messed up, or wrongly omitted, please leave a comment. We will be doing more of these, on topics like rock physics, core description, and log analysis. Further suggestions are welcome!

Click to download the PDF (1.6MB)

Where on Google Earth #259

I got WoGE #258 by the skin of my teeth, as I found the location but failed to fully identify the feature. I got the country rock right, but the igneous one wrong. As a soft rock chap, I consider this to be a technicality. Luckily, so did Metageologist Simon, the host. So I humbly accept my failings as a geoscientist and offer you the next instalment: number 259, and hereby post it at 1300 AST, 1700 GMT. 

Where on Google Earth is the best use of your lunch-break since Worms Reinforcements (the only computer game I ever wanted to play twice). If you are new to the game, it is easy to play. The winner is the first person to examine the picture below, find the location (name, link, or lat-long), and give a brief explanation of its geological interest. Please post your answer in the comments below. And thanks to the Schott Rule, which I am invoking, newbies have a slight edge: previous winners must wait one hour for each previous win before playing.

So: where and what on Google earth is this? (There are quite a few interesting things here, both geomorphologic and geologic; see how many you can get!)

What is a darcy?

Permeability is the capacity of a porous material to transmit fluids. The SI unit of permeability is m2 (area) but the units adopted by the petroleum industry have been named after Henry Darcy, who derived Darcy's law. A darcy is a confusing jumble of units which combines a standardized set of laboratory experiments. By definition, a material of 1 darcy permits a flow of 1 cm3/s of a fluid with viscosity 1 cP (1 mPa.s) under a pressure gradient of 1 atm/cm across an area of 1 cm2.

Apart from having obscure units with an empirical origin, permeability can be an incredibly variable quantity. It can vary be as low as 10–9 D for tight gas reservoirs and shale, to 101 D for unconsolidated conventional reservoirs. Just as electrical resistivity, values are plotted on a logarithmic scale. Many factors such as rock type, pore size, shape and connectedness and can effect fluid transport over volume scales from millimetres to kilometres.

Okay then, with that said, what is the upscaled permeability of the cube of rock shown here? In other words, if you only had to find one number to describe the permeability of this sample, what would it be? I'll pause for a moment while you grab your calculator... Okay, got an answer? What is it?

Read More

Innovations of the decade to come

On Monday I posted about what I think were the major advances in exploration and reservoir geoscience in the last decade. I wanted to follow up with a look at what might happen next.

As oil and gas become harder to find and develop safely, responsibly, and economically, our tools and data will of course only continue to improve. In particular, acceptable oil sands and shale gas recovery efficiency demand new ideas and new methods. I hope the next decade will see us making progress in some of these areas, some of them long-lived problems. Here's one, more after the break:

Read More

Innovations of the decade

Exploration geophysics and subsurface geoscience have come a long way since 2001. I thought I could just sneak under the wire before the end of January with a look back at the ideas and technologies that have changed how we find oil and gas today. The list isn't definitive, or even objective: I have my natural bias towards the realm of integrated subsurface interpretation. Anyone with another perspective would, I’m certain, pick different highlights of the previous decade. But these are mine.

It’s fun to think back to the year 2000. It’s the year I emigrated to Canada from Norway, so I remember it clearly. I was at university for most of the 1990’s, but my recollection is that exploration geoscience was all about the emergence of computer-based interpretation, the commoditization of 3D seismic data, huge integrated databases, and the acceptance of amplitude-versus-offset methods (or AVO) as a valid approach.

Here’s what I think were the greatest advances of the noughties, the decade 2001 to 2010...

Read More

Aerial geology

A few recent posts by others on aerial geology prompted me to gather them for future reference. Please add any I've missed to the comments!

Large collections

Both of these pages features lots of pictures from all over the United States, plus a few from other parts of the world. I was a bit surprised not to find collections of geological pictures taken from helicopters or hot air balloons. 

  •  John Louie's Aerial Geology with lots of images taken from commercial aircraft (like the one shown at right, of the Clayton Valley dunes in Nevada; from John's site).
  • Geology by Lightplane by flying geologist Louis Maher and photographer Charles Mansfield has dozens of pictures taken from a Cessna mostly during the late 1950's and early 1960's. Doc Searl's blog post (below) is about this wonderful collection.

Blog posts

Publications

A is for amplitude

A seismic trace is a graph of amplitude versus time (Robinson & Treitel, 2008, Geophysical Reference 15)

Strictly speaking, amplitude is the measure of the displacement of a point along a seismic wave from the middle (zero crossing). Amplitudes can be positively valued (peaks) and negatively valued (troughs).

The amplitudes of seismic traces are often used to make a variety of geologic interpretations, either in 1D, 2D, or 3D and are often used in combination. Seismology is the imaging of the earth using seismic amplitudes (wave trains as a function of arrival time). Even though seismic amplitudes are not directly proportional to geological constrasts (expressed as reflection coefficients), there obviously is some connection. Big contrast = big amplitude, small contrast = small amplitude. Steve Henry has created a nice page that describes and summarizes many of the factors controlling seismic amplitudes.

Seismic traces are created by merging wave records from a range of angles, ray paths, and source and receiver positions. There is a large number of factors that affect seismic amplitude that have little to do with contrasts or geological interfaces. Here is a non-exhaustive list of things that might affect the amplitude of a seismic trace:

  • Lithology
  • Porosity
  • Pore fluid
  • Fluid saturation
  • Effective pressure
  • Faults and fractures
  • Reflector geometry
  • Bed thickness
  • Random noise
  • Acquisition footprint 
  • Interference
  • Near-surface effects
  • Processing operations
  • Geometrical spreading
  • Attenuation (energy loss)
  • Multiple reflections
 

This display from the F3 Block seismic data set, offshore Netherlands, shows that the relationship between amplitude patterns and geology can be open to interpretation (lucky for us!). In this display, blue peaks represent a downwards increase in acoustic impedance. The data are available for free from the OpendTect Open Seismic Repository.

Traditionally, amplitudes are recorded in the field by converting mechanical wave motion into electrical energy (a voltage) using a geophone or a hydrophone. But typically seismic amplitude after processing is unitless and the magnitude is arbitrary. The precision, however, is important so next week we will look at what the interpreter needs to know about bit depth

Great geophysicists #1: Ibn Sahl

Abu Sa’d al-’Ala’ ibn Sahl was a mathematician in late 10th Century Persia, working for the hugely powerful Abbasid caliphate and probably based in Baghdad. He understood the mathematics of refraction, at least six hundred years before Dutchman Willebrord Snellius wrote it all down and eventually gave the sine law of refraction his name. Snellius’ ancestors in Europe, in Ibn Sahl’s time, were in the middle of the Dark Ages, waiting patiently for the Renaissance just three or four hundred years away. I'll tell more about Snellius in a future post.

Refraction—the bending of a wave's ray-path due to a change in velocity—had been studied by the Egyptian astronomer Ptolemy in the second century, but he was unable to figure out the mathematics fully. It’s not known whether Ibn Sahl knew of this work, but Ptolemy’s Optics was certainly translated into Arabic, so it seems likely that he did. There wasn’t, after all, that much to read in those days.

The key figure from his work On Burning Mirrors and Lenses is shown here. I have cropped out part of the figure; see the whole thing on Wikipedia. I redrew the diagram, and added some annotation to show how it relates to the usual formulation of Snell's Law. The ratio of the lengths of the hypotenuses AB to DB is equal to the reciprocal of the ratio of the refractive indices of the materials on either side of the vertical line. Phew!

Ibn Sahl’s work was brought much further along by one of his successors, Ibn Haitham, widely considered to be the founding father of optics. He was the first person to make a pinhole camera, and thereby prove that light travelled in straight lines.

The dangers of default disdain

Those who create do so with an unspoken bias and for good reason. A right-handed can opener, the placement of letters on a QWERTY keyboard. Anything manufactured starts out as a guess about its end user and their motivations, and these motivations are carved into the design. Those who create technology have the awesome power of establishing standards—setting the presets—to steer their systems. The larger the scale of the system, the more assumptions the designer has to make. And, unless these presets can be modified, the system is limited.

If you think about it, defaults are an incredibly necessary invention, because they go to work when we do nothing.

Read More

The unlikelihood of improbable events

I picked a couple of old books off my shelf last night, to sit by the fire and read something on paper for a change. I chose two classics by Darrell Huff: How To Lie With Statistics (1975 edition), and How To Take A Chance (1965 edition). They are both excellent, and the former is even still in print. The amusing story shown here (right) faces the first page.

I was a bit surprised this morning when the first thing I see, via Twitter, is this story from Reuters: wounded fox shoots its would-be (and unnamed) killer in Belarus (of all places). I thought this was quite a coincidence.

What are the chances of this being a true story, and not some sort of mistake, or hoax, or piece of folklore? At first, I thought of Bayes' theorem:

P(A|B) = \frac{P(B | A)\, P(A)}{P(B)}.

With this equation, we can calculate the probability of the story being true, given the chances of such a thing happening in the first place (slim), and the reliability of the media (pretty high). If you think the chances of a man being shot by a fox are 1 in 1000, say, and the reliability of the media is 99%, then Bayes' theroem suggests that the probability of this story being true is just 9%.

Nine percent seemed pretty low to me. Maybe I was being too hard on the media, I thought.

But then another thing I just saw yesterday was that Google News now searches archives going back over 100 years. Amazing. So I searched for fox shoots hunter, and hit Archive. And sure enough, it turns out this sort of thing happens all the time.

Shown here (left), the Wilmington Morning Star, 21 January 1981: A fox shot and killed (!) an unnamed hunter in central Yugoslavia after hitting the animal with his rifle butt. 

Another story, from the Modesto Bee of 16 November 1948, details another nasty fox-shoots-man-after-man-tries-to-wallop-injured-fox-with-rifle incident.

So, I don't know if this story is true or not, but personally I doubt it. Looking at how it has spread like rabies through the media though, I think it's fascinating how these tales become part of our experience. No-one knows where it started, and a bit of digging suggests it may even be doubtful.

How many stories like that are there in the organization where you work? And how will you question the next one you hear?