Closing the gap: what next?

I wrote recently about closing the gap between data science and the subsurface domain, naming some strategies that I think will speed up this process of digitalization.

But even after the gap has closed in your organization, you’re really just getting started. It’s not enough to have contact between the two worlds, you need most of your actvity to be there. This means moving it from wherever it is now. This means time, and effort, and mistakes.

Strategies for 2020+

Hardly any organizations have got to this point yet. And I certainly don’t know what it looks like when we get there as a discipline. But nonetheless I think I’m starting to see what’s going to be required to continue to build into the gap. Soon, we’re going to need to think about these things.

  • We’re bad at hiring; we need to be awesome at it*. We need to stop listening to the pop psychology peddled by HR departments (Myers-Briggs, lol) and get serious about hiring brilliant scientific and technical talent. It’s going to take some work because a lot of brilliant scientists and technical talent aren’t that interested in subsurface.

  • You need to get used to the idea that digital scientists can do amazing things quickly. These are not your corporate timelines. There are no weekly meetings. Protoyping a digital technology, or proving a concept, takes days. Give me a team of 3 people and I can give you a prototype this time next week.

  • You don’t have to do everything yourself. In fact, you don’t want to, because that would be horribly slow. For example, if you have a hard problem at hand, Kaggle can get 3000 teams of fantastically bright people to look at it for you. Next week.

  • We need benchmark datasets. If anyone is going to be able to test anything, or believe any claims about machine learning results, then we need benchmark data. Otherwise, what are we to make of claims like “98% accuracy”? (Nothing, it’s nonsense.)

  • We need faster research. We need to stop asking people for static, finished work — that they can only present with PowerPoint — months ahead of a conference… then present it as if it’s bleeding edge. And do you know how long it takes to get a paper into GEOPHYSICS?

  • You need Slack and Stack Overflow in your business. These two tools have revolutionized how technical people communicate and help each other. If you have a large organization, then your digital scientists need to talk to each other. A lot. Skype and Yammer won’t do. Check out the Software Underground if you want to see how great Slack is.

Even if your organization is not quite ready for these ideas yet, you can start laying the groundwork. Maybe your team is ready. You only need a couple of allies to get started; there’s always something you can do right now to bring change a little sooner. For example, I bet you can:

  • List 3 new places you could look for amazing, hireable scientists to start conversations with.

  • Find out who’s responsible for technical communities of practice and ask them about Slack and SO.

  • Find 3 people who’d like to help organize a hackathon for your department before the summer holidays.

  • Do some research about what it takes to organize a Kaggle-style contest.

  • Get with a colleague and list 3 datasets you could potentially de-locate and release publically.

  • Challenge the committe to let you present in a new way at your next technical conference.

I guarantee that if you pick up one of these ideas and run with it for a bit, it’ll lead somewhere fun and interesting. And if you need help at some point, or just want to talk about it, you know where to find us!


* I’m not being flippant here. Next time you’re at a conference, go and talk to the grad students, all sweaty in their suits, getting fake interviews from recruiters. Look at their CVs and resumes. Visit the recruitment room. Go and look at LinkedIn. The whole thing is totally depressing. We’ve trained them to present the wrong versions of themselves.

x lines of Python: Ternary diagrams

Difficulty rating: beginner-friendly

(I just realized that calling the more approachable tutorials ‘easy’ is perhaps not the most sympathetic way to put it. But I think this one is fairly approachable.)

If you’re new to Python, plotting is a great way to get used to data structures, and even syntax, because you get immediate visual feedback. Plots are just fun.

Data loading

The first thing is to load the data, which is contained in a Google Sheets spreadsheet. If you make a sheet public, it’s easy to make a URL that provides a CSV. Happily, the Python data management library pandas can read URLs directly, so loading the data is quite easy — the only slightly ugly thing is the long URL:

    import pandas as pd
    uid = "1r7AYOFEw9RgU0QaagxkHuECvfoegQWp9spQtMV8XJGI"
    url = f"https://docs.google.com/spreadsheets/d/{uid}/export?format=csv"
    df = pd.read_csv(url) 

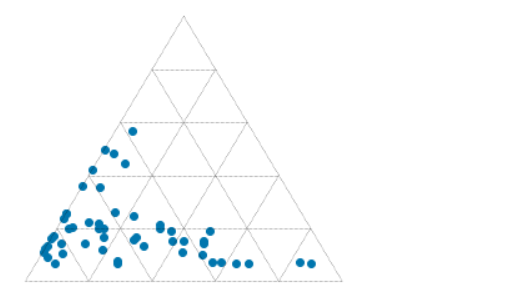
This dataset contains results from point-counting 51 shallow marine sandstones from the Eocene Sobrarbe Formation. We’re going to plot normalized volume percentages of quartz grains, detrital carbonate grains, and undifferentiated matrix. Three parameters? Two degrees of freedom? Let’s make a ternary plot!

Data exploration

Once you have the data in pandas, and before getting to the triangular stuff, we should have a look at it. Seaborn, a popular statistical plotting library, has a nifty ‘pairplot’ which plots the numerical parameters against each other to help reveal patterns in the data. On the diagonal, it shows kernel density estimations to reveal the distribution of each property:

    import seaborn as sns
    vars = ['Matrix', 'Quartz', 'Carbonate', 'Bioclasts', 'Authigenic']
    sns.pairplot(df, vars=vars, hue='Facies Association')
ternary_data_pairplot.png

Normalization is fairly straightforward. For each column, e.g. df['Carbonate'], we make a new column, e.g. df['C'], which is normalized to the sum of the three components, given by df[cols].sum(axis=1):

cols = ['Carbonate', 'Quartz', 'Matrix']
for col in cols:
    df[col[0]] = df[col] * 100 / df[cols].sum(axis=1)

The ternary plot

For the ternary plot itself I’m using the python-ternary library, which is pretty hands-on in that most plots take quite a bit of code. But the upside of this is that you can do almost anything you want. (Theres one other option for Python, the ever-reliable plotly, and there’s a solid-looking package for R too in ggtern.)

We just need a few lines of plotting code (left) to pull a ternary diagram (right) together.

    fig, tax = ternary.figure(scale=100)
    fig.set_size_inches(5, 4.5)

    tax.scatter(df[['M', 'Q', 'C']].values)
    tax.gridlines(multiple=20)
    tax.get_axes().axis('off')
ternary_tiny.png

But here you see what I mean about this being quite a low-level library: each element of the plot has to be added explicitly. So if we want axis labels, titles, and other annotations, we need more code… all of which is laid out in the accompanying notebook. You can download this from GitHub, or run it right now, right in your browser, with these links:

Binder   Run the accompanying notebook in MyBinder

Open In Colab   Run the notebook in Google Colaboratory (note you need to install python-ternary)

Give it a go, and have fun making your own ternary plots in Python! Share them on LinkedIn or Twitter.

Quartz, carbonate and matrix quantities (normalized to 100%) for 51 calcareous sandstones from the Eocene Sobrarbe Formation. The ternary plot was made with python-ternary library for Python and matplotlib.

Quartz, carbonate and matrix quantities (normalized to 100%) for 51 calcareous sandstones from the Eocene Sobrarbe Formation. The ternary plot was made with python-ternary library for Python and matplotlib.

Closing the analytics–domain gap

I recently figured out where Agile lives. Or at least where we strive to live. We live on the isthmus — the thin sliver of land — between the world of data science and the domain of the subsurface.

We’re not alone. A growing number of others live there with us. There’s an encampment; I wrote about it earlier this week.

Backman’s Island, one of my favourite kayaking destinations, is a passable metaphor for the relationship between machine learning and our scientific domain.

Backman’s Island, one of my favourite kayaking destinations, is a passable metaphor for the relationship between machine learning and our scientific domain.

Closing the gap in your organization

In some organizations, there is barely a connection. Maybe a few rocks at low tide, so you can hop from one to the other. But when we look more closely we find that the mysterious and/or glamorous data science team, and the stories that come out of it, seem distinctly at odds with the daily reality of the subsurface professionals. The VP talks about a data-driven business, deep learning, and 98% accuracy (whatever that means), while the geoscientists and engineers battle with raster logs, giant spreadsheets, and trying to get their data from Petrel into ArcGIS (or, help us all, PowerPoint) so they can just get on with their day.

We’re not going to learn anything from those organizations, except maybe marketing skills.

We can learn, however, from the handful of organizations, or parts of them, that are serious about not only closing the gap, but building new paths, and infrastructure, and new communities out there in the middle. If you’re in a big company, they almost certainly exist somewhere in the building — probably keeping their heads down because they are so productive and don’t want anyone messing with what they’ve achieved.

Here are some of the things they are doing:

  • Blending data science teams into asset teams, sitting machine learning specialists with subsurface scientists and engineers. Don’t make the same mistake with machine learning that our industry made with innovation — giving it to a VP and trying to bottle it. Instead, treat it like Marmite: spread it very thinly on everything.*

  • Treating software like knowledge sharing. Code is, hands down, the best way to share knowledge: it’s unambiguous, tested (we hope anyway), and — above all — you can actually use it. Best practice documents are I’m afraid, not worth the paper they would be printed on if anyone even knew how to find them.

  • Learning to code. OK, I’m biased because we train people… but it seriously works. When you have 300 geoscientists in your organization that embrace computational thinking, that can write a function in Python, that know what a support vector machine is for — that changes things. It changes every conversation.

  • Providing infrastructure for digital science. Once you have people with skills, you need people with powers. The power to install software, instantiate a virtual machine, or recruit a coder. You need people with tools, like version control, continuous integration, and communities of practice.

  • Realizing that they need to look in new places. Those much-hyped conversations everyone is having with Google or Amazon are, admittedly, pretty cool to see in the extractive industries (though if you really want to live on the cutting edge of geospatial analytics, you should probably be talking to Uber). You will find more hope and joy in Kaggle, Stack Overflow, and any given hackathon than you will in any of the places you’ve been looking for ‘innovation’ for the last 20 years.

This machine learning bandwagon we’re on is not about being cool, or giving keynotes, or saying ‘deep learning’ and ‘we’re working with Google’ all the time. It’s about equipping subsurface professionals to make better and safer scientific, industrial, and business decisions with more evidence and more certainty.

And that means getting serious about closing that gap.


I thought about this gap, and Agile’s place in it — along with the several hundred other digital subsurface scientists in the world — after drawing an attempt at drawing the ‘big picture’ of data science on one of our courses recently. Here’s a rendering of that drawing, without further comment. It didn’t quite fit with my ‘sliver of land’ analogy somehow…

On the left, the world of ‘advanced analytics’, on the right, how the disciplines of data science and earth science overlap on and intersect the computational world. We live in the green belt. (yes, we could argue for hours about these terms, but le…

On the left, the world of ‘advanced analytics’, on the right, how the disciplines of data science and earth science overlap on and intersect the computational world. We live in the green belt. (yes, we could argue for hours about these terms, but let’s not.)


* If you don’t know what Marmite is, it’s not too late to catch up.

The digital subsurface water-cooler

swung_round_orange.png

Back in August 2016 I told you about the Software Underground, an informal, grass-roots community of people who are into rocks and computers. At its heart is a public Slack group (Slack is a bit like Yammer or Skype but much more awesome). At the time, the Underground had 130 members. This morning, we hit ten times that number: there are now 1300 enthusiasts in the Underground!

If you’re one of them, you already know that it’s easily the best place there is to find and chat to people who are involved in researching and applying machine learning in the subsurface — in geoscience, reservoir engineering, and enything else to do with the hard parts of the earth. And it’s not just about AI… it’s about data management, visualization, Python, and web applications. Here are some things that have been shared in the last 7 days:

  • News about the upcoming Software Underground hackathon in London.

  • A new Udacity course on TensorFlow.

  • Questions to ask when reviewing machine learning projects.

  • A Dockerfile to make installing Seismic Unix a snap.

  • Mark Zoback’s new geomechanics course.

It gets better. One of the most interesting conversations recently has been about starting a new online-only, open-access journal for the geeky side of geo. Look for the #journal channel.

Another emerging feature is the ‘real life’ meetup. Several social+science gatherings have happened recently in Aberdeen, Houston, and Calgary… and more are planned, check #meetups for details. If you’d like to organize a meetup where you live, Software Underground will support it financially.

softwareunderground_merch.png

We’ve also gained a website, softwareunderground.org, where you’ll find a link to sign-up in the Slack group, some recommended reading, and fantastic Software Underground T-shirts and mugs! There are also other ways to support the community with a subscription or sponsorship.

If you’ve been looking for the geeks, data-heads, coders and makers in geoscience and engineering, you’ve found them. It’s free to sign up — I hope we see you in there soon!


Slack has nice desktop, web and mobile clients. Check out all the channels — they are listed on the left:

swung_convo.png

x lines of Python: Gridding map data

Difficulty rating: moderate.

Welcome to the latest in the X lines of Python series. You probably thought it had died, gawn to ‘eaven, was an x-series. Well, it’s back!

Today we’re going to fit a regularly sampled surface — a grid — to an irregular set of points in (x, y) space. The points represent porosity, measured in volume percent.

Here’s what we’re going to do; it all comes to only 9 lines of code!

  1. Load the data from a text file (needs 1 line of code).

  2. Compute the extents and then the coordinates of the new grid (2 lines).

  3. Make a radial basis function interpolator using SciPy (1 line).

  4. Perform the interpolation (1 line).

  5. Make a plot (4 lines).

As usual, there’s a Jupyter Notebook accompanying this blog post, and you can run it right now without installing anything.


Binder Run the accompanying notebook in MyBinder

Open In Colab Run the notebook in Google Colaboratory

Just the juicy bits

The notebook goes over the workflow in a bit more detail — with more plots and a few different ways of doing the interpolation. For example, we try out triangulation and demonstrate using scikit-learn’s Gaussian process model to show how we might use kriging (turns out kriging was machine learning all along!).

If you don’t have time for all that, and just want the meat of the notebook, here it is:

 
import numpy as np
import pandas as pd
import matplotlib.pyplot as plt
from scipy.interpolate import Rbf

# Load the data.
df = pd.read_csv('../data/ZoneA.dat',
                 sep=' ',
                 header=9,
                 usecols=[0, 1, 2, 3],
                 names=['x', 'y', 'thick', 'por']
                )

# Build a regular grid with 500-metre cells.
extent = x_min, x_max, y_min, y_max = [df.x.min()-1000, df.x.max()+1000,
                                       df.y.min()-1000, df.y.max()+1000]
grid_x, grid_y = np.mgrid[x_min:x_max:500, y_min:y_max:500]

# Make the interpolator and do the interpolation.
rbfi = Rbf(df.x, df.y, df.por)
di = rbfi(grid_x, grid_y)

# Make the plot.
plt.figure(figsize=(15, 15))
plt.imshow(di.T, origin="lower", extent=extent)
cb = plt.scatter(df.x, df.y, s=60, c=df.por, edgecolor='#ffffff66')
plt.colorbar(cb, shrink=0.67)
plt.show()

This results in the following plot, in which the points are the original data, plotted with the same colourmap as the surface itself (so they should be the same colour, more or less, as their background).

rbf_interpolation.png