x lines of Python: Stereonets

Difficulty rating: Intermediate

A few years back I needed to plot some fracture data without specialist software, so I created an Excel spreadsheet with a polar plot and interactive widgets. But thanks to Joe Kington and his awesome mplstereonet library those days are over. Today I want to share with you how to plot two fracture sets on an equal area Schmidt plot with mplstereonet.

Here's what we're going to do — and in only 10 lines of Python:

  1. Load the data from a CSV file.
  2. Create a stereonet with grid lines.
  3. Loop over fracture sets and plot each in a different colour.
  4. Add some statistics for each set.

For data we'll use Irene Wallis's fantastic open-source project fractoolbox repo, which includes some data — as well as some notebooks that go beyond what we will do here.

This results in the plot shown here, where each fracture is plotted as a point representing the pole of the fracture plane.

We see that not counting the imports, we can make this simple plot with as a few as 10 lines of code while still retaining some flexibility to refactor this code. The accompanying notebook also shows how to use ipywidgets to make the plot interactive.

stereonet_example.jpg

That’s it! There’s more in the Notebook — check out the links below. If you get some beautiful plots out of your data, share them in the Software Underground or on Twitter. Have fun!

GitHub    See the Notebook on GitHub

Binder    Run the Notebook in MyBinder

x lines of Python: Ternary diagrams

Difficulty rating: beginner-friendly

(I just realized that calling the more approachable tutorials ‘easy’ is perhaps not the most sympathetic way to put it. But I think this one is fairly approachable.)

If you’re new to Python, plotting is a great way to get used to data structures, and even syntax, because you get immediate visual feedback. Plots are just fun.

Data loading

The first thing is to load the data, which is contained in a Google Sheets spreadsheet. If you make a sheet public, it’s easy to make a URL that provides a CSV. Happily, the Python data management library pandas can read URLs directly, so loading the data is quite easy — the only slightly ugly thing is the long URL:

    import pandas as pd
    uid = "1r7AYOFEw9RgU0QaagxkHuECvfoegQWp9spQtMV8XJGI"
    url = f"https://docs.google.com/spreadsheets/d/{uid}/export?format=csv"
    df = pd.read_csv(url) 

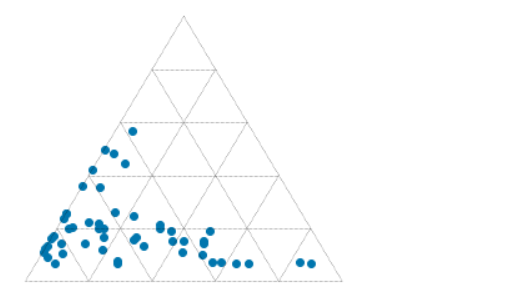
This dataset contains results from point-counting 51 shallow marine sandstones from the Eocene Sobrarbe Formation. We’re going to plot normalized volume percentages of quartz grains, detrital carbonate grains, and undifferentiated matrix. Three parameters? Two degrees of freedom? Let’s make a ternary plot!

Data exploration

Once you have the data in pandas, and before getting to the triangular stuff, we should have a look at it. Seaborn, a popular statistical plotting library, has a nifty ‘pairplot’ which plots the numerical parameters against each other to help reveal patterns in the data. On the diagonal, it shows kernel density estimations to reveal the distribution of each property:

    import seaborn as sns
    vars = ['Matrix', 'Quartz', 'Carbonate', 'Bioclasts', 'Authigenic']
    sns.pairplot(df, vars=vars, hue='Facies Association')
ternary_data_pairplot.png

Normalization is fairly straightforward. For each column, e.g. df['Carbonate'], we make a new column, e.g. df['C'], which is normalized to the sum of the three components, given by df[cols].sum(axis=1):

cols = ['Carbonate', 'Quartz', 'Matrix']
for col in cols:
    df[col[0]] = df[col] * 100 / df[cols].sum(axis=1)

The ternary plot

For the ternary plot itself I’m using the python-ternary library, which is pretty hands-on in that most plots take quite a bit of code. But the upside of this is that you can do almost anything you want. (Theres one other option for Python, the ever-reliable plotly, and there’s a solid-looking package for R too in ggtern.)

We just need a few lines of plotting code (left) to pull a ternary diagram (right) together.

    fig, tax = ternary.figure(scale=100)
    fig.set_size_inches(5, 4.5)

    tax.scatter(df[['M', 'Q', 'C']].values)
    tax.gridlines(multiple=20)
    tax.get_axes().axis('off')
ternary_tiny.png

But here you see what I mean about this being quite a low-level library: each element of the plot has to be added explicitly. So if we want axis labels, titles, and other annotations, we need more code… all of which is laid out in the accompanying notebook. You can download this from GitHub, or run it right now, right in your browser, with these links:

Binder   Run the accompanying notebook in MyBinder

Open In Colab   Run the notebook in Google Colaboratory (note you need to install python-ternary)

Give it a go, and have fun making your own ternary plots in Python! Share them on LinkedIn or Twitter.

Quartz, carbonate and matrix quantities (normalized to 100%) for 51 calcareous sandstones from the Eocene Sobrarbe Formation. The ternary plot was made with python-ternary library for Python and matplotlib.

Quartz, carbonate and matrix quantities (normalized to 100%) for 51 calcareous sandstones from the Eocene Sobrarbe Formation. The ternary plot was made with python-ternary library for Python and matplotlib.

No more rainbows!

"the rainbow color map can significantly reduce a person’s accuracy and efficiency"
Borkin et al. (2011)

File under "Aaarrrrrrgghhhhhhh"

File under "Aaarrrrrrgghhhhhhh"

The world has known for at least 20 years that the rainbow colourmap is A Bad Thing, perhaps even A Very Bad Thing. IBM researchers Bernice Rogowitz and Lloyd Treinish — whose research on the subject goes back to the early 90s — wrote their famous article Why should engineers and scientists be worried about color? in 1996. Visualization guru Edward Tufte highlighted the problems with it in his 1997 book Visual Explanations (if you haven't read this book, you must buy it immediately). 

This isn't a matter of taste, or opinion. We know — for sure, with science! — that the rainbow is a bad choice for the visualization of data. And yet people use it every day, even in peer-reviewed literature. And — purely anecdotally — it seems to be especially rife in geoscience <citation needed>.

Why are we talking about this? 

The rainbow colourmap suffers from a number of severe problems:

  • It's been linked to inferior image interpretation by professionals (Borkin et al 2011).

  • It introduces ambiguity into the display: are we looking at the data's distribution, or the colourmap's?

  • It introduces non-existent structure into the display — notice the yellow and cyan stripes, which manifest as contours:

rainbow.png
  • Colourblind people cannot read the colours properly — I made this protanopic simulation with Coblis

rainbow_protanope.png
  • It does not have monotonically increasing lightness, so you can't reproduce it in greyscale.

rainbow_grey.png
  • There's no implicit order to hues, so it's hard to interpret meaning intuitively.

  • On a practical note, it uses every available colour, leaving you none for annotation.

For all of these reasons, MATLAB and Matplotlib no longer use rainbow-like colourmaps by default. And neither should you.

But I like rainbows!

People tend like things that are bad for them. Chris Jackson (Imperial, see here and here) and Bert Bril (dGB, in Slack) have both expressed an appreciation for rainbow-like colourmaps, or at least an indifference. Bert went so far as to say he doesn't like 'perceptual' colourmaps — those that monotonically and linearly increase in brightness. 

I don't think indifference is allowed. Research with professional image interpreters has shown us that rainbow colourmaps impair the quality of their work. We know that these colours are hard for colourblind people to use. The practical issues of not being readable in greyscale and leaving no colours for annotation are always present. There's just no way we can ask, "Does it matter?" — at least not without offering some evidence that goes beyond mere anecdote.

I think what people like is the colour variance — it acts like contours, highlighting subtle features in the surface. Some of this extra detail is probably noise, but some is certainly signal, maybe even opportunity. 

See what you think of these renderings of the seafloor pick on the Penobscot dataset, offshore Nova Scotia (licensed CC-BY-SA by dGB Earth Sciences and The Government of Nova Scotia). The top row are some rainbow-like colourmaps, all bad. The others are a selection of (more-or-less) perceptually awesome colourmaps. The names under each map are the names of the colourmaps in Python's matplotlib package.

The solution

We know what kind of colourmaps are good for interpretation: those that increase linearly and monotonically in brightness, with no jumps or stripes of luminance. I've linked to lots of places where you can read about these — see the end of the post. You already know one perceptual colourmap: the humble Greyscale. But there are lots of others, so let's start with one of them.

Next, instead of using something that acts like contours, let's try using contours!

I think that's a big improvement already. Some tips for contouring:

  1. Make them thin and black, with opacity at about 0.2 to 0.5. Transparency is essential. 

  2. Choose a fairly small interval; use index contours if there are more than about 10.

  3. Label the contours directly on a large map. State the contour interval in the caption.

Let's try hillshading instead:

Also really nice.

Given that this is a water-bottom horizon, I like the YlGnBu colourmap, which resembles the thing it is modeling. (I think this is also a good basis for selecting a colourmap, by the way, all else being equal.)

I must admit I do find a lot of these perceptual colormaps get too dark at the 'low' end, which can make annotation (or seeing contours) hard. So we will fix that with a function (see the notebook) that generates perceptually linear colourmaps.

Now tell me the spectrum beats a perceptual colourmap...

Horizons_faceoff.png

Let's check that it is indeed colourblind-safe and grey-safe:

Horizons_faceoff_protanope.png
Horizons_faceoff_grey.png

There you have it. If you care about your data and your readers, avoid rainbow-like colourmaps in the lab and in publications. Go perceptual!

The Python code and data to generate these images is available on GitHub.

Binder     Better yet, click here to play with the data right in your browser!

What do you think? Are rainbow colourmaps here to stay? 

References and bibliography

Still not convinced?

For goodness sake, just listen to Kristin Thyng for 20 minutes: