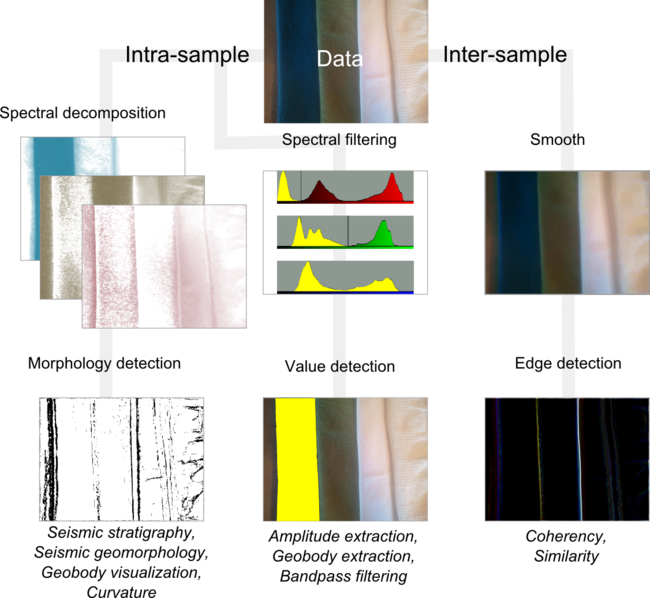
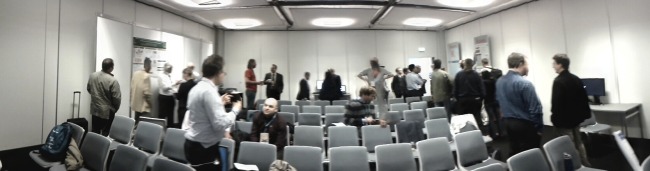
Fabric textures

Beyond the traditional, well-studied attributes that I referred to last time, are a large family of metrics from image processing and robot vision. The idea is to imitate the simple pattern recognition rules our brains intuitively and continuously apply when we look at seismic data: how do the data look? How smooth or irregular are the reflections? If you thought the adjectives I used for my tea towels were ambiguous, I assure you seismic will be much more cryptic.

In three-dimensional data, texture is harder to see, difficult to draw, and impossible to put on a map. So when language fails us, discard words altogether and use numbers instead. While some attributes describe the data at a particular place (as we might describe a photographic pixel as 'red', 'bright', 'saturated'), other attributes describe the character of the data in a small region or kernel ('speckled', 'stripy', 'blurry').

Texture by numbers

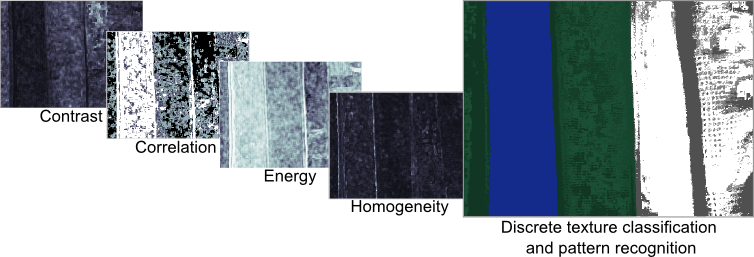
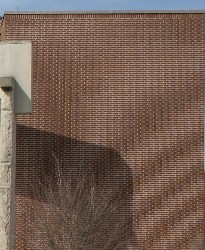
I converted the colour image from the previous post to a greyscale image with 256 levels (a bit-depth of 8) to match this notion of scalar seismic data samples in space. The geek speak is that I am computing local grey-level co-occurence matrices (or GLCMs) in a moving window around the image, and then evaluating some statistics of the local GLCM for each point in the image. These statistics are commonly called Haralick textures. Choosing the best kernel size will depend on the scale of the patterns. The Haralick textures are not particularly illustrative when viewed on their own but they can be used for data clustering and classification, which will be the topic of my next post.

  • Step 1: Reduce the image to 256 grey-levels
  • Step 2: For every pixel, compute a co-occurrence matrix from a p by q kernel (p, q = 15 for my tea towel photo)
  • Step 3: For every pixel, compute the Haralick textures (Contrast, Correlation, Energy, Homogeneity) from the GLCM

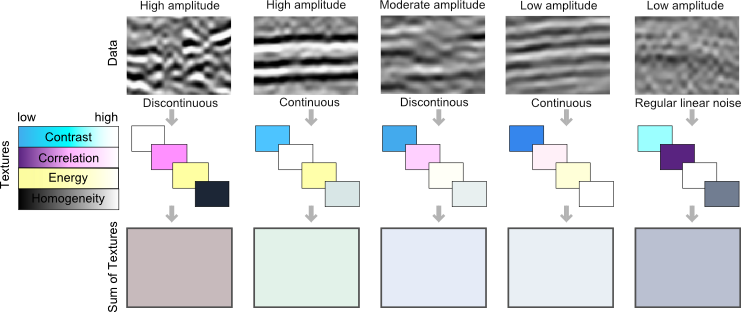
Textures in seismic data

Here are a few tiles of seismic textures that I have loosely labeled as "high-amplitude continous", "high-amplitude discontinuous", "low-amplitude continuous", etc. You certainly might choose different words to describe them, but each has a unique and objective set of Haralick textures. I have explicitly represented the value of each's texture as a color; using cyan for contrast, magenta for correlation, yellow for energy, and black for homogeneity. Thus, the four Haralick textures span the CMYK color space. Merging these components back together into a single color gives you a sense of the degree of difference across the tiles. For instance, the high-amplitude continuous tile, is characterized by high contrast and high energy, but low correlation, relative to the low-amplitude continuous tile. Their textures are similar, so obviously, they map to similar color values in CMYK color space. Whether or not they are truly discernable is the challenge we offer to data clustering; be it employed by visual inspection or computational force.

Further reading:
Gao, D., 2003, Volume texture extraction for 3D seismic visualization and interpretation, Geophysics, 64, No. 4, 1294-1302
Haralick, R., Shanmugam, K., and Dinstein, I., 1973, Textural features for image classification: IEEE Tran. Systems, Man, and Cybernetics, SMC-3, 610-621.
Mryka Hall-Beyer has a great tutorial at http://www.fp.ucalgary.ca/mhallbey/tutorial.htm for learning more about GLCMs.
Images in this post were made using MATLAB, FIJI and Inkscape.

Fabric attributes

The catch-all term seismic interpretation, often used to refer to the labour of digitizing horizons and faults, is almost always spatially constrained. Picking seismic line-by-line means collapsing complex 3D patterns and volumes onto 2D maps and surfaces. It hurts me to think about what we are discarding. Take a second and imagine looking at a photograph one row of pixels at a time. So much is lost in the simplification.

Attributes, on the other hand, can either quantify the nature of a horizon, probe between horizons, or characterize an entire 3D space. Single-trace attributes can tell us about waveform shape and magnitude which allegedly responds to true physical impedance contrasts. Multi-trace attributes (coherency, curvature, etc.) pull information from neighbouring traces.

The fabric test model

In a spirited act of geeky indulgence, I went to my linen closest, grabbed some tea towels, pulled out my phone (obviously), and captured this scene. A set of four folded tea towels overlapping and spread across my counter top—reverse engineering what I thought to be a suitable analogy for training my seismic inutition. The left (blue) tea towel is a honeycomb texture, the second (green) is speckled like a wash cloth, the third is a high thread-count linen, and the fourth has a grid of alternating cross-hatches and plain print. Don't laugh! It turns out to be quite difficult to verbally describe the patterns in these fabrics. Certainly, you will describe them differently to me, and that is the problem. 

Perhaps image processing can transcend our linguistic limitations. In seismic, as in image processing in general, there are attributes that work on each sample (or trace) independently, and there are attributes that use an ensemble of neighbouring samples in their computation. See if you can think a seismic analogy in the for each of these image attributes.

  • Spectral decomposition shows the component of the RGB color spectrum at each sample location. I subsequently clipped and enhanced the red panel to show curves, wrinkles and boundaries caused by the interplay of light, shadows, and morphology.
  • Spectral filtering extracts or removes hues. In this instance, I have selected all the color triplets that make up the blue tea towel. You could also select a range to say, show where the shadows are.
  • Edge detection, after smoothing, shows sharp edges in white and yellow, soft edges in purple and blue. The wrinkles and subtle folds on the right most fabric have also been detected. 

My question: can you manually draw the morphology, or the blues, or the edges and discontinuities? Manual interpretation is time consuming, prone to error, seldom reproducible, and that makes it flawed. Furthermore, none of these attributes actually tell us about the nature of the textures in the fabric. Indeed, we don't know if any of them are relevant at all. Colour happens to be one proxy for texture in this case, but it fails in delineating the two whitish fabrics.

Artistically and computationally speaking, I submit to you that seismic data are nothing but images. In the next post I will extend this fabric-photograph model to explore the utility of textural attributes. 

Theses images were made using the open source FIJI and the illustrations were done in Inkscape. The attributes were computed in MATLAB and FIJI.

News of the month

A quick round-up of recent news. If you think we missed something, drop us a line!

EAGE gets more global

The annual EAGE conference and buzzword-fest in Copenhagen was the largest ever, with over 6200 delegates. The organization is getting ever more global, having just signed memorandums of understanding with both AAPG and SEG — getting this done was a big cap-feather for John Underhill, who stepped down as president at the end of the week.

The most popular session of the conference was Creativity & Boldness in Exploration, organized by Jean-Jacques Jarrige of Total. At least 800 people crammed into the auditorium, causing exhibition-floor vendors to complain that 'everything has gone quiet'.

Microsoft gets more social... maybe

Most of our knowledge sharing clients have dabbled with social media. Chat is more or less ubiquitous, wikis are extremely popular, and microblogging is taking off. Yammer is one of the disrupters here, and it seemed almost inevitable that they would be acquired. How dull to hear that Microsoft seems to be the main suitor. They need something to work in this space, but have struggled so far. 

Find your digital objects!

Science is benefitting every day from social media, as conversations happen on Twitter and elsewhere. Sharing data, methods, photos, and figures is fun and helps grow stronger communities. Figshare is a still-new place to share graphics and data, and its acquisition by Macmillan's Digital Science business gave it more clout earlier this year. It now offers a Digital Object Identifier, also known as a DOI, for every item you upload. This is as close to a guarantee of persistence as you can get on the web, and it's a step closer to making everything citable in tomorrow's scientific literature.

Forecast is for cloud

One of the buzzwords at EAGE was 'the cloud' as companies fall over each other trying to get in on the action. Halliburton has had a story for years, but we think the giants will struggle in this space—the ones to watch are the startups. FUSE are one of the more convincing outfits, dragging E&P data management into the 21st century.

In other news

Touch is coming to E&P. Those lovely interfaces on your phone and tablet are, slowly but surely, getting traction in subsurface geoscience as Schlumberger teams up with Perceptive Pixel to bring a 27" multi-touch interface to Petrel

Thank goodness you're a geoscientist! Geophysics is one of the most employable degrees, according to a report last year by Georgetown University that's been covered lots since. Our impression: the more quantitative you are, the more employable.

This regular news feature is for information only. We aren't connected with any of these organizations, and don't necessarily endorse their products or services. 

Two hundred posts

The petrophysics cheasheet was one of our most popular posts

My post on Tuesday was the two hundredth post on our blog, which we started 19 months ago in November 2010. Though we began with about 15 posts per month, we have settled down to a rate of 7 or 8 posts per month, which feels sustainable. At this rate, it will be at least a year before we hit 300.

We hit 100 posts on 21 June last year, after only 222 days. In the 358 days since then we've had about 41 700 visits from 24 500 people in 152 countries. The most popular content is a little hard to gauge because of the way we run every post over the home page for a couple of weeks, but from the most recent 100 posts, the favourites are (in descending pageview order):

Someone asked recently how long our posts take to write. It varies quite a bit, especially if there are drawings or other graphics, but I think the average is about 4 hours, perhaps a little more. Posts follow an idea–draft–hack–review–publish process, and this might be months long: we currently have 52 draft posts in the pipeline! Some may never make it out...

We'd love to have some other voices on the site, so if you feel strongly about something in this field, or would like the right to reply to one of our opinion pieces, please get in touch. Or start a blog!

Two decades of geophysics freedom

This year is the 20th anniversary of the release of Seismic Un*x as free software. It is six years since the first open software workshop at EAGE. And it is one year since the PTTC open source geoscience workshop in Houston, where I first met Karl Schleicher, Joe Dellinger, and a host of other open source advocates and developers. The EAGE workshop on Friday looked back on all of this, surveyed the current landscape, and looked forward to an ever-increasing rate of invention and implementation of free and open geophysics software.

Rather than attempting any deep commentary, here's a rundown of the entire day. Please read on...

Read More

The science of things we don't understand

I am at the EAGE Conference & Exhibition in Copenhagen. Yesterday I wrote up my highlights from Day 2. Today it's, yep, Day 3!

Amusingly, and depressingly, the highlight of the morning was the accidental five minute gap between talks in the land seismic acquisition session. Ralf Ferber and Felix Herrmann began spontaneously debating the sparsity of seismic data (Ferber doubting it, Herrmann convinced of it), and there was a palpable energy in the room. I know from experience that it is difficult to start conversations like this on purpose, but conferences need more of this.

There was some good stuff in Ralf's two talks as well. I am getting out of my depth when it comes to non-uniform sampling (and the related concept of compressive sensing), but I am a closet signal analyst and I get a kick out of trying to follow along. The main idea is that you want to break aliasing, a type of coherent noise and a harmful artifact, arising from regular sampling (right). The way to break it is to introduce randomness and irregularity—essentially to deliberately introduce errors in the data. Ralf's paper suggested randomly reversing the polarity of receivers, but there are other ways. The trick is that we know what errors we introduced.

Geothermal in Canada. Image: GSC. As Evan mentioned recently, we've been doing a lot of interpretation on geothermal projects recently. And we both worked in the past on oil sands projects. Today I saw a new world of possiblity open up as Simon Weides of GFZ Potsdam gave his paper, Geothermal exploration of Paleozoic formations in central Alberta, Canada. He has assessed two areas: the Edmonton Peace River regions, but only described the former today. While not hot enough for electricity generation, the temperature in the Cambrian (81°–89°C) is suitable for so-called district heating projects, though it's so tight it would need fraccing. The Devonian is cooler, at 36°–59°C, but still potentially useful for greenhouses and domestic heat. The industrial applications in Alberta, where drilling is easy and inexpensive, are manifold.

I wandered in at the end of what seemed to be the most popular geophysics talk of the conferece: Guus Berkhout's Full wavefield migration — utilization of multiples in seismic migration. While I missed the talk, I was in time to catch a remark of his that resonated with me:

Perhaps we don't need the science of signals, but the science of noise. The science of noise is the science of things we don't understand, and that is the best kind of science. 

Yes! We, as scientists in the service of man, must get better at thinking about, worrying about, and talking about the things we don't understand. If I was feeling provocative, I might even say this: the things we understand are boring.

The brick image shows spatial aliasing resulting from poor sampling. Source: Wikipedian cburnett, under GFDL.

Geophysics bliss

For the first time in over 20 years, the EAGE Conference and Exhibition is in Copenhagen, Denmark. Since it's one of my favourite cities, and since there is an open source software workshop on Friday, and since I was in Europe anyway, I decided to come along. It's my first EAGE since 2005 (Madrid).

Sunday and Monday saw ten workshops on a smörgåsbord of topics from broadband seismic to simulation and risk. The breadth of subject matter is a reminder that this is the largest integrated event in our business: geoscientists and engineers mingle in almost every session of the conference. I got here last night, having missed the first day of sessions. But I made up for it today, catching 14 out of the 208 talks on offer, and missing 100% of the posters. If I thought about it too long, this would make me a bit sad, but I saw some great presentations so I've no reason to be glum. Here are some highlights...

One talk this afternoon left an impression. Roberto Herrera of the BLind Identification of Seismic Signals (BLISS, what else?) project at the University of Alberta, provoked the audience with talk of Automated seismic-to-well ties. Skeptical glances were widely exchanged, but what followed was an elegant description of cross-correlation, and why it fails to correlate across changes in scale or varying time-shifts. The solution: Dynamic Time Warping, an innovation that computes the Euclidean distance between every possible pair of samples. This process results in a matrix of cross-correlations, the minimal cost path across this matrix is the optimal correlation. Because this path does not necessarily correlate time-equivalent samples, time is effectively warped. Brilliant. 

I always enjoy hearing about small, grass-roots efforts at the fringes. Johannes Amtmann of Joanneum Research Resources showed us the foundations of a new online resource for interpreters (Seismic attribute database for time-effective literature search). Though not yet online, seismic-attribute.info will soon allow anyone to search a hand-picked catalog of more than 750 papers on seismic attributes (29% of which are from The Leading Edge, 13% from Geophysics, 10% from First Break, and the rest from other journals and conferences). Tagged with 152 keywords, papers can be filtered for, say, papers on curvature attributes and channel interpretation. We love Mendeley for managing references, but this sounds like a terrific way to jump-start an interpretation project. If there's a way for the community at large to help curate the project, or even take it in new directions, it could be very exciting.

One of the most enticing titles was from Jan Bakke of Schlumberger: Seismic DNA — a novel seismic feature extraction method using non-local and multi-attribute sets. Jan explained that auto-tracking usually only uses data from the immediate vicinity of the current pick, but human interpreters look at the stacking pattern to decide where to pick. To try to emulate this, Jan's approach is to use the simple-but-effective approach of regular expression matching. This involves thresholding the data so that it can be represented by discrete classes (a, b, c, for example). The interpreter then builds regex rules, which Jan calls nucleotides, to determine what constitutes a good pick. The rules operate over a variable time window, thus the 'non-local' label. Many volumes can influence the outcome as concurrent expressions are combined with a logical AND. It would be interesting to compare the approach to ordinary trace correlation, which also accounts for wave shape in an interval.

SV reflectivity with offset. Notice the zero-crossing at about 24° and the multiple critical angles. The first talk of the day was a mind-bending (for me) exploration of the implications of Brewster's angle — a well-understood effect in optics — for seismic waves in elastic media. In Physical insight into the elastic Brewster's angleBob Tatham (University of Texas at Austin) had fun with shear wave ray paths for shear waves, applying some of Aki and Richards's equations to see what happens to reflectivity with offset. Just as light is polarized at Brewster's angle (hence Polaroid sunglasses, which exploit this effect), the reflectivity of SV waves drops to zero at relatively short offsets. Interestingly, the angle (the Tatham angle?) is relatively invariant with Vp/Vs ratio. Explore the effect yourself with the CREWES Zoeppritz Explorer.

That's it for highlights. I found most talks were relatively free from marketing. Most were on time, though sometimes left little time for questions. I'm looking forward to tomorrow.

If you were there today, I'd love to hear about talks you enjoyed. Use the comments to share.