Silos are a feature, not a bug

If you’ve had the same problem for a long time, maybe it’s not a problem. Maybe it’s a fact.
— Yitzhak Rabin

"Break down the silos" is such a hackneyed phrase that it's probably not even useful any more. But I still hear it all the time — especially in our work in governments and large enterprises. It's the wrong idea — silos are awesome.

The thing is: people like silos. That's why they are there. Whether they are project teams, organizational units, technical communities, or management layers, silos are comfortable. People can speak freely. Everyone shares the same values. There is trust. There is purpose.

The problem is that much of the time — maybe most of the time, for most people — you want silos not to matter. Don't confuse this with not wanting them to exist. They do exist: get used to it. So now make them not matter. Cope don't fix. 

Permeable seals

In the context of groups of humans who want to work together, what do permeable silos look like? I mean really leaky ones.

The answer is: it depends. Here are the features they will have:

  • They serve their organization. The silo must serve the organization or community it's part of. I think a service-oriented mindset gets the best out of people: get them asking "How can I help?". If it is not serving anyone, the silo needs to die.
  • They are internally effective. This is the whole point of the silo, so this had better be true. Make sure people can do a better job because of the efficiencies of the silo. Resources are provided. Responsibilities are understood. The shared purpose must result in great things... if not, the silo needs to die.
  • They are open. This is the leakiness criterion. If someone needs something from the silo, it must be obvious how to get it, and the cost of getting it must be very low. If someone wants to join the silo, it's obvious how to do this, and they are welcomed. If something about the silo needs to change, there is a clear path to making this known.
  • They are transparent. People need to know what the silo is for. If people look in, they can see how things work. Don't build secret clubs, black boxes, or other dark places. Conversely, if people in the silo want to look outside, they can. Importantly: if the silo's level of transparency doesn't make you uncomfortable, you're not doing enough of it.

The openness is key. Ideally, the mechanism for getting things from the silo is the same one that the silo's own inhabitants use. This is by far the simplest, cheapest way to nail it. Think of it as an interface; if you're a programmer, think of it as an API. Indeed, in many cases, it will involve an actual API. If this does not exist, other people will come up with their own solutions, and if this happens often enough, the silo will cease to be useful to the organization. Competition between silos is unhelpful.

Build more silos!

A government agency can be a silo, as long as it has a rich, free interface for other agencies and the general public to access its services. Geophysics can be a silo, as long as it's easy for a wave-curious engineer to join in, and the silo is promoting excellence and professional development amongst its members. An HR department can be a silo, as long as its practices and procedures are transparent and people can openly ask why the heck they still use Myers–Briggs tests.

Go and build a silo. Then make it not matter most of the time.


Image: Silos by Flickr user Guerretto, licensed CC-BY.

Helpful horizons

Ah, the smell of a new seismic interpretation project. All those traces, all that geology — perhaps unseen by humans or indeed any multicellular organism at all since the Triassic. The temptation is to Just Start Interpreting, why, you could have a map by lunchtime tomorrow! But wait. There are some things to do first.

Once I've made sure all is present and correct (see How to QC a seismic volume), I spend a bit of time making some helpful horizons... 

  • The surface. One of the fundamental horizons, the seafloor or ground surface is a must-have. You may have received it from the processor (did you ask for it?) or it may be hidden in the SEG-Y headers — ask whoever received or loaded the data. If not, ground elevation is usually easy enough to get from your friendly GIS guru. If you have to interpret the seafloor, at least it should autotrack quite well.
  • Seafloor multiple model. In marine data, I always make a seafloor multiple model — just multiply the seafloor pick by 2. This will help you make sense of any anomalous reflectors or amplitudes at that two-way time. Maybe make a 3× version too if things look really bad. Remember, the 2× multiple will be reverse polarity.
  • Other multiples. You can model the surface multiple of any strong reflectors with the same arithmetic — but the chances are that any residual multiple energy is quite subtle. You may want to seek help modeling them properly, once you have a 3D velocity model.

A 2D seismic dataset with some of the suggested helpful horizons. Please see the footnote about this dataset. Click the image to enlarge.

  • Water depth markers. I like to make flat horizons* at important water depths, eg shelf edge (usually about 100–200 m), plus 1000 m, 2000 m, etc. This mainly helps to keep track of where you are, and also to think about prospectivity, accessibility, well cost, etc. You only want these to exist in the water, so delete them anywhere they are deeper than the seafloor horizon. Your software should have an easy way to implement a simple model for time t in ms, given depth d in m and velocity** V in m/s, e.g.

$$ t = \frac{2000 d}{V} \approx \frac{2000 d}{1490} \qquad \qquad \mathrm{e.g.}\ \frac{2000 \times 1000}{1490} = 1342\ \mathrm{ms} $$

  • Hydrate stability zone. In marine data and in the Arctic you may want to model the bottom of the gas hydrate stability zone (GHSZ) to help interpret bottom-simulating reflectors, or BSRs. I usually do this by scanning the literature for reports of BSRs in the area, or data on hydrate encounters in wells. In the figure above, I just used the seafloor plus 400 ms. If you want to try for more precision, Bale et al. (2014) provided several models for computing the position of the GHSZ — thank you to Murray Hoggett at Birmingham for that tip.
  • Fold. It's very useful to be able to see seismic fold on a map along with your data, so I like to load fold maps at some strategic depths or, better yet, load the entire fold volume. That way you can check that anomalies (especially semblance) don't have a simple, non-geological explanation. 
  • Gravity and magnetics. These datasets are often readily available. You will have to shift and scale them to some sensible numbers, either at the top or the bottom of your sections. Gravity can be especially useful for interpreting rifted margins. 
  • Important boundaries. Your software may display these for you, but if not, you can fake it. Simply make a horizon that only exists within the polygon — a lease boundary perhaps — by interpolating within a polygon. Make this horizon flat and deep (deeper than the seismic), then merge it with a horizon that is flat and shallow (–1 ms, or anything shallower than the seismic). You should end up with almost-vertical lines at the edges of the feature.
  • Section headings. I like to organize horizons into groups — stratigraphy, attributes, models, markers, etc. I make empty horizons to act only as headings so I can see at a glance what's going on. Whether you need do this, and how you achieve it, depends on your software.

Most of these horizons don't take long to make, and I promise you'll find uses for them throughout the interpretation project. 

If you have other helpful horizon hacks, I'd love to hear about them — put your favourites in the comments. 


Footnotes

* It's not always obvious how to make a flat horizon. A quick way is to take some ubiquitous horizon — the seafloor maybe — and multiply it by zero.

** The velocity of sound in seawater is not a simple subject. If you want to be precise about it, you can try this online calculator, or implement the equations yourself.

The 2D seismic dataset shown is from the Laurentian Basin, offshore Newfoundland. The dataset is copyright of Natural Resources Canada, and subject to the Open Government License – Canada. You can download it from the OpendTect Open Seismic Repository. The cultural boundary and gravity data is fictitious — I made them up for the purposes of illustration.

References

Bale, Sean, Tiago M. Alves, Gregory F. Moore (2014). Distribution of gas hydrates on continental margins by means of a mathematical envelope: A method applied to the interpretation of 3D seismic data. Geochem. Geophys. Geosyst. 15, 52–68, doi:10.1002/2013GC004938. Note: the equations are in the Supporting Information.

A stupid seismic model from core

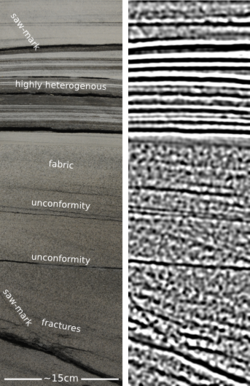
On the plane back from Calgary, I got an itch to do some image processing on some photographs I took of the wonderful rocks on display at the core convention. Almost inadvertently, I composed a sequence of image filters that imitates a seismic response. And I came to these questions:  

  • Is this a viable way to do forward modeling? 
  • Can we exploit scale invariance to make more accurate forward models?
  • Can we take the fabric from core and put it in a reservoir model?
  • What is the goodness of fit between colour and impedance? 

Click to enlargeAbove all, this image processing excerise shows an unambiguous demonstration of the effects of bandwidth. The most important point, no noise has been added. Here is the sequence, it is three steps: convert to grayscale, compute Laplacian, apply bandpass filter. This is analgous to the convolution of a seismic wavelet and the earth's reflectivity. Strictly speaking, it would be more physically sound to make a forward model using wavelet convolution (simple) or finite difference simulation (less simple), but that level of rigour was beyond the scope of my tinkering.

The two panels help illustrate a few points. First, finely layered heterogeneous stratal packages coalesce into crude seismic events. This is the effect of reducing bandwidth. Second, we can probably argue about what is 'signal' and what is 'noise'. However, there is no noise, per se, just geology that looks noisy. What may be mistaken as noise, might in fact be bonafide interfaces within material properties. 

If the geometry of geology is largely scale invariant, perhaps, just perhaps, images like these can be used at the basin and reservoir scale. I really like the look of the crumbly fractures near the bottom of the image. This type of feature could drive the placement of a borehole, and the production in a well. The patches, speckles, and bands in the image are genuine features of the geology, not issues of quality or noise. 

Do you think there is a role for transforming photographs of rocks into seismic objects?

The deliberate search for innovation & excellence

Collaboration, knowledge sharing, and creativity — the soft skills — aren't important as ends in themselves. They're really about getting better at two things: excellence (your craft today) and innovation (your craft tomorrow). Soft skills matter not because they are means to those important ends, but because they are the only means to those ends. So it's worth getting better at them. Much better.

One small experiment

The Unsession three weeks ago was one small but deliberate experiment in our technical community's search for excellence and innovation. The idea was to get people out of one comfort zone — sitting in the dark sipping coffee and listening to a talk — and into another — animated discussion with a roomful of other subsurface enthusiasts. It worked: there was palpable energy in the room. People were talking and scribbling and arguing about geoscience. It was awesome. You should have been there. If you weren't, you can get a 3-minute hint of what you missed from the feature film...

Go on, share the movie — we want people to see what a great time we had! 

Big thank you to the award-winning Craig Hall Video & Photography (no relation :) of Canmore, Alberta, for putting this video together so professionally. Time lapse, smooth pans, talking heads, it has everything. We really loved working with them. Follow them on Twitter. 

Proceedings of an unsession

Two weeks ago today Evan and I hosted a different kind of session at the Canada GeoConvention. It was an experiment in collaboration and integration, and I'm happy to say it exceeded our expectations. We will definitely be doing it again, so if you were there, or even if you weren't, any and all feedback will help ensure the dial goes to 11.

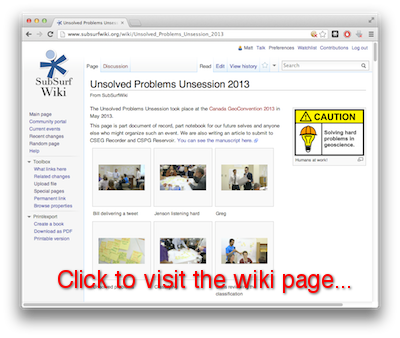
One of the things we wanted from the session was evidence. Evidence of conversation, innovation, and creative thinking. We took home a great roll of paper and sticky notes, and have now captured it all in SubSurfWiki, along with notes from the event. You are invited to read and edit. Be bold! And please share the link...

  ageo.co/unsession

The video from the morning is in the editing suite right now: watch for that too.

Post-It NoteWe have started a write-up of the morning. If you came to the session, please consider yourself a co-author: your input and comments are welcome. You might be unaccustomed to editing a community document, but don't be shy — that's what it's there for. 

We want to share two aspects of the event on the blog. First, the planning and logistics of the session — a cheatsheet for when we (or you!) would like to repeat the experience. Second, the outcomes and insights from it — the actual content. Next time: planning an unsession.

Laying it all out at the Core Conference

Bobbing in the wake of the talks, the Core Conference turned out to be more exemplary of this year's theme, Integration. Best of all were SAGD case studies, where multi-disciplinary experiments are the only way to make sense of the sticky stuff.

Coring through steam

Travis Shackleton from Cenovus did a wonderful presentation showing the impact of bioturbation, facies boundaries, and sedimentary structures on steam chamber evolution in the McMurray Formation at the FCCL project. And because I had the chance to work on this project with ConocoPhillips a few years ago, but didn't, this work induced both jealousy and awe. Their experiment design is best framed as a series of questions:

  • What if we drilled, logged, and instrumented two wells only 10 m apart? (Awesome.)
  • What if we collected core in both of them? (Double awesome.)
  • What if the wells were in the middle of a mature steam chamber? (Triple awesome.)
  • What if we collected 3D seismic after injecting all this steam and compare with with a 3D from before? (Quadruple awesome.)

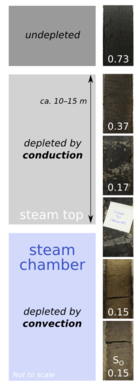
It is the first public display of SAGD-depleted oil sand, made available by an innovation of high-temperature core recovery. Travis pointed to a portion of core that had been rinsed by more than 5 years of steam circulating through it. It had a pale brown color and a residual oil saturation SO of 15% (bottom sample in the figure). Then he pointed to a segment of core above the top of the steam chamber. It too was depleted, by essentially the same amount. You'd never know just by looking. It was sticky and black and largely unscathed. My eyes were fooled, direct observation deceived.

A bitumen core full of fractures

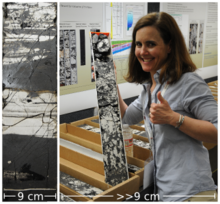
Jen-Russel-Houston held up a half-tube of core of high-density fractures riddled throughout bitumen saturated rock. The behemoth oil sands that require thermal recovery assistance have an equally promising but lesser known carbonate cousin, still in its infancy. It is the bitumen saturated Grosmont Formation, located to the west of the more mature in-situ projects in sand. The reservoir is entirely dolomite, hosting its own unique structures affecting the spreading of steam and the reduction of bitumen's viscosity to a flowable level.

Jen and her team at OSUM hope their pilot will demonstrate that these fractures serve as transport channels for the steam, allowing it to creep around tight spots in the reservoir, which would otherwise be block the steam in its tracks. These are not the same troubling baffles and barriers caused by mud plugs or IHS, but permeability heterogeneities caused by the dolomitization process. A big question is the effective permeability at the length scales of production, which is phenomenologically different to measurements made from cut core. I overheard a spectator suggest to Jen that she try to freeze a sleeve of core, soak it with acid then rinse the dolomite out the bottom. After which only a frozen sculpture of the bitumen would remain. Crazy? Maybe. Intriguing? Indeed. 

Let's do more science with rocks!

Two impressive experiments, unabashedly and literally laid out for all to see, equipped with clever geologists, and enriched by supplementary technology. Both are thoughtful initiatives—real scientific experiments—that not only make the operating companies more profitable, but also profoundly improve our understanding of a precious resource for society. Two role models for how comprehensive experiments can serve more than just those who conduct them. Integration at its very best, centered on core.

What are the best examples of integrated geoscience that you've seen?

A really good conversation

Today was Day 2 of the Canada GeoConvention. But... all we had the energy for was the famous Unsolved Problems Unsession. So no real highlights today, just a report from the floor of Room 101.

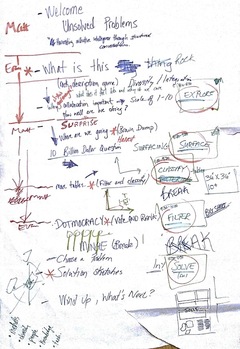
Today was the day. We slept about as well as two 8-year-olds on Christmas Eve, having been up half the night obsessively micro-hacking our meeting design (right). The nervous anticipation was richly rewarded. About 50 of the most creative, inquisitive, daring geoscientists at the GeoConvention came to the Unsession — mostly on purpose. Together, the group surfaced over 100 pressing questions facing the upstream industry, then filtered this list to 4 wide-reaching problems of integration:

  • making the industry more open
  • coping with error and uncertainty
  • improving seismic resolution
  • improving the way our industry is perceived

We owe a massive debt of thanks to our heroic hosts: Greg Bennett, Tannis McCartney, Chris Chalcraft, Adrian Smith, Charlene Radons, Cale White, Jenson Tan, and Tooney Fink. Every one of them far exceeded their brief and brought 100× more clarity and continuity to the conversations than we could have had without them. Seriously awesome people.  

This process of waking our industry up to new ways of collaborating is just beginning. We will, you can be certain, write more about the unsession after we've had a little time to parse and digest what happened.

If you're at the conference, tell us what we missed today!

Here comes GeoConvention 2013

Next week Matt and I are heading to the petroleum capital of Canada for the 2013 GeoConvention. There will be 308 talks, 125 posters, over 4000 attendees, 100 exhibiting companies, and at least 2 guys blogging their highlights off.

My picks for Monday

Studying the technical abstracts ahead of time is the only way to make the most of your schedule. There are 9 sessions going on at any given time, a deep sense of FOMO has already set in. These are the talks I have decided on for Monday: 

Seismics for unconventionals

I watched Carl Reine from Nexen give a talk two years ago where he deduced a power-law relationship characterizing natural fracture networks in the Horn River shale. He will show how integrating such fracture intensity patterns with inversion models yields a powerful predictor of frackability, and uses microseismic to confirm it.

On a related note, and also from the Horn River Basin, Andreas Wuestefeld will show how microseismic can be used to identify fluid drainage patterns from microseismic data. Production simulation from an actual microseismic experiment. Numerical modeling, and physical experiment inextricably linked. I already love it.

Forward models and experimental tests

One is a design case study for optimizing interpolation, the other is a 3D seismic geometry experiment, the third is a benchtop physical fracture model made out of Plexiglass and resin.

Broadband seismic

Gets to the point of what hinders seismic resolution, and it does something about it through thoughtful design. This is just really nice looking data, two talks, same author: a step change, and impact of broadband

Best title award 

Goes to Forensic chemostratigraphy. Gimmicky name or revolutionary concept? You can't always judge a talk by the title, or the quality of the abstract. But it's hard not to. What talks are on your must-see list this year?

A really good conversation

Matt and I are hosting an unsession on the morning of Tuesday 7 May. It will be structured, interactive, and personal. The result: a ranked list of the most pressing problems facing the upstream geoscientists, especially in those hard to reach places between the disciplines. This is not a session where you sit and listen. Everyone will participate. We will explore questions that matter, connect diverse perspectives, and, above all, capture our collective knowledge. It might be scary, it might be uncomfortable, it might not be for you. But if you think it is, bring your experience and individuality, and we will do that thing called integration. We can only host 60 people, so if you don't want to be turned away, arrive early to claim a spot. We start at 8 a.m. in Telus 101/102 on the main floor of the north building.

An invitation to a brainstorm

Who of us would not be glad to lift the veil behind which the future lies hidden; to cast a glance at the next advances of our science and at the secrets of its development during future centuries? What particular goals will there be toward which the leading [geoscientific] spirits of coming generations will strive? What new methods and new facts in the wide and rich field of [geoscientific] thought will the new centuries disclose?

— Adapted from David Hilbert (1902). Mathematical Problems, Bulletin of the American Mathematical Society 8 (10), p 437–479. Originally appeared in in Göttinger Nachrichten, 1900, pp. 253–297.

Back at the end of October, just before the SEG Annual Meeting, I did some whining about conferences: so many amazing, creative, energetic geoscientists, doing too much listening and not enough doing. The next day, I proposed some ways to make conferences for productive — for us as scientists, and for our science itself. 

Evan and I are chairing a new kind of session at the Calgary GeoConvention this year. What does ‘new kind of session’ mean? Here’s the lowdown:

The Unsolved Problems Unsession at the 2013 GeoConvention will transform conference attendees, normally little more than spectators, into active participants and collaborators. We are gathering 60 of the brightest, sparkiest minds in exploration geoscience to debate the open questions in our field, and create new approaches to solving them. The nearly 4-hour session will look, feel, and function unlike any other session at the conference. The outcome will be a list of real problems that affect our daily work as subsurface professionals — especially those in the hard-to-reach spots between our disciplines. Come and help shed some light, room 101, Tuesday 7 May, 8:00 till 11:45.

What you can do

  • Where does your workflow stumble? Think up the most pressing unsolved problems in your workflows — especially ones that slow down collaboration between the disciplines. They might be organizational, they might be technological, they might be scientific.
  • Put 7 May in your calendar and come to our session! Better yet, bring a friend. We can accommodate about 60 people. Be one of the first to experience a new kind of session!
  • If you would like to help host the event, we're looking for 5 enthusiastic volunteers to play a slightly enlarged role, helping guide the brainstorming and capture the goodness. You know who you are. Email hello@agilegeoscience.com

The calculus of geology

Calculus is the tool for studying things that change. Even so, in the midst of the dynamic and heterogeneous earth, calculus is an under-practised and, around the water-cooler at least, under-celebrated workhorse. Maybe that's because people don't realize it's all around us. Let's change that. 

Derivatives of duration

We can plot the time f(x) that passes as a seismic wave travels though space x. This function is known to many geophysicists as the time-to-depth function. It is key for converting borehole measurements, effectively recorded using a measuring tape, to seismic measurements, recorded using a stop watch.

Now let's take the derivative of f(x) with repsect to x. The result is the slowness function (the reciprocal of interval velocity):

The time duration that a seismic wave travels over a small interval (one metre). This function is an actual sonic well log. Differentiating once again yields this curious spiky function:

Geophysicists will spot that this resembles a reflection coefficient series, which governs seismic amplitudes. This is actually a transmission coefficient function, but that small detail is beside the point. In this example, the creating a synthetic seismogram mimics the calculus of geology. 

If you are familiar with the integrated trace attribute, you will recognize that it is an attempt to compute geology by integrating reflectivity spikes. The only issue in this case, and it is a major issue, is that the seismic trace is bandlimited. It does not contain all the information about the earth's slowness. So the earth's geology remains elusive and blurry.

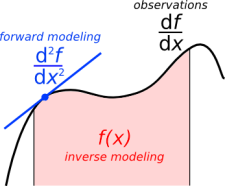
The derivative of slowness yields the reflection boundaries, the integral of slowness yields their position. So in geophysics speak, I wonder, is forward modeling akin to differentiation, and inverse modeling akin to integration? I find it fascinating that these three functions have essentially the same density of information, yet they look increasingly complicated when we take derivatives. 

What other functions do you come across that might benefit from the calculus treatment?

The sonic log used in this example is from the O-32-B/11-E-64 well onshore Nova Scotia, which is publically available but not easily accessible online.