Making images or making prospects?

Well-rounded geophysicists will have experience in each of the following three areas: acquisition, processing, and interpretation. Generally speaking, these three areas make up the seismic method, each requiring highly specified knowledge and tools. Historically, energy companies used to control the entire spectrum, owning the technology, the know-how and the risk, but that is no longer the case. Now, service companies do the acquisition and the processing. Interpretation is largely hosted within E & P companies, the ones who buy land and drill wells. Not only has it become unreasonable for a single geophysicist to be proficient across the board, but organizational structures constrain any particular technical viewpoint. 

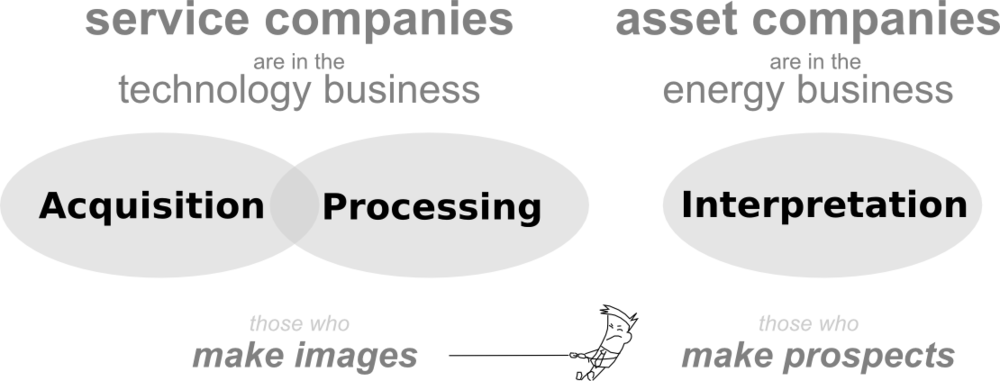
Aligning with the industry's strategy, if you are a geophysicist, you likely fall into one of two camps: those who make images, or those who make prospects. One set of people to make the data, one set of people to do the interpretation.

This seems very un-scientific to me.

Where does science fit in?

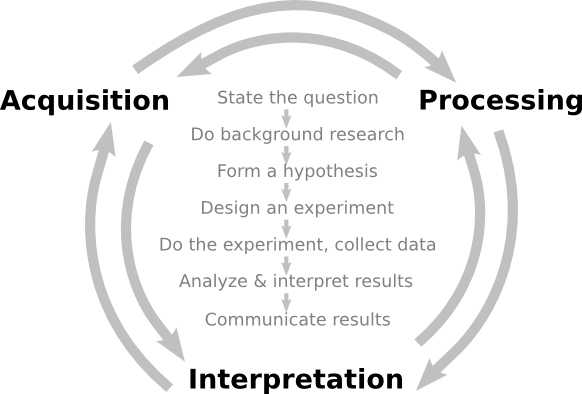
Science, the standard approach of rational inquiry and accruing knowledge, is largely vacant from the applied geophysical business landscape. But, when science is used as a model, making images and making prospects are inseperable.

Can applied geophysics use scientific behaviour as a central anchor across disciplines?

There is a significant amount of science that is needed in the way that we produce observations, in the way that we make images. But the business landscape built on linear procedures leaves no wiggle room for additional testing and refinement. How do processors get better if they don't hear about their results? As a way of compensating, processing has deflected away from being a science of questioning, testing, and analysis, and moved more towards, well,... a process.

The sure-fire way to build knowledge and decrease uncertainty, is through experimentation and testing. In this sense this notion of selling 'solutions', is incompatible with scientific behavior. Science doesn't claim to give solutions, science doesn't claim to give answers, but it does promise to address uncertainty; to tell you what you know.

In studying the earth, we have to accept a lack of clarity in our data, but we must not accept mistakes, errors, or mediocrity due to shortcomings in our shared methodologies.

We need a new balance. We need more connectors across these organizational and disciplinary divides. That's where value will be made as industry encounters increasingly tougher problems. Will you be a connector? Will you be a subscriber to science?

Hall, M (2012). Do you know what you think you know? CSEG Recorder 37 (2), February 2012, p 26–30. Free to download from CSEG. 

Ten ways to spot pseudogeophysics

Geophysicists often try to predict rock properties using seismic attributes — an inverse problem. It is difficult and can be complicated. It can seem like black magic, or at least a black box. They can pull the wool over their own eyes in the process, so don’t be surprised if it seems like they are trying to pull the wool over yours. Instead, ask a lot of questions.

Questions to ask

  1. What is the reliability of the logs that are inputs to the prediction? Ask about hole quality and log editing.
  2. What about the the seismic data? Ask about signal:noise, multiples, bandwidth, resolution limits, polarity, maximum offset angle (for AVO studies), and processing flow (e.g. Emsley, 2012).
  3. What is the quality of the well ties? Is the correlation good enough for the proposed application?
  4. Is there any physical reason why the seismic attribute should predict the proposed rock property? Was this explained to you? Were you convinced?
  5. Is the proposed attribute redundant (sensu Barnes, 2007)? Does it really give better results than a less sexy approach? I’ve seen 5-minute trace integration outperform month-long AVO inversions (Hall et al. 2006).
  6. What are the caveats and uncertainties in the analysis? Is there a quantitative, preferably Bayesian, treatment of the reliability of the predictions being made? Ask about the probability of a prediction being wrong.
  7. Is there a convincing relationship between the rock property (shear impedance, say) and some geologically interesting characteristic that you actually make decisions with, e.g. frackability.
  8. Is there a convincing relationship between the rock property and the seismic attribute at the wells? In other words, does the attribute actually correlate with the property where we have data?
  9. What does the low-frequency model look like? How was it made? Its maximum frequency should be about the same as the seismic data's minimum, no more.
  10. Does the geophysicist compute errors from the training error or the validation error? Training errors are not helpful because they beg the question by comparing the input training data to the result you get when you use those very data in the model. Funnily enough, most geophysicists like to show the training error (right), but if the model is over-fit then of course it will predict very nicely at the well! But it's the reliability away from the wells we are interested in, so we should examine the error we get when we pretend the well isn't there. I prefer this to witholding 'blind' wells from the modeling — you should use all the data. 

Lastly, it might seem harsh but we could also ask if the geophysicist has a direct financial interest in convincing you that their attribute is sound, as well as the normal direct professional interest. It’s not a problem if they do, but be on your guard — people who are selling things are especially prone to bias. It's unavoidable.

What do you think? Are you bamboozled by the way geophysicists describe their predictions?

References
Barnes, A (2007). Redundant and useless seismic attributes. Geophysics 72 (3), p P33–P38. DOI: 10.1190/1.2370420.
Emsley, D. Know your processing flow. In: Hall & Bianco, eds, 52 Things You Should Know About Geophysics. Agile Libre, 2012. 
Hall, M, B Roy, and P Anno (2006). Assessing the success of pre-stack inversion in a heavy oil reservoir: Lower Cretaceous McMurray Formation at Surmont. Canadian Society of Exploration Geophysicists National Convention, Calgary, Canada, May 2006. 

The image of the training error plot — showing predicted logs in red against input logs — is from Hampson–Russell's excellent EMERGE software. I'm claiming the use of the copyrighted image is fair use.  

Geophysics bliss

For the first time in over 20 years, the EAGE Conference and Exhibition is in Copenhagen, Denmark. Since it's one of my favourite cities, and since there is an open source software workshop on Friday, and since I was in Europe anyway, I decided to come along. It's my first EAGE since 2005 (Madrid).

Sunday and Monday saw ten workshops on a smörgåsbord of topics from broadband seismic to simulation and risk. The breadth of subject matter is a reminder that this is the largest integrated event in our business: geoscientists and engineers mingle in almost every session of the conference. I got here last night, having missed the first day of sessions. But I made up for it today, catching 14 out of the 208 talks on offer, and missing 100% of the posters. If I thought about it too long, this would make me a bit sad, but I saw some great presentations so I've no reason to be glum. Here are some highlights...

One talk this afternoon left an impression. Roberto Herrera of the BLind Identification of Seismic Signals (BLISS, what else?) project at the University of Alberta, provoked the audience with talk of Automated seismic-to-well ties. Skeptical glances were widely exchanged, but what followed was an elegant description of cross-correlation, and why it fails to correlate across changes in scale or varying time-shifts. The solution: Dynamic Time Warping, an innovation that computes the Euclidean distance between every possible pair of samples. This process results in a matrix of cross-correlations, the minimal cost path across this matrix is the optimal correlation. Because this path does not necessarily correlate time-equivalent samples, time is effectively warped. Brilliant. 

I always enjoy hearing about small, grass-roots efforts at the fringes. Johannes Amtmann of Joanneum Research Resources showed us the foundations of a new online resource for interpreters (Seismic attribute database for time-effective literature search). Though not yet online, seismic-attribute.info will soon allow anyone to search a hand-picked catalog of more than 750 papers on seismic attributes (29% of which are from The Leading Edge, 13% from Geophysics, 10% from First Break, and the rest from other journals and conferences). Tagged with 152 keywords, papers can be filtered for, say, papers on curvature attributes and channel interpretation. We love Mendeley for managing references, but this sounds like a terrific way to jump-start an interpretation project. If there's a way for the community at large to help curate the project, or even take it in new directions, it could be very exciting.

One of the most enticing titles was from Jan Bakke of Schlumberger: Seismic DNA — a novel seismic feature extraction method using non-local and multi-attribute sets. Jan explained that auto-tracking usually only uses data from the immediate vicinity of the current pick, but human interpreters look at the stacking pattern to decide where to pick. To try to emulate this, Jan's approach is to use the simple-but-effective approach of regular expression matching. This involves thresholding the data so that it can be represented by discrete classes (a, b, c, for example). The interpreter then builds regex rules, which Jan calls nucleotides, to determine what constitutes a good pick. The rules operate over a variable time window, thus the 'non-local' label. Many volumes can influence the outcome as concurrent expressions are combined with a logical AND. It would be interesting to compare the approach to ordinary trace correlation, which also accounts for wave shape in an interval.

SV reflectivity with offset. Notice the zero-crossing at about 24° and the multiple critical angles. The first talk of the day was a mind-bending (for me) exploration of the implications of Brewster's angle — a well-understood effect in optics — for seismic waves in elastic media. In Physical insight into the elastic Brewster's angleBob Tatham (University of Texas at Austin) had fun with shear wave ray paths for shear waves, applying some of Aki and Richards's equations to see what happens to reflectivity with offset. Just as light is polarized at Brewster's angle (hence Polaroid sunglasses, which exploit this effect), the reflectivity of SV waves drops to zero at relatively short offsets. Interestingly, the angle (the Tatham angle?) is relatively invariant with Vp/Vs ratio. Explore the effect yourself with the CREWES Zoeppritz Explorer.

That's it for highlights. I found most talks were relatively free from marketing. Most were on time, though sometimes left little time for questions. I'm looking forward to tomorrow.

If you were there today, I'd love to hear about talks you enjoyed. Use the comments to share.

Pair picking

Even the Lone Ranger didn't work alone all of the timeImagine that you are totally entrained in what you are doing: focused, dedicated, and productive. If you've lost track of time, you are probably feeling flow. It's an awesome experience when one person gets it, imagine the power when teams get it. Because there are so many interruptions that can cause turbulence, it can be especially difficult to establish coherent flow for the subsurface team. But if you learn how to harness and hold onto it, it's totally worth it.

Seismic interpreters can seek out flow by partnering up and practising pair picking. Having a partner in the passenger seat is not only ideal for training, but it is a superior way to get real work done. In other industries, this has become routine because it works. Software developers sometimes code in pairs, and airline pilots share control of an aircraft. When one person is in charge of the controls, the other is monitoring, reviewing, and navigating. One person for tactical jobs, one for strategic surveillance.

Here are some reasons to try pair picking:

Solve problems efficiently — If you routinely have an affiliate, you will have someone to talk to when you run into a challenging problem. Mundane or sticky workarounds become less tenuous when you have a partner. You'll adopt more sensible solutions to your fit-for-purpose hacks.

Integrate smoothly — There's a time for hand-over, and there will be times when you must call upon other people's previous work to get your job done. 'No! Don't use Top_Cretaceous_candidate_final... use Evan_K_temp_DO-NOT-USE.' Pairing with the predecessors and successors of your role will get you better-aligned.

Minimize interruptionitis — if you have to run to a meeting, or the phone rings, your partner can keep plugging away. When you return you will quickly rejoin. It is best to get into a visualization room, or some other distraction-free room with a large screen, so as to keep your attention and minimize the effect of interruptions.

Mutual accountability — build allies based on science, technology, and critical thinking, not gossip or politics. Your team will have no one to blame, and you'll feel more connected around the office. Is knowledge hoarded and privileged or is it open and shared? If you pick in pairs, there is always someone who can vouch for your actions.

Mentoring and training — by pair picking, newcomers quickly get to watch the flow of work, not just a schematic flow-chart. Instead of just an end-product, they see the clicks, the indecision, the iteration, and the pace at which tasks unfold.

Practicing pair picking is not just about sharing tasks, it is about channeling our natural social energies in the pursuit of excellence. It may not be practical all of the time, and it may make you feel vulnerable, but pairing up for seismic interpretation might bring more flow to your workflow.

If you give it a try, please let us know how it goes!

D is for Domain

Domain is a term used to describe a variable for which a set of functions or signals are defined.

Time-domain describes functions or signals that change over time; depth-domain describes functions or signal that change over space. The oscillioscope, geophone, and heartrate monitor are tools used to visualize real-world signals in the time domain. The map, photograph, and well log are tools to describe signals in the depth (spatial) domain.

Because seismic waves are recorded in time (jargon: time series), seismic data are naturally presented and interpreted with time as the z-axis. Routinely though, geoscientists must convert data and data objects between the time and depth domain.

Consider the top of a hydrocarbon-bearing reservoir in the time domain (top panel). In this domain, it looks like wells A and B will hit the reservoir at the same elevation and encounter the same amount of pay.

In this example the velocities that enable domain conversion vary from left to right, thereby changing the position of this structure in depth. The velocity model (second panel) linearly decreases from 4000 m/s on the left, to 3500 m/s on the right; this equates to a 12.5% variation in the average velocities in the overburden above the reservoir.

This velocity gradient yields a depth image that is significantly different than the time domain representation. The symmetric time structure bump has been rotated and the spill point shifted from the left side to the right. More importantly, the amount of reservoir underneath the trap has been drastically reduced. 

Have you encountered examples in your work where data domains have been misleading?

Although it is perhaps more intuitive to work with depth-domain data wherever possible, sometimes there are good reasons to work with time. Excessive velocity uncertainty makes depth conversion so ambiguous that you are better off in time-domain. Time-domain signals are recorded at regular sample rates, which is better for signal processing and seismic attributes. Additionally, travel-time itself is an attribute in that it may be recorded or mapped for its physical meaning in some cases, for example time-lapse seismic.

If you think about it, all three of these models are in fact different representations of the same earth. It might be tempting to regard the depth picture as 'reality' but if it's your only perspective, you're kidding yourself. 

The integration gap

Agile teams have lots of ways to be integrated. They need to be socially integrated: they need to talk to each other, know what team-mates are working on, and have lots of connections to other agile teams and individuals. They need to be actively integrated: their workflows must complement one another's. If the geologist is working on new bulk density curves, the geophysicist uses those curves for the synthetic seismograms; if the geophysicist tweaks the seismic inversion result, the geomodeller uses that volume for the porosity distribution.

But the agile team also needs to be empirically integrated: the various datasets need to overlap somehow so they can be mutually calibrated and correlated. But if we think about the resolution of subsurface data, both spatially, in the (x,y) plane, and vertically, on the z axis, we reveal a problem—the integration gap.

Scales_of_measurement.png

This picks up again on scale (see previous post). Geophysical data is relatively low-resolution: we can learn all about large, thick features. But we know nothing about small things, about a metre in size, say. Conversely, well-based data can tell us lots about small things, even very small things indeed. A vertical well can tell us about thick things, but not spatially extensive things. A horizontal well can tell us a bit more about spatially large things, but not about thick things. And in between this small-scale well data and the large-scale seismic data? A gap. 

This little gap is responsible for much of the uncertainty we encounter in the subsurface. It is where the all-important well-tie lives. It leads to silos, un-integrated behaviour, and dysfunctional teams. And it's where all the fun is!

† I've never thought about it before, but there doesn't seem to be an adjectival form of the word 'data'. 


UPDATE This figure was updated later:

Scales_of_measurement_complete.png