Looking forward to 2021

I usually write a ‘lookback’ at this time of year, but who wants to look back on 2#*0? Instead, let’s look forward to 2021 and speculate wildly about it!

More ways to help

Agile has always been small and nimble, but the price we pay is bandwidth: it’s hard to help all the people we want to help. But we’ve taught more than 1250 people Python and machine learning since 2018, and supporting this new community of programmers is our priority. Agile will be offering some new services in the new year, all aimed at helping you ‘just in time’ — what you need, when you need it — so that those little glitches don’t hold you up. The goal is to accelerate as many people as possible, but to be awesome value. Stay tuned!

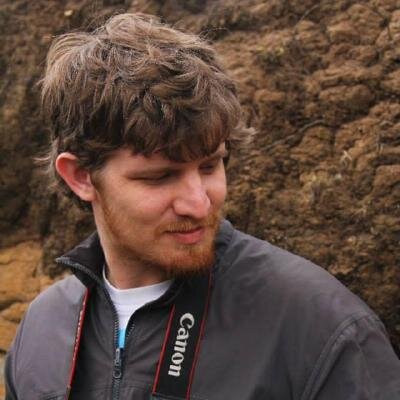
We are still small, but we did add a new scientist to the team this year: Martin Bentley joined us. Martin is a recent MSc geology graduate from Nelson Mandela University in Port Elizabeth, South Africa. He’s also a very capable Python programmer and GIS wizard, as well as a great teacher, and he’s a familiar face around the Software Underground too.

Martin2.jpeg

All over the world

While we’ll be making ourselves available in new ways in 2021, we’ll continue our live classes too — but we’ll be teaching in more accessible ways and in more time zones. This year we taught 29 virtual classes for people based in Los Angeles, Calgary, Houston, Bogotá, Rio de Janeiro, Glasgow, London, Den Haag, Krakow, Lagos, Brunei, Muscat, Tunis, Kuala Lumpur, and Perth. Next year I want to add Anchorage, Buenos Aires, Durban, Reykjavik, Jakarta, and Wellington. The new virtual world has really driven home to me how inaccessible our classes and events were — we will do better!

Public classes appear here when we schedule them: https://agilescientific.com/training

Maximum accessibility

The event I’m most excited about is TRANSFORM 2021 (mark your calendar: 17 to 23 April!), the annual virtual meeting of the Software Underground. The society incorporated back in April, so it’s now officially a technical society. But it’s unlike most other technical societies in our domain: it’s free, and — so far anyway — it operates exclusively online. Like this year, the conference will focus on helping our community acquire new skills and connections for the future. Want to be part of it? Get notified.

april-2021-big.png

agile-open_star_600px.png

Thank you for reading our blog, following Agile, and being part of the digital subsurface community. If you’re experiencing uncertainty in your career, or in your personal life, I hope you’re able to take some time out to recharge over the next couple of weeks. We can take on 2021 together, and meet it head on — not with a plan, but with a purpose.

Does your machine learning smell?

Martin Fowler and Kent Beck popularized the term ‘code smell’ in the book Refactoring. They were describing the subtle signs of deeper trouble in code — signs that a program’s source code might need refactoring (restructuring and rewriting). There are too many aromas to list here, but here are some examples (remember, these things are not necessarily problems in themselves, but they suggest you need to look more closely):

  • Duplicated code.

  • Contrived complexity (also known as showing off).

  • Functions with many arguments, suggesting overwork.

  • Very long functions, which are hard to read.

More recently, data scientist Felienne Hermans applied the principle to the world’s number one programming environment: spreadsheets. The statistics on spreadsheet bugs are quite worrying, and Hermans enumerated the smells that might lead you to them. Here are four of her original five ‘formula’ smells, notice how they correspond to the code smells above:

  • Duplicated formulas.

  • Conditional complexity (e.g. nested IF statements).

  • Multiple references, analogous to the ‘many arguments’ smell.

  • Multiple operations in one cell.

What does a machine learning project smell like?

Most machine learning projects are code projects, so some familiar smells might be emanating from the codebase (if we even have access to it). But machine learning models are themselves functions — machines that map input X to some target y. And even if the statistical model is simple, like a KNN classifier, the workflow is a sort of ‘metamodel’ and can have complexities of its own. So what are the ‘ML smells’ that might alert us to deeper problems in our prediction tools?

I asked this question on Twitter (below) and in the Software Underground

I got some great responses. Here are some ideas adapted from them, with due credit to the people named:

  • Very high accuracy, especially a complex model on a novel task. (Ari Hartikainen, Helsinki and Lukas Mosser, Athens; both mentioned numbers around 0.99 but on earth science problems I start to get suspicious well before that: anything over 0.7 is excellent, and anything over 0.8 suggests ‘special efforts’ have been made.)

  • Excessive precision on hyperparameters might suggest over-tuning. (Chris Dinneen, Perth)

  • Counterintuitive model weights, e.g. known effects have low feature importance. (Reece Hopkins, Anchorage)

  • Unreproducible, non-deterministic code, e.g. not setting random seeds. (Reece Hopkins again)

  • No description of the train–val–test split, or justification for how it was done. Leakage between training and blind data is easy to introduce with random splits in spatially correlated data. (Justin Gosses, Houston)

  • No discussion of ground truth and how the target labels relate to it. (Justin Gosses again)

  • Less than 80% of the effort spent on preparing the data. (Michael Pyrcz, Austin — who actually said 90%)

  • No discussion of the evaluation metric, eg how it was selected or designed (Dan Buscombe, Flagstaff)

  • No consideration of the precision–recall trade-off, especially in a binary classification task. (Dan Buscombe again)

  • Strong class imbalance and no explicit mention of how it was handled. (Dan Buscombe again)

  • Skewed feature importance (on one or two features) might suggest feature leakage. (John Ramey, Austin)

  • Excuses, excuses — “we need more data”, “the labels are bad”, etc. (Hallgrim Ludvigsen, Stavanger)

  • AutoML, e.g. using a black box service, or an exhaustive automated seach of models and hyperparameters.

That’s already a long list, but I’m sure there are others. Or perhaps some of these are really the same thing, or are at least connected. What do you think? What red — or at least yellow — flags do you look out for when reviewing machine learning projects? Let us know in the comments below.


If you enjoyed this post, check out the Machine learning project review checklist I wrote bout last year. I’m currently working on a new version of the checklist that includes some tips for things to look for when going over the checklist. Stay tuned for that.


The thumbnail for this post was generated automatically from text (something like, “a robot smelling a flower”… but I made so many I can’t remember exactly!). Like a lot of unconstrained image generation by AI’s, it’s not great, but I quite like it all the same.

The AI is LXMERT from the Allen Institute. Try it out or read the paper.

download (7).png

An update on Volve

Writing about the new almost-open dataset at Groningen yesterday reminded me that things have changed a little on Equinor’s Volve dataset in Norway. Illustrating the principle that there are more ways to get something wrong than to get them right, here’s the situation there.


In 2018, Equinor generously released a very large dataset from the decommissioned field Volve. The data is undoubtedly cool, but initially it was released with no licence. Later in 2018, a licence was added but it was a non-open licence, CC BY-NC-SA. Then, earlier this year, the licence was changed to a modified CC BY licence. Progress, sort of.

I think CC BY is an awesome licence for open data. But modifying licences is always iffy and in this case the modifications mean that the licence can no longer be called ‘open’, because the restrictions they add are not permitted by the Open Definition. For me, the problematic clauses in the modification are:

  • You can’t sell the dataset. This is almost as ambiguous as the previous “non-commercial” clause. What if it’s a small part of a bigger offering that adds massive value, for example as demo data for a software package? Or as one piece in a large data collection? Or as the basis for a large and expensive analysis? Or if it was used to train a commercial neural network?

  • The license covers all data in the dataset whether or not it is by law covered by copyright. It's a bit weird that this is tucked away in a footnote, but okay. I don't know how it would work in practice because CC licenses depend on copyright. (The whole point of uncopyrightable content is that you can't own rights in it, nevermind license it.)

It’s easy to say, “It’s fine, that’s not what Equinor meant.” My impression is that the subsurface folks in Equinor have always said, "This is open," and their motivation is pure and good, but then some legal people get involved and so now we have what we have. Equinor is an enormous company with (compared to me) infinite resources and a lot of lawyers. Who knows how their lawyers in a decade will interpret these terms, and my motivations? Can you really guarantee that I won’t be put in an awkward situation, or bankrupted, by a later claim — like some of GSI’s clients were when they decided to get tough on their seismic licenses?

Personally, I’ve decided not to touch Volve until it has a proper open licence that does not carry this risk.

A big new almost-open dataset: Groningen

Open data enthusiasts rejoice! There’s a large new openly licensed subsurface dataset. And it’s almost awesome.

The dataset has been released by Dutch oil and gas operator Nederlandse Aardolie Maatschappij (NAM), which is a 50–50 joint venture between Shell and ExxonMobil. They have operated the giant Groningen gas field since 1963, producing from the Permian Rotliegend Group, a 50 to 225 metre-thick sandstone with excellent reservoir properties. The dataset consists of a static geological model and its various components: data from over [edit: 6000 well logs], a prestack-depth migrated seismic volume, plus seismic horizons, and a large number of interpreted faults. It’s 4.4GB in total — not ginormous.

Induced seismicity

There’s a great deal of public interest in the geology of the area: Groningen has been plagued by induced seismicity for over 30 years. The cause has been identified as subsidence resulting from production, and became enough of a concern that the government took steps to limit production in 2014, and has imposed a plan to shut down the field completely by 2030. There are also pressure maintenance measures in place, as well as a lot of monitoring. However, the earthquakes continue, and have been as large as magnitude 3.6 — a big worry for people living in the area. I assume this issue is one of the major reasons for NAM releasing the data.*

In the map of the Top Rotliegendes (right, from Kortekaas & Jaarsma 2017), the elevation varies from –2442 m (red) to –3926 m. Major faults are shown in blue, along with seismic events of local magnitude 1.3 to 3.6. The Groningen field outline is shown in red.

Rotliegendes_at_Groningen.png

Can you use the data? Er, maybe.

Anyone can access the data. NAM and Utrecht University, who have published the data, have selected a Creative Commons Attribution 4.0 licence, which is (in my opinion) the best licence to use. And unlike certain other data owners (see below!) they have resisted the temptation to modify the licence and confuse everyone. (It seems like they were tempted though, as the metadata contains the plea, “If you intend on using the model, please let us know […]”, but it’s not a requirement.)

However, the dataset does not meet the Open Definition (see section 1.4). As the owners themselves point out, there’s a rather major flaw in their dataset:


This model can only be used in combination with Petrel software • The model has taken years of expert development. Please use only if you are a skilled Petrel user.


I’ll assume this is a statement of fact, as opposed to a formal licence restriction. It’s clear that requiring (de facto or otherwise) the use of proprietary software (let alone software costing more than USD 100,000!) is not ‘open’ at all. No normal person has access to Petrel, and the annoying thing is that there’s absolutely no reason to make the dataset this inconvenient to use. The obvious format for seismic data is SEG-Y (although there is a ZGY reader out now), and there’s LAS 2 or even DLIS for wireline logs. There are no open standard formats for seismic horizons or formation tops, but some sort of text file would be fine. All of these formats have open source file readers, or can be parsed as text. Admittedly the geomodel is a tricky one; I don’t know about any open formats. [UPDATE: see the note below from EPOS-NL.]

petrel_logo.png

Happily, even if the data owners do nothing, I think this problem will be remedied by the community. Some kind soul with access to Petrel will export the data into open formats, and then this dataset really will be a remarkable addition to the open subsurface data family. Stay tuned for more on this.


References

NAM (2020). Petrel geological model of the Groningen gas field, the Netherlands. Open access through EPOS-NL. Yoda data publication platform Utrecht University. DOI 10.24416/UU01-1QH0MW.

M Kortekaas & B Jaarsma (2017). Improved definition of faults in the Groningen field using seismic attributes. Netherlands Journal of Geosciences — Geologie en Mijnbouw 96 (5), p 71–85, 2017 DOI 10.1017/njg.2017.24.


UPDATE on 7 December 2020

* According to Henk Kombrink’s sources, the dataset release is “an initiative from NAM itself, driven primarily by a need from the research community for a model of the field.” Check out Henk’s article about the dataset:

Kombrink, H (2020). Static model giant Groningen field publicly available. Article in Expro News. https://expronews.com/technology/static-model-giant-groningen-field-publicly-available/


UPDATE 10 December 2020

I got the following information from EPOS-NL:

EPOS-NL and NAM are happy to see the enthusiasm for this most recent data publication. Petrel is one of the most commonly used software among geologists in both academia and industry, and so provides a useful platform for many users worldwide. For those without a Petrel license, the data publication includes a RESCUE 3d grid data export of the model. RESCUE data can be read by a number of open source software. This information was not yet very clearly provided in the data description, so thanks for pointing this out. Finally, the well log data and seismic data used in the Petrel model are also openly accessible, without having to use Petrel software, on the NLOG website (https://www.nlog.nl/en/data), i.e. the Dutch oil and gas portal. Hope this helps!