Geophysical stamps 2: Sonic
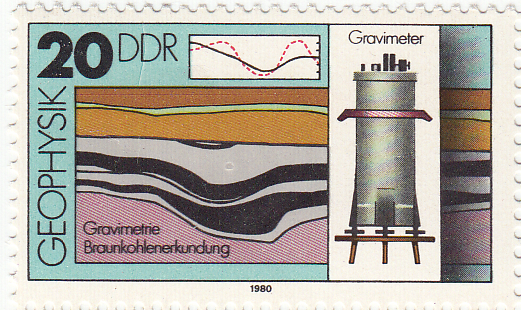
Recently I bought some stamps on eBay. This isn't something I've done before, but when I saw these stamps I couldn't resist their pure geophysical goodness. They are East German stamps from 1980, and they are unusual because they aren't fanciful illustrations, but precise, technical drawings. Last week I described the gravimeter; today it's the turn of a borehole instrument, the sonic tool.

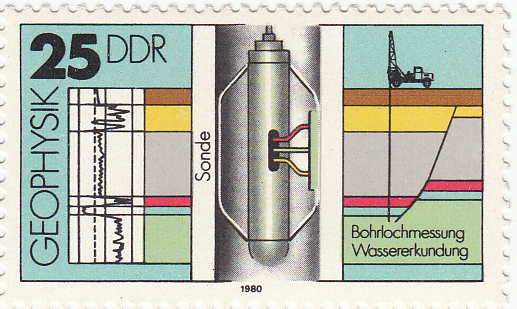
← The 25 pfennig stamp in the series of four shows a sonic tool, complete with the logged data on the left, and a cross-section on the right. Bohrlochmessung means well-logging; Wassererkundung translates as water exploration. The actual size of the stamp is 43 × 26 mm.

The tool has two components: a transmitter and a recevier. It is lowered to the bottom of the target interval and logs data while being pulled up the hole. In its simplest form, an ultrasound pulse (typically 20–40 kHz) is emitted from the transmitter, travels through the formation, and is recorded at the receiver. The interval transit time is recorded continuously, giving the trace shown on left hand side of the stamp. Transit time is measured in µs/m (or µs/ft if you're old-school), and is generally between 160 µs/m and 550 µs/m (or, in terms of velocity, 1800 m/s to 6250 m/s). Geophysicists often use the transit time to estimate seismic velocities; it's important to correct for the phenomenon called dispersion: lower-frequency seismic waves travel more slowly than the high-frequency waves measured by these tools.

Sonic logs are used for all sorts of other things, for example:

  • Predicting the seismic response (when combined with the bulk density log)
  • Predicting porosity, because of the large difference between velocity in fluids vs minerals
  • Predicting pore pressure, an important safety concern and reservoir property
  • Measuring anisotropy, especially due to oriented fractures (important for permeability)
  • Qualitatively predicting lithology, especially coals (slow), salt (4550 m/s), dolomite (fast)

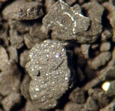
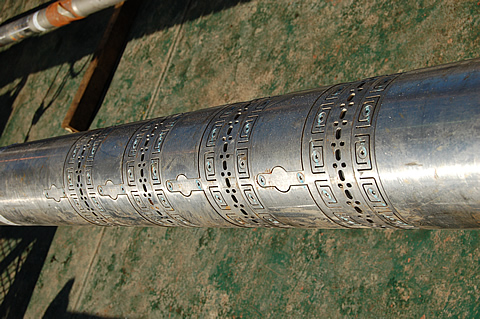
Image credit: National Energy Technology Lab.Modern tools are not all that different from early sonic tools. They measure the same thing, but with better electronics for improved vertical resolution and noise attenuation. The biggest innovations are dipole sonic tools for accurate shear-wave velocities, multi-azimuth tools for measuring anisotropy, high resolution tools, and high-pressure, high-temperature (HPHT) tools.

Another relatively recent advance is reliable sonic-while-drilling tools such as Schlumberger's sonicVISION™ system, the receiver array of which is shown here (for the 6¾" tool).

The sonic tool may be the most diversely useful of all the borehole logging tools. In a totally contrived scenario where I could only run a single tool, it would have to be the sonic, especially if I had seismic data... What would you choose?

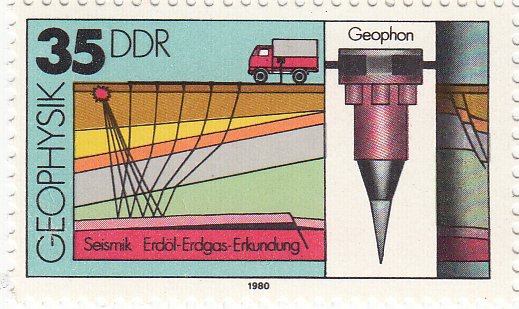
Next time I'll look at the 35 pfennig stamp, which shows a surface geophone. 

News of the week

As EAGE wraps up in Vienna, the spring geoscience convention season is now over for the big international petroleum geoscience societies (other recent conferences included AAPG, SPWLA, and Canada's GeoConvention).

Hammer, hand-lens, notebook, Twitter

A feature of this year's meetings has been the growth in Twitter as a news channel. The tweets are split about 50-50 between marketing broadcasts (mostly noise) and geoscientists' own highlights and thoughts (at least some signal). It would be splendid to see more people embrace Twitter as a way to share nuggets of information at big events. Give it a try: start an account and follow a few people. You'll get geoscience goodness from @allochthonous, @clasticdetritus, @rschott, and of course us, @kwinkunks and @EvanBianco.

Geophysics Rocks!

The International Association of Geophysical Contractors (@geophysicsrocks on Twitter) just launched an outreach website called Geophysics Rocks at the EAGE conference and trade show in Vienna this week. The new website was unveiled to thousands of attendees at the expo when more than 20 participating companies simultaneously played this two-minute video on their booth screens. Talk about a collaborative effort! After it was aired, the video URL was scanable via QR code at every booth that played it.

SEG builds e-Communities

The Society of Exploration Geophysicists (SEG) has rolled out an eCommunities page to add another dimension to their site. Members and visitors can now build and search online profiles to boost collaboration with other professionals. Is this just another late-to-the-party social network, with a new set of connections to link and maintain, or can it bring something new? It does have one thing going for it: it tugs at our primal urges for attribution and recognition among our peers. Stand out with outstanding content!

Rock Solid Images praised for rock physics atlas

Rock Solid Images (RSI) have compiled a 90-well Rock Physics & Seismic Response Atlas in support of a new licensing round in the Barents Sea. The report was announced in April and RSI has reported pre-orders of $600k ahead of its July release. The Atlas contains a catalog of forward modeled seismic responses with an emphasis on fluid substitution and saturation effects. The Atlas embodies a novel approach to setting standards of communication and knowledge across a basin. It will place RSI in a good position to sell advanced technologies to, and innovate for, their clients. Clever.

This regular news feature is for information only. We aren't connected with any of these organizations, and don't necessarily endorse their products or services.

More geophysics apps

Please welcome our latest app, Fold*, into the world. It is now available for free in the Android Market. This one is aimed at geophysicists planning land 3D seismic surveys. You provide some basic data about the geometry, and the tool computes fold in natural bins, and trace density per unit area. It also provides a qualitative description of what such a geometry might be good for (simple structure only, say, or high S:N or reflectivity areas). Read all about it in the wiki.

We have also put together a new page on this website, gathering news & info all our geoscience apps in one place. You will find it in the title bar above. Please share it with anyone you see using an Android™ phone or tablet!

 If you have a wish for an app, leave a comment or drop us a line!

Geophysical stamps

About a month ago I tweeted about some great 1980 East German stamps I'd seen on eBay. I impulsively bought them and they arrived a couple of weeks ago. I thought I'd write a bit about them and the science that inspired them. This week: Gravimeter.

East Germany in 1980 was the height of 'consumer socialism' under Chairman & General Secretary Eric Honecker. Part of this movement was a new appreciation for economic growth, and the role of science and technology in the progress of society. Putting the angsts and misdeeds of the Cold War to one side, perhaps these stamps reflect the hopes for modernity and prosperity.

← The 20 pfennig stamp from the set of four 1980 stamps from the German Democratic Republic (Deutsche Demokratische Republik). The illustration shows a relative gravimeter, the profile one might expect over a coal field (top), and a cross section through a coal deposit. Braunkohlenerkundung translates roughly as brown coal survey. Brown coal is lignite, a low-grade, low maturity coal.

There are two types of gravimeter: absolute and relative. Absolute gravimeters usually time the free-fall of a mass in a vacuum. The relative gravimeter is also a simple instrument. It must be level to measure the downward force, hence the adjustable legs. Inside the cylinder, a reference body called a proof mass is held by a spring and an electrostatic restoring force. If the gravitational force on the mass changes, the electrostatic force required to restore its position indicates the change in the gravitational field.

Fundamentally, all gravimeters measure acceleration due to gravity. Surprisingly, geophysicists do not generally use SI units, but the CGS system (centimetre–gram–second system). Thus the standard reporting units for gravimetry are not m/s2 but cm/s2, or gals (sometimes known as galileos, symbol Gal). In this system, the acceleration due to gravity at the earth's surface is approximately 980 Gal. Variations due to elevation and subsurface geology are measured in mGal or even µGal.

Image credit: David Monniaux, from commons.wikimedia.org, licensed under CC-BY-SA

Some uses for gravimeters:

  • Deep crustal structure (given the density of the crust)
  • Mineral exploration (for example, low gravity due to coal, as shown on the stamp)
  • Measuring peak ground acceleration due to natural or induced seismicity
  • Geodesic measurement, for example in defining the geoid and reference ellipsoid
  • Calibration and standards in metrology

Modern relative gravimeters use the same basic engineering, but of course has much better sensitivity, smaller errors, improved robustness, remote operation, and a more user-friendly digital interface. Vibrational noise suppression is also quite advanced, with physical isolation and cunning digital signal processing algorithms. The model shown here is the Autograv CG-5 from Scintrex in Concord, Ontario, Canada. It's designed for portability and ease of use.

Have you ever wielded a gravimeter? I've never met one face to face, but I love tinkering with precision instruments. I bet they pop up on eBay occasionally...

Next time I'll look at the the 25 pfennig stamp, which depicts a sonic borehole  tool.

News of the week

We've had a couple of weeks off in the newsroom, making way for the Canadian Geoconvention in Calgary last week. But this week we're back with geoscience and technology news that has caught our beady eyes recently.

Bids called for three oil blocks off Newfoundland

The Canada-Newfoundland and Labrador Offshore Petroleum Board (CNLOPB) called for nominations on three exploration parcels: one in the Gulf of St Lawrence, a second near the northern tip of Labrador, and a third in the Flemish Pass region north of the Jeanne d'Arc Basin. Producing projects in the latter area are delivering about 263 000 barrels per day. Interested parties have until 15 November to submit a bid.

Perceptive Pixel's 27" tablet

Perceptive Pixel has just announced a brand new 27-inch multi-touch desktop screen that could redefine the personal workstation and transform the way we work with computers. This new product isn't totally new technology, but it should be much more affordable and 'desktop ready' than their previous, highly customized, offerings. We can't wait to see seismic data on this thing! 

CEO Jeff Han originally introduced this technology at a TED conference in 2006. To read more about the technology and the company, which already lists Chevron among its clients, check out the press release

Open prestack seismic

The Open Seismic Repository, curated by dGB Earth Sciences, has just made available the prestack gathers for the Penobscot 3D seismic volume. This is especially exciting for Canadians: the Penobscot data are from Sable Island, Nova Scotia. This data set is over 100 GB and just might be the largest freely accessible seismic data on the web. It's an exciting addition to the collection, which already includes a small subset of gathers (below). We hope interpretations and reprocessings of these data get shared back into the community. Openness FTW!

In other news, dGB Earth Sciences and ARK CLS have launched an OpendTect connector plug-in for Schlumberger's Petrel, so that OpendTect's leading commercial plug-ins can accessed by the Petrel community. The plug-in is available in Schlumberger's OceanStore.

This regular news feature is for information only. We aren't connected with any of these organizations, and don't necessarily endorse their products or services. OpendTect is a mark of dGB Earth Sciences, and Petrel and Ocean are marks of Schlumberger.

Volumetrics on the back of a digital envelope

A few weeks ago we launched our first mobile app, Volume*, now available in the Android Market (you can jump right to it with the barcode on the right). If you have an Android phone or tablet, please check it out! Today, I thought I'd write a bit more about I built the app, show you some of the gory details, and tell you about the latest update.

Read More

This business of cards


At Recovery 2011, I enjoyed observing the idiosyncratic and almost compulsive act of eyes wandering from eyes, zeroing in on nametags, and the customary exchange of business cards. It is the default behavior when we are bombarded with too many strangers, all of whom deserve and desire our attention. To lessen the chore of post-processing all of these interactions, I think I will give Google Goggles a go to turn this pile of paper into digital contacts.

This got me wondering about the tools we have for making deeper connections. New digital business cards are more than geeky toys. Through cardcloud, card exchanges are paperless, and with added benefits of storing the geographic location of the encounter, and implanting social networking usernames and links right onto your cards. If you like to jot down notes on the back of paper cards, here too, you can flip them over and type your text in; "hire this guy", "he owes me a lunch next time". Not only does it stitch to all your electronic devices, but I think the virtual business card space can a be more inviting calling card for your profession.

Business cards may not be going paperless just yet, but there are many ways of bringing the digital world to these tangible bits of stationery. QR codes and RFIDs, are linking technologies so that business cards can carry digital content. Online profiles such as Facebook, Twitter, and About.me add depth, but how about functional or personalized business cards to really stand out?   

Have you changed the scope of your business card to align with the way you work?

Why we should embrace openness

Openness—open ideas, open data, open teams—can help us build more competitive, higher performing, more sutainable organizations in this industry.

Last week I took this message to the annual convention of the three big applied geoscience organizations in Canada: the Canadian Society of Petroleum Geologists (CSPG), the Canadian Society of Exploration Geophysicist (CSEG), and the Canadian Well Logging Society (CWLS). Evan and I attended the conference as scientists, but also experimented a bit with live tweeting and event blogging.

The talk was a generalization of the talk I did in March about open source software in geoscience. I wasn't sure at all how it would go over, and spent most of the morning sitting in technical talks fretting about how flaky and meta my talk would sound. But it went quite well, and at least served as some light relief from the erudition in the rest of the agenda. It was certainly fun to give an opinion-filled talk, and it started plenty of conversations afterwards.

You can access a PDF of the visuals, with commentary, from the thumbnail (left).

What do you think? Is a competitive, secretive industry like oil and gas capable of seeing value in openness? Might regulators eventually force us to share more as the resources society demands become scarcer? Or are we doomed to more mistrust and secrecy as oil and gas become more expensive to produce?

← Click the image for the PDF (6.8M)

The core of the conference

Andrew Couch of Statoil answering questions about his oil sands core, standing in front of a tiny fraction of the core collection at the ERCBToday at the CSPG CSEG CWLS convention was day 1 of the core conference. This (unique?) event is always well attended and much talked-about. The beautiful sunshine and industry-sponsored lunch today helped (thanks Weatherford!).

One reason for the good turn-out is the incredible core research facility here in Calgary. This is the core and cuttings storage warehouse and lab of the Energy Resources Conservation Board, Alberta's energy regulator. I haven't been to a huge number of core stores around the world, but this is easily the largest, cleanest, and most efficient one I have visited. The picture gives no real indication of the scale: there are over 1700 km of core here, and cuttings from about 80 000 km of drilling. If you're in Calgary and you've never been, find a way to visit. 

Ross Kukulski of the University of Calgary is one of Stephen Hubbard's current MSc students. Steve's students are consistently high performers, with excellent communication and drafting skills; you can usually spot their posters from a distance. Ross is no exception: his poster on the stratigraphic architecture of the Early Cretaceous Monach Formation of NW Alberta was a gem. Ross has integrated data from about 30 cores, 3300 (!) well logs, and outcrop around Grand Cache. While this is a fairly normal project for Alberta, I was impressed with the strong quantitative elements: his provenance assertions were backed up with Keegan Raines' zircon data, and channel width interpretation was underpinned by Bridge & Tye's empirical work (2000; AAPG Bulletin 84).

The point bar in Willapa Bay where Jesse did his coring. Image from Google Earth. Jesse Schoengut is a MSc student of Murray Gingras, part of the ichnology powerhouse at the University of Alberta. The work is an extension of Murray's long-lived project in Willapa Bay, Washington, USA. Not only had the team collected vibracore along a large point bar, but they had x-rayed these cores, collected seismic profiles across the tidal channel, and integrated everything into the regional dataset of more cores and profiles. The resulting three-dimensional earth model is helping solve problems in fields like the super-giant Athabasca bitumen field of northeast Alberta, where the McMurray Formation is widely interpreted to be a tidal estuary somewhat analogous to Willapa. 

Greg Hu of Tarcore presented his niche business of photographing bitumen core, and applying image processing techniques to complement and enhance traditional core descriptions and analysis. Greg explained that unrecovered core and incomplete sampling programs result in gaps and depth misalignment—a 9 m core barrel can have up to several metres of lost core which can make integrating core information with other subsurface information intractable. To help solve this problem, much of Tarcore's work is depth-correcting images. He uses electrical logs and FMI images to set local datums on centimetre-scale beds, mud clasts, and siderite nodules. Through color balancing, contrast stretching, and image analysis, shale volume (a key parameter in reservoir evaluation) can be computed from photographs. This approach is mostly independent of logs and offers much higher resolution.

It's awesome how petroleum geologists are sharing so openly at this core workshop, and it got us thinking: what would a similar arena look like for geophysics or petrophysics? Imagine wandering through a maze of 3D seismic volumes, where you can touch, feel, ask, and learn.

Don't miss our posts from day 1 of the convention, and from days 2 and 3.

Cracks, energy, and nanoseismic

Following on from our post on Monday, here are some presentations that caught our attention on days 2 and 3 at the CSPG CSEG CWLS convention this week in Calgary. 

On Tuesday, Eric von Lunen of Nexen chose one of the more compelling titles of the conference: What do engineers need from geophysicists in shale resource plays? Describing some of the company's work in the Horn River sub-basin, he emphasized the value of large, multi-faceted teams of subsurface scientists, including geochemists, geologists, geophysicists, petrophysicists, and geo-mechanics. One slightly controversial assertion: Nexen interprets less than 20% of the fractures as vertical, and up to 40% as horizontal. 

Jon Olson is Associate Professor at University of Texas at Austin, shared some numerical modeling and physical experiments that emphasized the relevance of subcritical crack indices for unconventional reservoir exploitation. He presented the results of a benchtop hydrofracking experiment on a cubic foot of gyprock. By tinting frac fluids with red dye, Jon is able to study the fracture patterns directly by slicing the block and taking photographs. It would be curious to perform micro-micro-seismic (is that nanoseismic?) experiments, to make a more complete small-scale analog.

Shawn Maxwell of Schlumberger is Mr Microseismic. We're used to thinking of the spectrum of a seismic trace; he showed the spectrum of a different kind of time series, the well-head pressure during a fracture stimulation. Not surprisingly, most of the energy in this spectrum is below 1 Hz. What's more, if you sum the energy recorded by a typical microseismic array, it amounts to only one millionth of the total energy pumped into the ground. The deficit is probably aseismic, at least certainly outside the seismic band (about 5 Hz to 200 Hz on most jobs). Where is the rest of the pumped energy? Some sinks are: friction losses in the pipe, friction losses in the reservoir, heat, etc.

Image of Horn River shale is licensed CC-BY-SA, from Qyd on Wikimedia Commons.