July linkfest

It's linkfest time again. All the links, in one handy post.

First up — I've seen some remarkable scientific visualizations recently. For example, giant ocean vortices spiralling across the globe (shame about the rainbow colourbar though). Or the trillion-particle Dark Sky Simulation images we saw at SciPy. Or this wonderful (real, not simulated) video by the Perron Group at MIT:

Staying with visuals, I highly recommend reading anything by Mike Bostock, especially if you're into web technology. The inventor of D3.js, a popular data viz library, here's his exploration of algorithms, from sampling to sorting. It's more conceptual than straight up visualization of data, but no less insightful. 

And I recently read about some visual goodness combined with one of my favourite subjects, openness. Peter Falkingham, a palaeontologist at the Royal Vetinary College and Brown University, has made a collection of 3D photographs of modern tracks and traces available to the world. He knows his data is more impactful when others can use it too.

Derald Smith and sedimentology

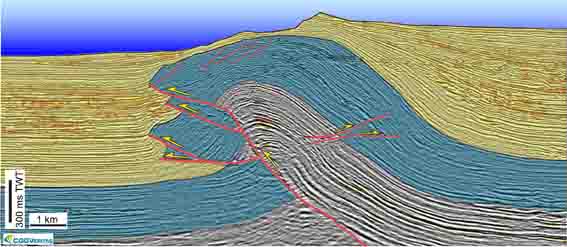
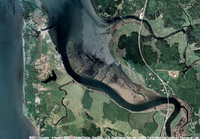
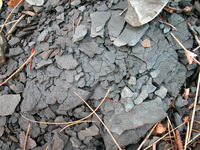
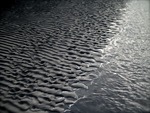
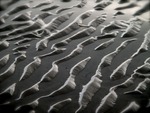
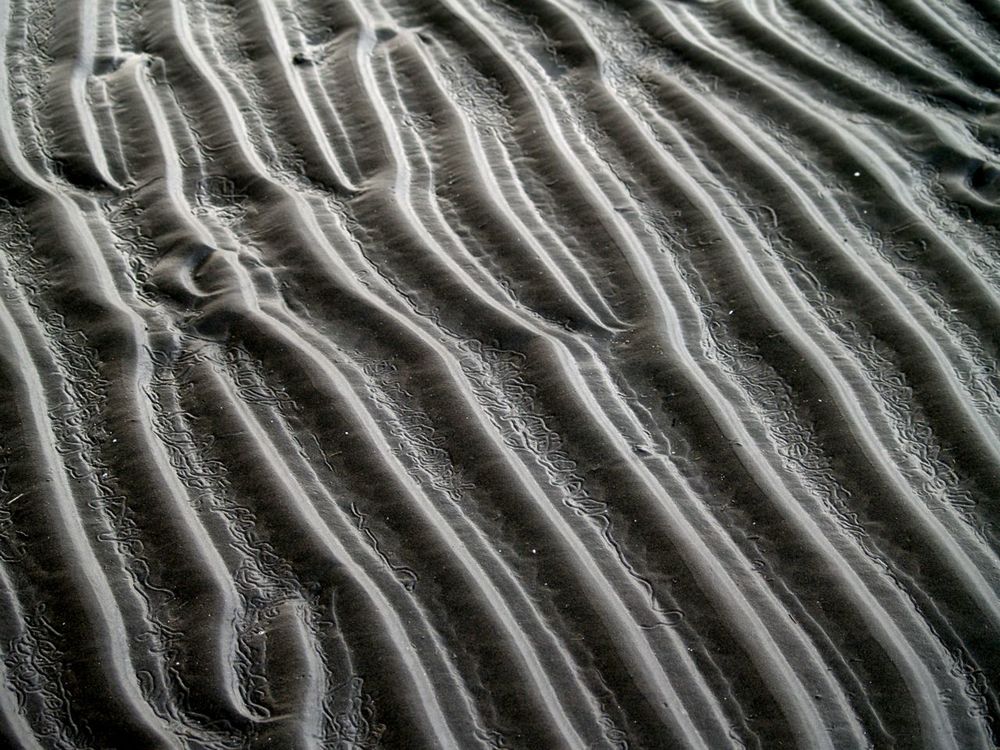
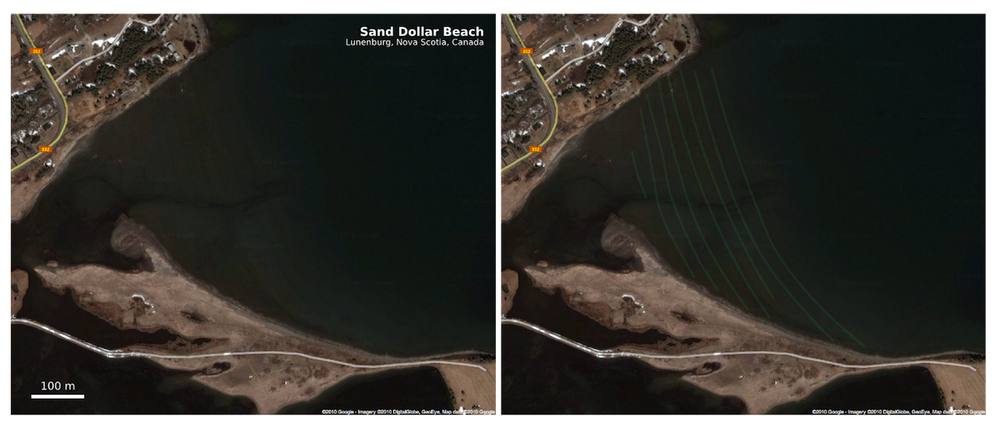
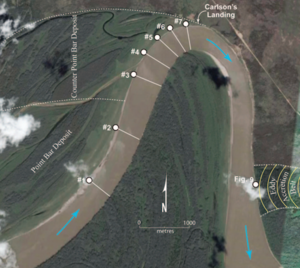
From Smith et al. (2009) in SEPM Special Publication No. 97.The geological world was darkened by the death of Derald Smith on 18 June. I met Derald a few times in connection with working on the McMurray Formation of Alberta, Canada during my time at ConocoPhillips. We spent an afternoon examining core and seismic data, and speculating about counter-point-bars, a specialty of his. He was an intuitive sedimentologist whose contributions will be remembered for many years.

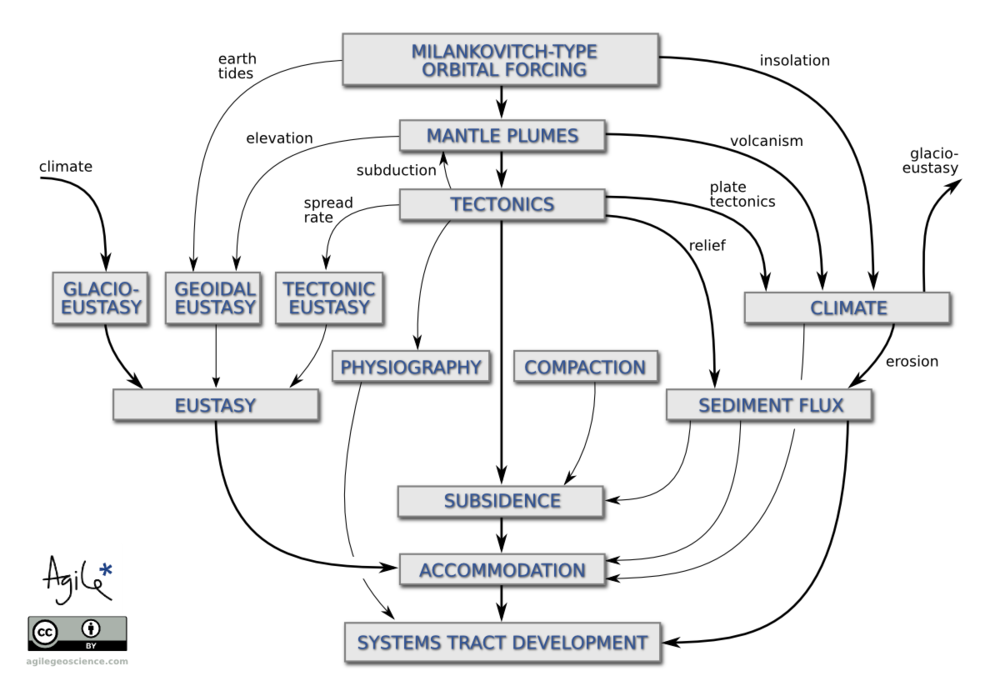
Another geological Smith is being celebrated in September at the Geological Society of London's annual William Smith Meeting. The topic this year is The Future of Sequence Stratigraphy: Evolution or Revolution? Honestly, my first thought was "hasn't that conversation been going on since 1994?", but on closer inspection, it promises to be an interesting two days on 'source-to-sink', 'landscape into rock', and some other recent ideas.

The issue of patents reared up in June when Elon Musk of Tesla Motors announced the relaxation of their patents — essentially a promise not to sue anyone using one of their patented technology. He realizes that a world where lots of companies make electric vehicles is better for Tesla. I wrote a piece about patents in our industry.

Technology roundup

A few things that caught our eye online:

Last thing: did you know that the unit of acoustic impedance is the Rayl? Me neither. 


Previous linkfests: AprilJanuaryOctober.

The figure is from Smith et al. (2009), Stratigraphy of counter-point-bar and eddy accretion deposits in low-energy meander belts of the Peace–Athabasca delta, northeast Alberta, Canada. In: SEPM Special Publication No. 97, ISBN 978-1-56576-305-0, p. 143–152. It is copyright of SEPM, and used here in accordance with their terms.

More AAPG highlights

Here are some of our highlights from the second half of the AAPG Annual Convention in Houston.

Conceptual uncertainty in interpretation

Fold-thrust belt, offshore Nigeria. Virtual Seismic Atlas.Rob Butler's research is concerned with the kinematic evolution of mountain ranges and fold thrust belts in order to understand the localization of deformation across many scales. Patterns of deformed rocks aren't adequately explained by stress fields alone; they are also controlled by the mechancial properties of the layers themselves. Given this fact, the definition of the layers becomes a doubly important part of the interpretation.

The biggest risk in structural interpretation is not geometrical accuracy but whether or not the concept is correct. This is not to say that we don't understand geologic processes. Rather, a section can always be described in more than one way. It is this risk in the first order model that impacts everything we do. To deal with conceptual uncertainty we must first capture the range, otherwise it is useless to do any more refinement. 

He showed a crowd-sourced compiliation of 24 interpretations from the Virtual Seismic Atlas as a way to stack up a series of possible structural frameworks. Fifteen out of twenty-four interviewees interpreted a continuous, forward-propagating thrust fault as the main structure. The disagreements were around the existence and location of a back thrust, linkage between fore- and back-thrusts, the existence and location of a detachment surface, and its linkage to the fault planes above. Given such complexity, "it's rather daft," he said, "to get an interpretation from only one or two people." 

CT scanning gravity flows

Mike Tilston and Bill Arnott gave a pair of talks about their research into sediment gravity flows in the lab. This wouldn't be newsworthy in itself, but their 2 key innovations caught our attention: 

  1. A 3D velocity profiler capable of making 23 measurements a second
  2. The flume tank ran through a CT scanner, giving a hi-res cross-section view

These two methods sidestep the two major problems with even low-density (say 4% by weight) sediment gravity flows: they are acoustically attenuative, and optically opaque. Using this approach Tilston and Arnott investigated the effect of grain size on the internal grain distribution, finding that fine-grained turbidity currents sustain a plug-like wall of sediment, while coarse-grained flows have a more carpet-like distribution. Next, they plan to look at particle shape effects, finer grain sizes, and grain mixtures. Technology for the win!

Hypothesizing a martian ocean

Lorena Moscardelli showed topograhic renderings of the Eberswalde delta (right) on the planet Mars, hypothesizing that some martian sedimentary rocks have been deposited by fluvial processes. An assertion that posits the red planet with a watery past. If there are sedimentary rocks formed by fluids, one of the fluids could have been water. If there has been water, who knows what else? Hydrocarbons? Imagine that! Her talk was in the afternoon session on Space and Energy Frontiers, sandwiched by less scientific speakers raising issues for staking claims and models for governing mineral and energy resources away from earth. The idea of tweaking earthly policies and state regulations to manage resources on other planets, somehow doesn't align with my vision of an advanced civilization. But the idea of doing seismic on other planets? So cool.

Poster gorgeousness

Matt and I were both invigorated by the quality, not to mention the giant size, of the posters at the back of the exhibition hall. It was a place for the hardcore geoscientists to retreat from the bright lights, uniformed sales reps, and the my-carpet-is-cushier-than-your-carpet marketing festival. An oasis of authentic geoscience and applied research.

We both finally got to meet Brian Romans, a sedimentologist at Virginia Tech, amidst the poster-paneled walls. He said that this is his 10th year venturing to the channel deposits that crop out in the Magallanes Basin of southern Chile. He is now one of the three young, energetic profs behind the hugely popular Chile Slope Systems consortium.

Three years ago he joined forces with Lisa Stright (University of Utah), and Steve Hubbard (University of Calgary) and formed the project investigating processes of sediment transfer across deepwater slopes exposed around Patagonia. It is a powerhouse of collaborative research, and the quality of graduate student work being pumped out is fantastic. Purposeful and intentional investigations carried out by passionate and tech-savvy scientists. What can be more exciting than that?

Do you have any highlights of your own? Please leave a note in the comments.

The core of the conference

Andrew Couch of Statoil answering questions about his oil sands core, standing in front of a tiny fraction of the core collection at the ERCBToday at the CSPG CSEG CWLS convention was day 1 of the core conference. This (unique?) event is always well attended and much talked-about. The beautiful sunshine and industry-sponsored lunch today helped (thanks Weatherford!).

One reason for the good turn-out is the incredible core research facility here in Calgary. This is the core and cuttings storage warehouse and lab of the Energy Resources Conservation Board, Alberta's energy regulator. I haven't been to a huge number of core stores around the world, but this is easily the largest, cleanest, and most efficient one I have visited. The picture gives no real indication of the scale: there are over 1700 km of core here, and cuttings from about 80 000 km of drilling. If you're in Calgary and you've never been, find a way to visit. 

Ross Kukulski of the University of Calgary is one of Stephen Hubbard's current MSc students. Steve's students are consistently high performers, with excellent communication and drafting skills; you can usually spot their posters from a distance. Ross is no exception: his poster on the stratigraphic architecture of the Early Cretaceous Monach Formation of NW Alberta was a gem. Ross has integrated data from about 30 cores, 3300 (!) well logs, and outcrop around Grand Cache. While this is a fairly normal project for Alberta, I was impressed with the strong quantitative elements: his provenance assertions were backed up with Keegan Raines' zircon data, and channel width interpretation was underpinned by Bridge & Tye's empirical work (2000; AAPG Bulletin 84).

The point bar in Willapa Bay where Jesse did his coring. Image from Google Earth. Jesse Schoengut is a MSc student of Murray Gingras, part of the ichnology powerhouse at the University of Alberta. The work is an extension of Murray's long-lived project in Willapa Bay, Washington, USA. Not only had the team collected vibracore along a large point bar, but they had x-rayed these cores, collected seismic profiles across the tidal channel, and integrated everything into the regional dataset of more cores and profiles. The resulting three-dimensional earth model is helping solve problems in fields like the super-giant Athabasca bitumen field of northeast Alberta, where the McMurray Formation is widely interpreted to be a tidal estuary somewhat analogous to Willapa. 

Greg Hu of Tarcore presented his niche business of photographing bitumen core, and applying image processing techniques to complement and enhance traditional core descriptions and analysis. Greg explained that unrecovered core and incomplete sampling programs result in gaps and depth misalignment—a 9 m core barrel can have up to several metres of lost core which can make integrating core information with other subsurface information intractable. To help solve this problem, much of Tarcore's work is depth-correcting images. He uses electrical logs and FMI images to set local datums on centimetre-scale beds, mud clasts, and siderite nodules. Through color balancing, contrast stretching, and image analysis, shale volume (a key parameter in reservoir evaluation) can be computed from photographs. This approach is mostly independent of logs and offers much higher resolution.

It's awesome how petroleum geologists are sharing so openly at this core workshop, and it got us thinking: what would a similar arena look like for geophysics or petrophysics? Imagine wandering through a maze of 3D seismic volumes, where you can touch, feel, ask, and learn.

Don't miss our posts from day 1 of the convention, and from days 2 and 3.

What changes sea-level?

Relative sea-level is complicated. It is measured from some fixed point in the sediment pile, not a fixed point in the earth. So if, for example, global sea-level (eustasy) stays constant but there is local subsidence at a fault, say, then we can say that relative sea-level has increased. Another common cause is isostatic rebound during interglacials, causing a fall in relative sea-level and a seaward regression of the coastline. Because the system didn't build out into the sea by itself, this is sometimes called a forced regression. Here's a nice example of a raised beach formed this way, from Langerstone Point, near Prawle in Devon, UK:

Image: Tony Atkin, licensed under CC-BY-SA-2.0. From Wikimedia Commons

Two weeks ago I wrote about some of the factors affecting relative sea-level, and the scales on which those processes operate. Before that, I had mentioned my undergraduate fascination with Milankovitch cyclicity and its influence on a range of geological processes. Complexity and interaction were favourite subjects of mine, and I built on this a bit in my graduate studies. To try to visualize some of the connectedness of the controls on sea-level, I drew a geophantasmagram that I still refer to occasionally:

Accommodation refers to the underwater space available for sediment deposition; it is closely related to relative sea-level. The end of the story, at least as far as gross stratigraphy is concerned, is the development of stratigraphic package, like a shelf-edge delta or a submarine fan. Systems tracts is just a jargon term for these packages when they are explicitly related to changes in relative sea-level. 

I am drawn to making diagrams like this; I like mind-maps and other network-like graphs. They help me think about complex systems. But I'm not sure they always help anyone other than the creator; I know I find others' efforts harder to read than my own. But if you have suggestions or improvements to offer, I'd love to hear from you.

What is shale?

Until four or five years ago, it was enough just to know that shale is that dark grey stuff in between the sands. Being overly fascinated with shale was regarded as a little, well, unconventional. To be sure, seals and source rocks were interesting and sometimes critical, but always took a back seat to reservoir characterization.

Well, now the shale is the reservoir. So how do we characterize shale? We might start by asking: what is shale, really? Is it enough to say, "I don't know, but I know it when I see it"? No: sometimes you need to know what to call something, because it affects how it is perceived, explored for, developed, and even regulated.

Alberta government

Section 1.020(2)(27.1) of the Oil and Gas Conservation Regulations defines shale:

a lithostratigraphic unit having less than 50% by weight organic matter, with less than 10% of the sedimentary clasts having a grain size greater than 62.5 micrometres and more than 10% of the sedimentary clasts having a grain size less than 4 micrometres.
ERCB Bulletin 2009-23

This definition seems quite strict, but it open to interpretation. 'Ten percent of the sedimentary clasts' might be a very small volumetric component of the rock, much less than 10%, if those 'clasts' are small enough. I am sure they meant to write '...10% of the bulk rock volume comprising clasts having a grain size...'.

Read More

Ripples

Yesterday I visited Sand Dollar Beach, near Lunenburg, with the kids. There's lots of room to run around: the beach has a 400 m wide foreshore, which means lots of shallow water at high tide (as in the Google Maps picture here). The low angle (less than half a degree) also sees the tide go in and out very quickly, allowing little time for reworking the delicate ripples. Their preservation is further helped by the fact that the waves along this sheltered coast are typically low-amplitude.


View Larger Map

At the edge of the just-visible stream cutting through the beach, the regular wave ripples, produced by oscillating currents, morph into more chaotic linguiod current ripples (right-hand side, mostly obscured by the stream). I can't say for sure, but the pattern may have been modified by animal tracks (deer, dog, dude?) during some previous low tide.

As I posted before, I am interested in the persistence of patterns across scales and even processes. For instance, this view (right) reminded me of blogger Silver Fox's recent post about the Basin and Range caterpillar army. An entirely different process: parallel morpholution.

If you look closely at the Google Map, above, you can see dim duneforms in the shallows, as a series of sub-parallel dark stripes. They echo the ripples in orientation and process, but have a wavelength of about 30 m. If you can't see them maybe this annotated version will help.

I would not claim to be an expert in the feeding traces of invertebrates, but I love taking pictures of them. I think the animals grazing in the cusps of these ripples were Chiridotea coeca, a tiny crustacean. You can read (a lot) more about them in Hauck et al (2008), Palaios 23, 336–343. According to these authors, such trails may be modern analogs of a rather common trace fossil called Nereites