x lines of Python: read and write SEG-Y

Reading SEG-Y files comes up a lot in the geophysicist's workflow. Writing, less often, but it does come up occasionally. As long as we're mostly concerned with trace data and not location, both of these tasks can be fairly easily accomplished with ObsPy. 

Today we'll load some seismic, compute an attribute on it, and save a new SEG-Y, in 10 lines of Python.


ObsPy is a rare thing. It demonstrates what a research group can accomplish with a little planning and a lot of perseverance (cf my whinging earlier this year about certain consortiums in our field). It's an open source Python package from the geophysicists at the University of Munich — Karl Bernhard Zoeppritz studied there for a while, so you know it's legit. The tool serves their research in earthquake and global seismology needs, and also happens to handle SEG-Y files quite nicely.

Aside: I think SixtyNorth's segpy is actually the way to go for reading and writing SEG-Y; ObsPy is probably overkill for most applications — it's about 80 times the size for one thing. I just happen to be familiar with it and it's super easy to install: conda install obspy. So, since minimalism is kind of the point here, look out for a future x lines of Python using that library.

The sentences

As before, we'd like to express the process in just a few sentences of plain English. Assuming we just want to read the data into a NumPy array, look at it, do something to it, and write a new file, here's what we're doing:

  1. Read (or really index) the file as an ObsPy Stream object.
  2. Stack (in the NumPy sense) the Trace objects into a single NumPy array. We have data!
  3. Get the 99th percentile of the amplitudes to make plotting easier.
  4. Plot the data so we can see it.
  5. Get the sample interval of the data from a trace header.
  6. Compute the similarity attribute using our library bruges.
  7. Make a new Stream object to hold the outbound data.
  8. Add a Stats object, which holds the header, and recycle some header info.
  9. Append info about our data to the header.
  10. Write a new SEG-Y file with our computed data in it!

There's a bit more in the Jupyter Notebook (examining the file and trace headers, for example, and a few more plots) which, remember, you can run right in your browser! You don't need to install a thing. Please give it a look! Quick tip: Just keep hitting Shift+Enter to run the cells.

If you like this sort of thing, and are planning to be at the SEG Annual Meeting in Dallas next month, you might like to know that we'll be teaching our Creative Geocomputing class there. It's basically two days of this sort of thing, only with friends to learn with and us to help. Come and learn some new skills!

The seismic data used in this post is from the NPRA seismic repository of the USGS. The data is in the public domain.

x lines of Python: synthetic wedge model

Welcome to a new blog series! Like the A to Z and the Great Geophysicists, I expect it will be sporadic and unpredictable, but I know you enjoys life's little nonlinearities as much as I.

The idea with this one — x lines of Python — is to share small geoscience workflows in x lines or fewer. I'm not sure about the value of x, but I think 10 seems reasonable for most tasks. If x > 10 then the task may have been too big... If x < 5 then it was probably too small.

Python developer Raymond Hettinger says that each line of code should be equivalent to a sentence... so let's say that that's the measure of what's OK to put in a single line. 

Synthetic wedge model

To kick things off, follow this link to a live Jupyter Notebook environment showing how you can make a simple synthetic three-rock wedge model in only 9 lines of code.

The sentences represented by the code that made the data in these images are:

  1. Set up the size of the model.
  2. Make the slanty bit, with 1's in the wedge and 2's in the base.
  3. Add the top of the model as 0; these numbers will turn into rocks.
  4. Define the velocity and density of rocks 0 to 2.
  5. Distribute those properties through the model.
  6. Calculate the acoustic impedance everywhere.
  7. Calculate the reflection coefficients in the model.
  8. Make a Ricker wavelet.
  9. Convolve the wavelet with the reflection coefficients.

Your turn!

All of the notebooks we share in this series will be hosted on mybinder.org. I'm excited about this because it means you can run and edit them live, without installing anything at all. Give it a go right now.

You can see them on GitHub too, and fork or clone them from there. Note that if you look at the notebook for this post on GitHub, you'll be able to view it, but not change or run code unless you get everything running on your own machine. (To do that, you can more or less follow the instructions in my User Guide to the TLE tutorials).

Please do take this notion of x as 'par' as a challenge. If you'd like to try to shoot under par, please do — and share your efforts. Code golf is a fun way to learn better coding habits. (And maybe some bad ones.) There is a good chance I will shoot some bogies on this course.

We will certainly take requests too — what tasks would you like to see in x lines of Python?

What's that funny noise?

Seismic reflections are strange noises. Around 50 Hz, narrow band, very quiet, and difficult to interpret. It is possible to convert seismic traces (active or passive) into audible sound with a shift in pitch and a time stretch.

Made by the legendary Emory Cook, who recorded everything from steel bands to racing cars to ionospheric noises to this treatment of Hugo Benioff's earthquake recordings. Epic.

Curiously the audification thing has never really caught on in exploration geophysics — a bit surprising, given the fascination with spectral decomposition over the last 15 years or so. And especially so when you consider that our hearing has a dynamic range of about 100 dB, which is comparable to, indeed slightly greater than, our vision (about 90 dB).

Paolo Dell'Aversana of ENI wants to change that. Rather than listening to 'raw' seismic, he's sending it to a MIDI interface and listening to it as a piano roll. Just try to imagine playing seismic on a piano for a second, then listen to his weird and wonderful results — at 9:45 in this EAGE video:

In this EAGE E-Lecture Paolo Dell'Aversana discusses how digital music technology can support geophysical data analysis and interpretation. If you've read any of Dell'Aversana's articles, you'll know he has one of the most creative minds in exploration geophysics. Skip to 9:45 for the crazy seismic piano roll.

On the subject of weird sounds, one of my favourite Wikipedia pages is List of unexplained sounds. I especially love the eerie recordings of mysterious underwater noises, like this one called Upsweep:

Upsweep
National Oceanic Atmospheric Administration

No-one knows what makes that noise! My money's on a volcanic vent, but that doesn't explain the seasonality. Maybe we should do a hackathon on these unexaplained sounds some time. If you know of any others — I'd love tohear about them.


If you enjoy strange infrasound as much as I do, I recommend following these two scientists on Twitter:


If you really like strange noises, don't forget to check out the Undersampled Radio podcast!

Hooke's oolite

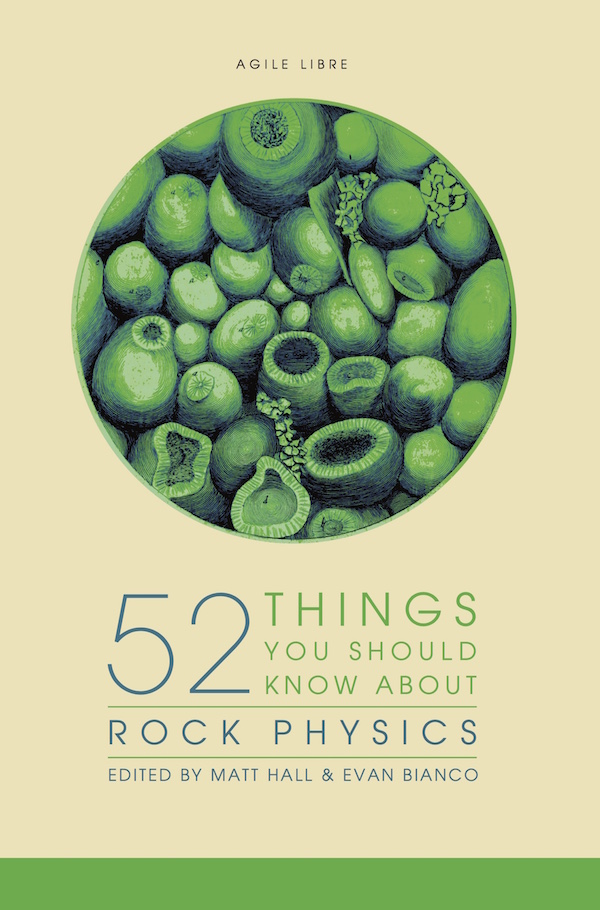
52 Things You Should Know About Rock Physics came out last week. For the first, and possibly the last, time a Fellow of the Royal Society — the most exclusive science club in the UK — drew the picture on the cover. The 353-year-old drawing was made by none other than Robert Hooke

The title page from Micrographia, and part of the dedication to Charles II. You can browse the entire book at archive.org.

The title page from Micrographia, and part of the dedication to Charles II. You can browse the entire book at archive.org.

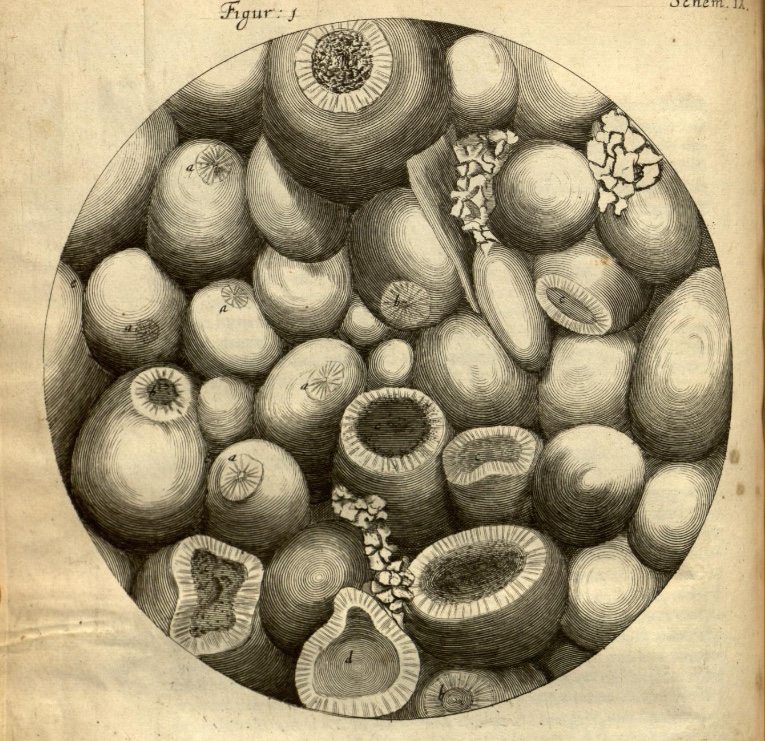
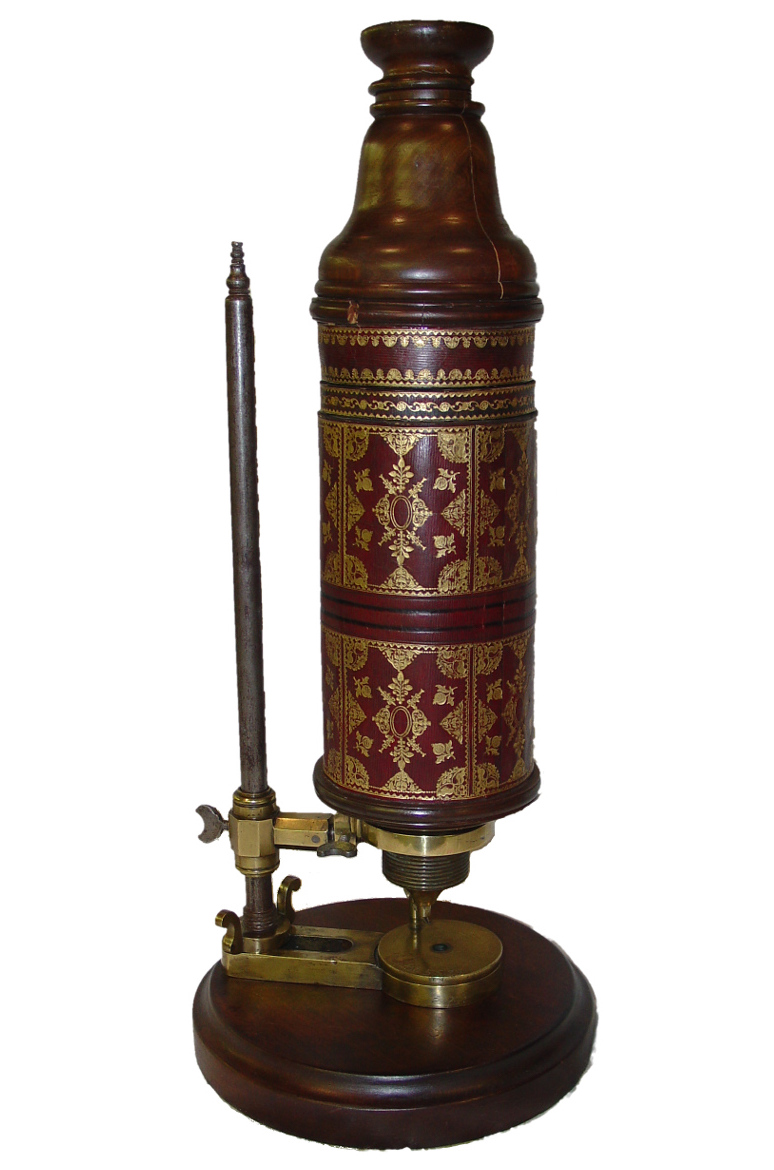
The drawing, or rather the engraving that was made from it, appears on page 92 of Micrographia, Hooke's groundbreaking 1665 work on microscopy. In between discovering and publishing his eponymous law of elasticity (which Evan wrote about in connection with Lamé's \(\lambda\)), he drew and wrote about his observations of a huge range of natural specimens under the microscope. It was the first time anyone had recorded such things, and it was years before its accuracy and detail were surpassed. The book established the science of microscopy, and also coined the word cell, in its biological context.

Sadly, the original drawing, along with every other drawing but one from the volume, was lost in the Great Fire of London, 350 years ago almost to the day. 

Ketton stone

The drawing on the cover of the new book is of the fractured surface of Ketton stone, a Middle Jurassic oolite from central England. Hooke's own description of the rock, which he mistakenly called Kettering Stone, is rather wonderful:

I wonder if anyone else has ever described oolite as looking like the ovary of a herring?

These thoughtful descriptions, revealing a profundly learned scientist, hint at why Hooke has been called 'England's Leonardo'. It seems likely that he came by the stone via his interest in architecture, and especially through his friendsip with Christopher Wren. By 1663, when it's likely Hooke made his observations, Wren had used the stone in the façades of several Cambridge colleges, including the chapels of Pembroke and Emmanuel, and the Wren Library at Trinity (shown here). Masons call porous, isotropic rock like Ketton stone 'freestone', because they can carve it freely to make ornate designs. Rock physics in action!

You can read more about Hooke's oolite, and the geological significance of his observations, in an excellent short paper by material scientist Derek Hull (1997). It includes these images of Ketton stone, for comparison with Hooke's drawing:

Reflected light photomicrograph (left) and backscatter scanning electron microscope image (right) of Ketton Stone. Adapted from figures 2 and 3 of Hull (1997). Images are © Royal Society and used in accordance with their terms.

Reflected light photomicrograph (left) and backscatter scanning electron microscope image (right) of Ketton Stone. Adapted from figures 2 and 3 of Hull (1997). Images are © Royal Society and used in accordance with their terms.

I love that this book, which is mostly about the elastic behaviour of rocks, bears an illustration by the man that first described elasticity. Better still, the illustration is of a fractured rock — making it the perfect preface. 


References

Hall, M & E Bianco (eds.) (2016). 52 Things You Should Know About Rock Physics. Nova Scotia: Agile Libre, 134 pp.

Hooke, R (1665). Micrographia: or some Physiological Descriptions of Minute Bodies made by Magnifying Glasses, pp. 93–100. The Royal Society, London, 1665.

Hull, D (1997). Robert Hooke: A fractographic study of Kettering-stone. Notes and Records of the Royal Society of London 51, p 45-55. DOI: 10.1098/rsnr.1997.0005.

52 Things... Rock Physics

There's a new book in the 52 Things family! 

52 Things You Should Know About Rock Physics is out today, and available for purchase at Amazon.com. It will appear in their European stores in the next day or two, and in Canada... well, soon. If you can't wait for that, you can buy the book immediately direct from the printer by following this link.

The book mines the same vein as the previous volumes. In some ways, it's a volume 2 of the original 52 Things... Geophysics book, just a little bit more quantitative. It features a few of the same authors — Sven Treitel, Brian Russell, Rachel Newrick, Per Avseth, and Rob Simm — but most of the 46 authors are new to the project. Here are some of the first-timers' essays:

  • Ludmilla Adam, Why echoes fade.
  • Arthur Cheng, How to catch a shear wave.
  • Peter Duncan, Mapping fractures.
  • Paul Johnson, The astonishing case of non-linear elasticity.
  • Chris Liner, Negative Q.
  • Chris Skelt, Five questions to ask the petrophysicist.

It's our best collection of essays yet. We're very proud of the authors and the collection they've created. It stretches from childhood stories to linear algebra, and from the microscope to seismic data. There's no technical book like it. 

Supporting Geoscientists Without Borders

Purchasing the book will not only bring you profund insights into rock physics — there's more! Every sale sends $2 to Geoscientists Without Borders, the SEG charity that supports the humanitarian application of geoscience in places that need it. Read more about their important work.

It's been an extra big effort to get this book out. The project was completely derailed in 2015, as we — like everyone else — struggled with some existential questions. But we jumped back into it earlier this year, and Kara (the managing editor, and my wife) worked her magic. She loves working with the authors on proofs and so on, but she doesn't want to see any more equations for a while.

If you choose to buy the book, I hope you enjoy it. If you enjoy it, I hope you share it. If you want to share it with a lot of people, get in touch — we can help. Like the other books, the content is open access — so you are free to share and re-use it as you wish.