Thin-bed vowels and heterolithic consonants
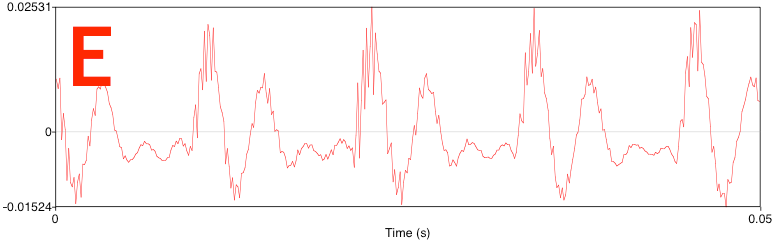
Seismologists see the world differently. Or, rather, they hear the world differently. Sounds become time series, musical notes become Fourier components. The notes we make with our vocal chords come from the so-called sonorants, especially the vowel sounds, and they look like this:

Consontants aren't as pretty, consisting of various obstruents like plosives and fricatives—these depend on turbulence, and don't involve the vocal chords. They look very different:

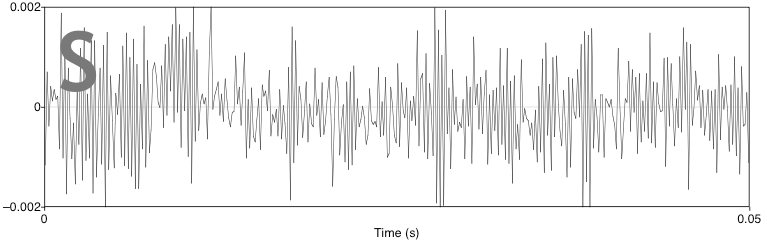
Geophysicists will recognize these two time series as being signal-dominated and noise-dominated, respectively. The signal in the vowel sound is highly periodic: a small segment about 12 ms long is repeated four times in this plot. There is no repeating signal in the consonant sound: it is more or less white noise.

When quantitative people hear the word periodic, their first thought is usually Fourier transform. Like a prism, the Fourier transform unpacks mixed signals into monotones, making them easier to examine and explain. For instance, the Fourier transform of a set of limestone beds might reveal the Milankovitch cycles of which I am so fond. What about S and E?

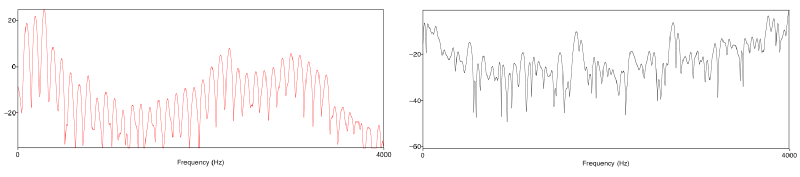
The spectrum of the consonant S is not very organized and close to being random. But the E sound has an interesting shape. It's quite smooth and has obvious repetitive notches. Any geophysicist who has worked with spectral decomposition—a technique for investigating thin beds—will recognize these. For example, compare the spectrums for a random set of reflection coefficients (what we might call background geology) and a single thin bed, 10 ms thick:

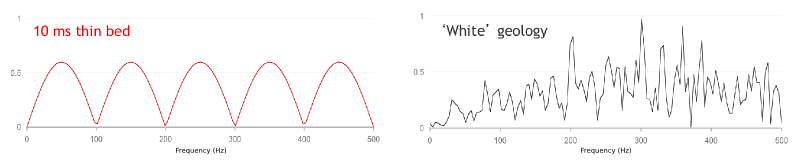
Notches! The beauty of this, from an interpreter's point of view, is that one can deduce the thickness of the thin-bed giving rise to this notchy spectrum. The thickness is simply 1/n, where n is the notch spacing, 100 Hz in this case. So the thickness is 1/100 = 0.01 s = 10 ms. We can easily compute the spectrum of seismic data, so this is potentially powerful.

While obvious here, in a complicated spectrum the notches might be hard to detect and thus measure. But the notches are periodic. And what do we use to find periodic signals? The Fourier transform! So what happens if we take the spectrum of the spectrum of my voice signal—where we saw a 12 ms repeating pattern?

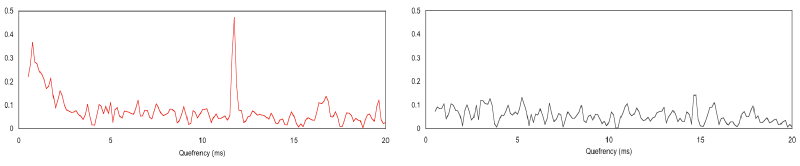
There's the 12 ms periodic signal from the time series! 

The spectrum of the spectrum is called the cepstrum (pronounced, and sometimes spelled, kepstrum). We have been transported from the frequency domain to a new universe: the quefrency domain. We are back with units of time, but there are other features of the cepstral world that make it quite different from the time domain. I'll discuss those in a future post. 

Based on a poster paper I presented at the 2005 EAGE Conference & Exhibition in Madrid, Spain, and on a follow-up article Hall, M (2006), Predicting bed thickness with cepstral decomposition, The Leading Edge, February 2006, doi:10.1190/1.2172313

News of the week

Help us stay on top of the latest and greatest: if you hear about something that might make geophysics even awesomer for all of us, drop us a line! In the meantime, here's some news that caught our attention...

Free software goodness

Innovative Australian software shop DownUnder GeoSolutions, aka DUG, is now offering DUG Insight to students for free! As if one amazing free (as in beer) seismic visualization and interpretation tool wasn't enough—you do have OpendTect, right?—now there's another. Just email them a copy of your student ID, and they'll get you started. 

NEWSFLASH  Hard-up students might also like this: Nature Geoscience for $10 a year! 

S-ray vision

OK, it doesn't sound quite as cool as X-ray vision, but S-band microwaves really can see through walls. Sort of. Boffins at MIT demonstrate their claims in this video... it's not geophysics, but another hard inverse imaging problem.

Petrophysics for Dummies

Occasionally while wandering lost in the interweb you stumble on gold. This is gold. Graham Davies was a geoscientist at Enterprise Oil, the plucky British independent exploration company I did my first internship at. He's been recording petrophysics tutorials, and they're 100% brilliant. "Even if you've never heard of petrophysics before," claims Davis.

What the heck is the geoblogosphere?

Not really a geotechnical story, but some readers might be interested to know more about geoscience blogs. A recent research paper, Geißler et al 2011, is a good place to start. The authors, who include übergeoblogger Callan Bentley of the structural geology blog Mountain Beltway, do a terrific job of exploraing the reasons for blogging, the perceptions of employers and supervisors, and every other angle you can think of. 

NEWSFLASH The 315th Where on (Google) Earth geomorphological puzzle went unsolved for 11 days, but was finally solved this morning. Congratulations to Ron Schott, the next episode is yours to host.

This regular news feature is for information only. We aren't connected with any of these people or organizations, and don't necessarily endorse their products or services. 

McKelvey's reserves and resources

Vincent McKelvey (right) was chief geologist at the US Geological Survey, and then its director from 1971 until 1977. Rather like Sherman Kent at the CIA, who I wrote about last week, one of his battles was against ambiguity in communication. But rather than worrying about the threat posed by the Soviet Union or North Korea, his concern was the reporting of natural resources in the subsurface of the earth. Today McKelvey's name is associated with a simple device for visualizing levels of uncertainty and risk associated with mineral resources: the McKelvey box.

Here (left) is a modernized version. It helps unravel some oft-heard jargon. The basic idea is that only discovered, commercially-viable deposits get to be called Reserves. Discovered but sub-commercial (with today's technology and pricing) are contingent resources. Potentially producible and viable deposits that we've not yet found are called prospective resources. These are important distinctions, especially if you are a public company or a government.

Over time, this device has been reorganized and subdivided with ever more subtle distinctions and definitions. I was uninspired by the slightly fuzzy graphics in the ongoing multi-part review of reserve reporting in the CSPG Reservoir magazine (Yeo and Derochie, 2011, Reserves and resources series, CSPG Reservoir, starting August 2011). So I decided to draw my own version. To reflect the possiblity that there may yet be undreamt-of plays out there, I added a category for Unimagined resources. One for the dreamers.

You can find the Scalable Vector Graphics file for this figure in SubSurfWiki. If you have ideas about other jargon to add, or ways to represent the uncertainty, please have a go at editing the wiki page, the figure, or drop us a line!

Are you a poet or a mathematician?

Woolly ramsMany geologists can sometimes be rather prone to a little woolliness in their language. Perhaps because you cannot prove anything in geology (prove me wrong), or because everything we do is doused in interpretation, opinion and even bias, we like to beat about the bush. A lot.

Sometimes this doesn't matter much. We're just sparing our future self from a guilty binge of word-eating, and everyone understands what we mean—no harm done. But there are occasions when a measure of unambiguous precision is called for. When we might want to be careful about the technical meanings of words like approximately, significant, and certain.

Sherman Kent was a CIA analyst in the Cold War, and he tasked himself with bringing quantitative rigour to the language of intelligence reports. He struggled (and eventually failed), meeting what he called aesthetic opposition:

Sherman Kent portraitWhat slowed me up in the first instance was the firm and reasoned resistance of some of my colleagues. Quite figuratively I am going to call them the poets—as opposed to the mathematicians—in my circle of associates, and if the term conveys a modicum of disapprobation on my part, that is what I want it to do. Their attitude toward the problem of communication seems to be fundamentally defeatist. They appear to believe the most a writer can achieve when working in a speculative area of human affairs is communication in only the broadest general sense. If he gets the wrong message across or no message at all—well, that is life.

Sherman Kent, Words of Estimative Probability, CIA Studies in Intelligence, Fall 1964

Words of estimative probabilityKent proposed using some specific words to convey specific levels of certainty (right). We have used these words in our mobile app Risk*. The only modification I made was setting P = 0.99 for Certain, and P = 0.01 for Impossible (see my remark about proving things in geology).

There are other schemes. Most petroleum geologists know Peter Rose's work. A common language, with some quantitative meaning, can dull the pain of prospect risking sessions. Almost certainly. Probably.

Do you use systematic descriptions of uncertainty? Do you think they help? How can we balance our poetic side of geology with the mathematical?

Where on (Google) Earth #315

After a long break from this awesome game, I got WoGE #314 by simple recognition. I've never been to Florida, but have scoured the whole region looking for interesting modern analogs. So I have the honour of turning in the next edition; the time is 1100 ADT, 1400 GMT, or 44-07-07 ∇ 14:19:14 Lunar Standard Time. In case you're on the moon.

Where on (Google) Earth is the best way to tour the virtual globe since the mighty View-Master. If you are new to the game, fear not, it is easy to play. The winner is the first person to examine the picture below, find the location (name, link, or lat-long), and give a brief explanation of its geological interest. Please post your answer in the comments. And thanks to the Schott Rule, which I am invoking, newbies have a slight edge: previous winners must wait one earth hour for each win before playing—with a maximum of 48 (yes, some people are quite good at this game).

So: where and what the Dickens is this?

News of the week

Some news and views from the world of geoscience this last fortnight.

Open source GIS on a thumb drive

If you ever wanted to get into open source geospatial software but didn't know where to start, check this out. Last month OSGeo, the open source geospatial foundation, released version 5 of their OSGeo-Live project. This is a bootable disk image containing 47 pieces of free software, including several full GIS, world maps, and quick-start guides. Amazing!

Probability and panic

The L'Aquila earthquake of April 2009 killed 308 people. Six seismologists are now on trial for manslaughter, not so much because they failed to predict the quake, but because they allegedly downplayed the risk of a severe event. Most geoscientists believe that we cannot predict earthquakes today; these seismologists are effectively accused of trying to predict a non-earthquake. We don't know, but suspect their intent was misinterpreted—always a danger when specialists communicate with non-specialists. There is no daily coverage of the trial that we are aware of, but there are occasional reports in the press. In this short video, Giustino Parisse explains why he is one of the plaintiffs.

Magical geobloggery

If you're new to blogs—maybe you got a tablet recently and are discovering how easy it is to read the web these days—you might not be aware that there's a lot of geology in the blogosphere. Finding writers you want to read isn't easy though. You could scroll down this page and look for our BLOGROLL for some leads, or head over to Highly Allochthonous and read the latest Accretionary Wedge, a regular meta-post. This month: practical advice for the lifelong learner. 

Communicating rocks

We recently learned of this terrific new book from University of Houston professor Peter Copeland (thanks to his colleague, Rob Stewart, for the tip!). We haven't actually got our hands on it yet, but the Amazon preview has whet our appetites for geo-communication tips galore. The publisher, Prentice Hall, has kept the price to a reasonable amount, close to $35. Get your copy now!

This regular news feature is for information only. We aren't connected with any of these organizations, and don't necessarily endorse their products or services. Public domain map image from the USGS. 

Reuse and recycle

I have recently started teaching an undergraduate course at Dalhousie University in Halifax. The regular professor is on sabbatical, so this is a part-time gig, and a one-off. It's hard work, and shockingly poorly paid, but a lot of fun; I'm fortunate to have a fairly small group of bright, motivated students. 

One of the things that's surprised me is how little decent-quality and openly-licensed material there is on the internet for teaching technical courses like this. I can find images as well as the next person, and 'fair use' is acceptable for teaching I suppose, but often I'm left with a low-resolution image that doesn't quite show what I want. Thus I'm creating a lot of stuff from scratch, which is fine because I enjoy it, but it's time-consuming and, besides, I may never teach this course again.

So... I am uploading the drawings I make to SubSurfWiki.org, where you can find and download them, and use or abuse them for whatever you like without permission (they are all licensed CC-BY so you only have to give attribution). They are in Scalable Vector Graphics format, so you can edit them with a vector graphics tool like Inkscape or Adobe Illustrator. 

Note: There are some issues with displaying SVG files in some browsers. They sometimes look weird or even broken. You should be able to download the files and use them in a vector graphics tool without any trouble. The only other option is to use the Portable Network Graphics files instead, as I often upload those too; look for the same name, with a PNG extension. 

The cratering hypothesis

A few years ago, I was interpreting the Devonian of northern Alberta in a beautiful 3D seismic reflection survey. Because the target zone was rather shallow, we had acquired a dataset with a very high trace density: a lot of spatial samples. This gave us a lot of detail in timeslices, even if the vertical section views weren't particularly high resolution in these deeper, high velocity sediments of the shallow Givetian carbonate seas.

A circular feature caught my eye. Unfortunately I can't show it to you because the data are proprietary, but it was quite conspicuous and impossible to ignore: perfectly round, about 1.5 km across, and with a central mound a couple of hundred metres in diameter. I showed it to a few people and everyone said, 'yeah, impact crater'. Or maybe I just always heard 'impact crater'. 

I really wanted it to be an impact crater. Bias number 1. 

My first action was to re-read one of my favourite papers ever: Simon Stewart's 1999 paper on circular geological features. I love papers like this: basic, practical advice for interpreters. His figure 1 (left) is a lovely graphic. Stewart himself is rather enamoured with impact structures—he was the 'for' advocate in the recent debate over the Silverpit structure in the North Sea. You can read some more about it here and here

The paper gives some equations which compute the probability that, given some assumptions about meteorite flux and so forth, a bolide has cratered right where you are standing at some point in geological history. I built this little Wolfram|Alpha Widget so you can try them yourself (need help?). Of course, this is far from the same thing as there being a crater preserved, or visible in seismic, but it's a start. Bias number 2: Numbers, even dubious ones, look like evidence.

I admit it, I got carried away. Bias number 3.

But then... we shot another survey. There turned out to be another crater. And then another. My biases weren't enough—new craters finished it. According to those equations, the probability of having one in a 600 km2 survey spanning 200 Ma of preservable time is 0.14, a 14% chance. Pretty good. But the probability of two is 0.012, and three is 0.0007. And these were contemporaneous. And, just as with Silverpit, there was salt. 

It should have been obvious all along. (Bias number 4.)

Reference
Stewart, S (1999). Seismic interpretation of circular geological structures. Petroleum Geoscience 5, p 273–285. DOI: 10.1144/petgeo.5.3.273

Image from Stewart 1999 is copyright of the Geological Society of London and the European Association of Geoscientists and Engineers, and is used here with permission and with thanks.