Lusi's 8th birthday

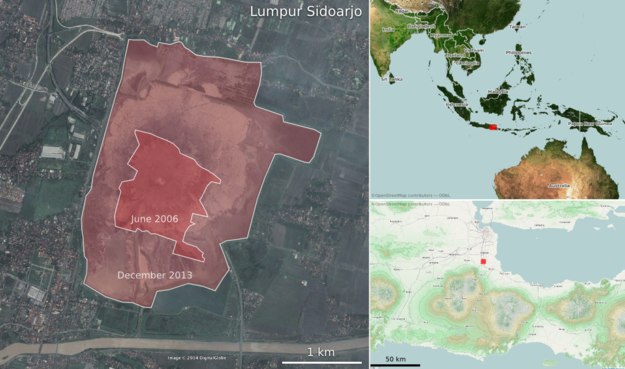
Lusi is the nickname of Lumpur Sidoarjo — 'the mud of Sidoarjo' — the giant mud volcano in the city of Sidoarjo, East Java, Indonesia. This week, Lusi is eight years old.

Google MapsBefore you read on, I recommend taking a look at it in Google Maps. Actually, Google Earth is even better — especially with the historical imagery. 

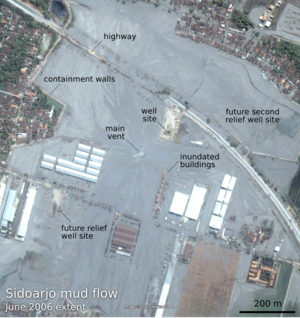
The mud flow was [may have been; see comments below — edit, 26 June 2014] triggered by the Banjar Panji 1 exploration well, operated by Lapindo Brantas, though the conditions may have been set up by a deadly earthquake. Mud loss events started in the early hours of 27 May 2006, seven minutes after the 6.2 Mw Yogyakarta earthquake that killed about 6,000 people. About 24 hours later, a large kick was killed and the blow-out preventer activated. Another 22 hours after this, while fishing in the killed well, mud, steam, and natural gas erupted from a fissure about 200 m southwest of the well. A few weeks after that, it was venting 180,000 m³ every day — enough mud to fill 72 Olympic swimming pools.

Thousands of years

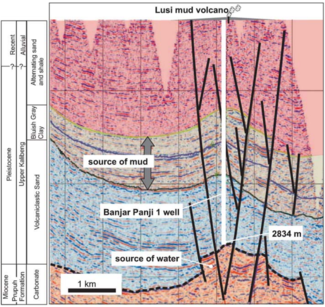
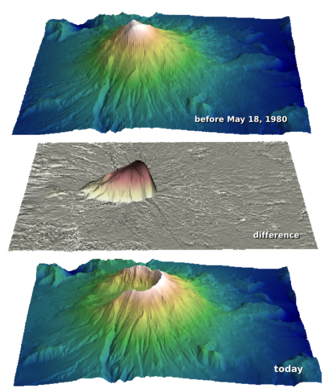
In the slow-motion disaster that followed, as hot water from Miocene carbonates mobilized volcanic mud from Pleistocene mudstones, at least 15,000 people — and maybe as many as 50,000 people — were displaced from their homes. Davies et al. (2011) estimated that the main eruption may last 26 years, though recent sources suggest it is easing quickly. Still, during this time, we might expect 95–475 m of subsidence. And in the long term? 

By analogy with natural mud volcanoes it can be expected to continue to flow at lower rates for thousands of years. — Davies et al. (2011)

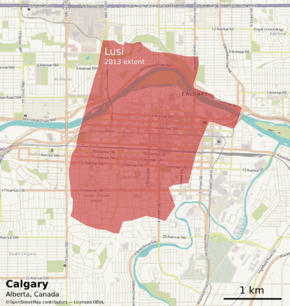
So we're only 8 years into a thousand-year man-made eruption. And there's already enough mud thrown up from the depths to cover downtown Calgary...

References and further reading

Quite a bit has been written about LUSI. The Hot Mud Flow blog tracks a lot of it. The National University of Singapore has a lot of satellite photographs, besides those you'll find in Google Earth. The Wikipedia article links to a lot of information, as you'd expect. The Interweb has a few others, including this article by Tayvis Dunnahoe in E&P Magazine. 

There are also some scholarly articles. These two are worth tracking down:

Davies, R, S Mathias, R Swarbrick and M Tingay (2011). Probabilistic longevity estimate for the LUSI mud volcano, East Java. Journal of the Geological Society 168, 517–523. DOI 10.1144/0016-76492010-129

Sawolo, N, E Sutriono, B Istadi, A Darmoyo (2009). The LUSI mud volcano triggering controversy: was it caused by drilling? Marine & Petroleum Geology 26 (9), 1766–1784. DOI 10.1016/j.marpetgeo.2009.04.002


The satellite images in this post are © DigitalGlobe and Google, captured from Google Earth, and are used here in accordance with their terms of use. The maps are © OpenStreetMap and licensed ODbL. The seismic section is from Davies et al. 2011 and © The Geological Society of London and is used here in accordance with their terms of use. The text of this post is © Agile Geoscience and openly licensed under the terms of CC-BY, as always!

Are we alright?

GeoConvention_2014_logo.png

This year's Canada GeoConvention tried a few new things. There was the Openness Unsession, Jen Russel Houston's Best of 2013 PechaKutcha session, and the On Belay careers session. Attendance at the unsession was a bit thin; the others were well attended. Hats off to the organizers for getting out of a rut.

I went to the afternoon of the On Belay session. It featured several applied geoscientists with less than 5 years of experience in the industry. I gather the conference asked them for a candid 'insider' view, with career tips for people like them. I heard 2 talks, and the experience left me literally shaking, prompting Ben Cowie to ask me if I was alright.

I was alright, but I'm not sure about us. Our community — or this industry — has a problem.

Don't be yourself

Marc Enter gave a talk entitled Breaking into Calgary's oil and gas industry, an Aussie's perspective.

Marc narrated the arc of his career: well site geology in a trailer in the outback, re-location to Calgary, being laid-off, stumbling into consultancy (what a person does when they can't find a real job), and so on. On this journey, Marc racked up hundreds of hours of interview experience searching for work in Calgary. Here are some of his learnings, paraphrased but I think they are accurate:

  • Being yourself is impossible in a unfamiliar place. So don't be yourself.
  • Interview experience is crucial to being comfortable, so apply for jobs you have no interest in, just for the experience.
  • If the job description doesn’t sound exactly right to you, apply anyway. It's experience.
  • Confidence is everything. HR people are sniffer dogs for confidence. If you don't have it, invent it.
  • On confidence: it is easier to find a job when you have a job.

What on earth are we teaching these young professionals about working in this industry? This is awful.

How to survive the workday 

Jesse Shoengut gave a talk entitled One man’s tips and tricks for surviving your early professional career

Surviving. That's the word he chose. Might as well have been enduring. Tolerating. TGIF mindset. Like Marc, Jesse spoke about a haphazard transition from university into the working world. If you can't find a job after you finish your undergrad, you can always have a go at grad school. That's one way to get work experience, if all else fails.

Fine, finding work can be hard, and not all jobs are awesome. But with statements like, "Here are some things that keep me sane at work, and help get me through the day," I started to react a bit. C'mon, is that really what people in the audience deserve to hear? Is that really what work is like? It's depressing.

A broken promise

Listening to these talks, I felt embarrassed for our profession. They felt like a candid celebration of mediocrity, where confidence compensates for complacency. I don't blame these young professionals — students have been groomed, through summer internships and hyper-conventional careers events, to get their resumes in order, fit in, and follow instructions. We in industry have built this trap we're mired in. And we are continually seduced. Seduced by the bait of more-then-decent pay and plenty of other rewards. 

I talked to one fellow afterwards. He said, "Yeah, well, a lot of people are finding it hard to find a job right now." If these cynical, jaded young professionals are representative, I'm not surprised.

Were you at this session? Did you see other talks, or walk away with a different impression? I'd love to hear your viewpoints... am I being unfair? Leave a comment.

Mining innovation

by Jelena Markov and Tom Horrocks

Jelena is a postgraduate student and Tom is a research assistant at the University of Western Australia, Perth. They competed in the recent RIIT Unearthed hackathon, and kindly offered to tell us all about it. Thank you, Jelena and Tom!


Two weeks ago Perth coworking space Spacecubed hosted a unique 54-hour-long hackathon focused on the mining industry. Most innovations in the mining industry are the result of long-term strategic planning in big mining companies, or collaboration with university groups. In contrast, the Unearthed hackathon provided different perspectives on problems in the mining domain by giving 'outsiders' a chance to work on industry problems.

The event attracted web-designers, software developers, data gurus, and few geology and geophysics geeks, all of whom worked together on data — both open and proprietary from the Western Australian Government and industry respectively — to deliver time-constrained solutions to problems in the mining domain. There were around 100 competitors divided into 18 teams, but just one underlying question: can web-designers and software developers create solutions that compete, on an innovative level, with those from the R&D divisions of mining companies? Well, according to panel of mining executives and entrepreneurs, they can.

Safe, seamless shutdown

The majority of the teams chose to work on logistic problems in mining production. For example, the Stockphiles worked on a Rio Tinto problem about how to efficiently and safely shut down equipment without majorly disturbing the overall system. Their solution used Directed Acyclic Graphs as the basis for an interactive web-based interface that visualised the impacted parts of the system. Outside of the mining production domain, however, two teams tackled problems focused on geology and geophysics...

Geoscience hacking

The team Ultramafia used augmented reality and cloud-based analysis to visualize geological mapping, with the underlying theme of the smartphone replacing the geological hammer, and also the boring task of joint logging!

The other team in this domain — and the team we were part of — was 50 Grades of Shale...

The team consisted of three PhD students and three staff members from the Centre for Exploration Targeting at the UWA. We created an app for real-time downhole petrophysical data analysis — dubbed Wireline Spelunker — that automatically classifies lithology types from wireline logs and correlates user-selected log segments across the drill holes. We used some public libraries for machine learning and signal analysis algorithms, and within 54 hours the team had implemented a workflow and interface, using data from the government database.

The boulder detection problem

The first prize, a 1 oz gold medal, was awarded to Applied Mathematics, who came up with an extraordinary use of accelerometers. They worked on Rio Tinto's 'boulder detection' problem — early detection of a large rocks loaded into mining trucks in order to prevent crusher malfunctions later in the process, which could ultimately cost $250,000 per hour in lost revenue. The team's solution was to detect large boulders by measuring the truck's vibrations during loading.

Second and third prizes went to Pit IQ and The Froys respectively. Both teams worked on data visualization problems on the mine site, and came up with interactive mobile dashboards.

A new role for Perth?

Besides having a chance to tackle problems that are costing the mining industry millions of dollars a year, this event has demonstrated that Perth is not just a mining hub but also has potential for something else.

This potential is recognized by event organizers Resources Innovation through Information Technology — Zane, Justin, Paul, and Kevin. They see potential in Perth as a centre for tech start-ups focused on the resource industry. Evidently, the potential is huge.

Follow Jelena on Twitter

Fibre optic seismology at #GeoCon14

We've been so busy this week, it's hard to take time to write. But for the record, here are two talks I liked yesterday at the Canada GeoConvention. Short version — Geophysics is awesome!

DAS good

Todd Bown from OptaSense gave an overview of the emerging applications for distributed acoustic sensing (DAS) technology. DAS works by shining laser pulses down a fibre optic cable, and measuring the amount of backscatter from impurities in the cable. Tiny variations in strain on the cable induced by a passing seismic wave, say, are detected as subtle time delays between light pulses. Amazing.

Fibre optic cables aren't as sensitive as standard geophone systems (yet?), but compared to conventional instrumentation, DAS systems have several advantages:

  • Deployment is easy: fibre is strapped to the outside of casing, and left in place for years.
  • You don't have to re-enter and interupt well operations to collect data.
  • You can build ultra-long receiver arrays — as long as your spool of fibre.
  • They are sensitive to a very broad band of signals, from DC to kilohertz.

Strain fronts

Later in the same session, Paul Webster (Shell) showed results from an experiment that used DAS as a fracture diagnosis tool. That means you can record for minutes, hours, even days; if you can cope with all that data. Shell has accumulated over 300 TB of records from a handful of projects, and seems to be a leader in this area.

By placing a cable in one horizontal well in order to listen to the frac treatment from another, the cable can effectively designed to record data similar to a conventional shot gather, except with a time axis of 30 minutes. On the gathers he drew attention to slow-moving arcuate events that he called strain fronts. He hypothesized a number of mechanisms that might cause these curious signals: the flood of fracking fluids finding their way into the wellbore, the settling and closing creep of rock around proppant, and so on. This work is novel and important because it offers insight into the mechanical behavoir of engineered reservoirs, not just during the treatment, but long after.

Why is geophysics awesome? We can measure sound with light. A mile underground. That's all.

Free the (seismic) data!

Yesterday afternoon Evan and I hosted the second unsession at the GeoConvention in Calgary. After last year exposing 'Free the data' as one of the unsolved problems in subsurface geoscience, we elected to explore this idea further. And we're addicted to this kind of guided, recorded conversation.

Attendance was a little thin, but those who came spent the afternoon deep in conversation about open data, open software, and greater industry transparency. And we unearthed an exciting and potentially epic conclusion that I hope leads to a small revolution.

What happened?

Rather than leaving the floor completely open, we again brought some structure to the proceedings. I'll post the full version to the wiki page, but here's the overview:

  1. Group seismic interpretation: 5 interpreters in 5 minutes.
  2. Stories about openness: which of 26 short stories resonate with you most?
  3. Open/closed, accessible/inaccessible: a scorecard for petroleum geoscience.
  4. Where are the opportunities? What should we move from closed to open?

As you might expect, the last part was the real point. We wanted to find some high-value areas to poke, or at least gather evidence around. And one area—one data type—was identified as being (a) closed and inaccessible in Canada and (b) much more impactful if it were open and accessible. I gave the punchline away in the title, but that data type is seismic data.

Open, public seismic data is much too juicy a topic to do justice to in this post, so stay tuned for a review of some the specifics of how that conversation went. Meanwhile, imagine a world with free, public seismic data...

Reflections on the 2nd edition

The afternoon went well, and the outcome was intriguing, but we were definitely disappointed by the turnout. We have multiple working hypotheses about it...

  • There may not be a strong appetite for this sort of session, especially on a 'soft' topic. Next time: seismic resolution?
  • The first day might not be the best time for it, because people are still in the mood for talks. Next time: Wednesday morning?
  • The programme maybe didn't reflect what the unsession was about, and the time was unclear. Next time: More visibility.
  • Three hours may be too much to ask from people, though you could say the same about any other session here.

We'd love to hear your thoughts too... Are we barking up completely the wrong tree? Does our community even want to have these conversations? Should we try again in 2015?

Looking forward to #GeoCon14

Agile is off to Calgary on Sunday. We have three things on our List of Thing To Do: 

  1. We're hosting another Unsession on Monday... If you're in Calgary, please come along! It's just like any other session at the conference, only a bit more awesome.
  2. We'll be blogging from GeoConvention 2014. If there's a talk you'd like to send us to, we take requests! Just drop us a line or tweet at us!
  3. Evan is teaching his Creative Geocomputing class. Interested? There are still places. A transformative experience, or your money back.

What's hot at GeoCon14

Here's a run-down of what we're looking forward to catching:

  • Monday: Maybe it's just me, but I always find seismic acquisition talks stimulating. In the afternoon, the Unsession is the place to be. Not Marco Perez's probably awesome talk about brittleness and stress. Definitely not. 
  • Tuesday: If it wasn't for the fear of thrombosis, it'd be tempting to go to Glen 206 and stay in Log Analysis sessions all day. In the afternoon, the conference is trying something new and interesting — Jen Russel-Houston (a bright spark if ever there was one) is hosting a PechaKucha — lightning versions of the best of GeoConvention 2013. 
  • Wednesday: This year's conference is unusually promising, because there is yet another session being given over to 'something different' — two actually. A career-focused track will run all day in Macleod D, called (slightly weirdly) ‘On Belay’: FOCUSing on the Climb that is a Career in Geoscience. Outside of that, I'd head for the Core Analysis sessions.
  • Friday: We won't be there this year, but the Core Conference is always worth going to. I haven't been to anything like it at any other conference. It's open on Thursday too, but go on the Friday for the barbeque (tix required).

The GeoConvention is always a good conference. It surprises me how few geoscientists come from outside of Canada to this event. Adventurous geophysicists especially should consider trying it one year — Calgary is really the epicentre of seismic geophysics, and perhaps of petrophysics too.

And the ski hills are still open.

How much rock was erupted from Mt St Helens?

One of the reasons we struggle when learning a new skill is not necessarily because this thing is inherently hard, or that we are dim. We just don't yet have enough context for all the connecting ideas to, well, connect. With this in mind I wrote this introductory demo for my Creative Geocomputing class, and tried it out in the garage attached to START Houston, when we ran the course there a few weeks ago.

I walked through the process of transforming USGS text files to data graphics. The motivation was to try to answer the question: How much rock was erupted from Mount St Helens?

This gorgeous data set can be reworked to serve a lot of programming and data manipulation practice, and just have fun solving problems. My goal was to maintain a coherent stream of instructions, especially for folks who have never written a line of code before. The challenge, I found, is anticipating when words, phrases, and syntax are being heard like a foriegn language (as indeed they are), and to cope by augmenting with spoken narrative.

Text file to 3D plot

To start, we'll import a code library called NumPy that's great for crunching numbers, and we'll abbreviate it with the nickname np:

>>> import numpy as np

Then we can use one of its functions to load the text file into an array we'll call data:

>>> data = np.loadtxt('z_after.txt')

The variable data is a 2-dimensional array (matrix) of numbers. It has an attribute that we can call upon, called shape, that holds the number of elements it has in each dimension,

>>> data.shape
(1370, 949)

If we want to make a plot of this data, we might want to take a look at the range of the elements in the array, we can call the peak-to-peak method on data,

>>> data.ptp()
41134.0

Whoa, something's not right, there's not a surface on earth that has a min to max elevation that large. Let's dig a little deeper. The highest point on the surface is,

>>> np.amax(data)
8367.0

Which looks to the adequately trained eye like a reasonable elevation value with units of feet. Let's look at the minimum value of the array,

>>> np.amin(data)
-32767.0 

OK, here's the problem. GIS people might recognize this as a null value for elevation data, but since we aren't assuming any knowledge of GIS formats and data standards, we can simply replace the values in the array with not-a-number (NaN), so they won't contaminate our plot.

>>> data[data==-32767.0] = np.nan

To view this surface in 3D we can import the mlab module from Mayavi

>>> from mayavi import mlab

Finally we call the surface function from mlab, and pass the input data, and a colormap keyword to activate a geographically inspired colormap, and a vertical scale coefficient.

>>> mlab.surf(data,
              colormap='gist_earth',
              warp_scale=0.05)

After applying the same procedure to the pre-eruption digits, we're ready to do some calculations and visualize the result to reveal the output and its fascinating characteristics. Read more in the IPython Notebook.

If this 10 minute introduction is compelling and you'd like to learn how to wrangle data like this, sign up for the two-day version of this course next week in Calgary. 

Eventbrite - Agile Geocomputing