News headlines

Our old friend the News post... We fell off the wagon there for a bit. From now on we'll just post news when we collect a few stories, or as it happens. If you miss the old last-Friday-of-the-month missive, we are open to being convinced!

First release of Canopy

Back in November we mentioned Canopy, Austin-based Enthought's new Python programming environment, especially aimed at scientists. Think of it as Python (an easy-to-use language) in MATLAB form (with file management, plotting, etc.). Soon, Enthought plan to add a geophysical toolbox — SEGY read/write, trace display, and so on. We're very, very excited for the future of rapid geophysical problem-solving! More on the Enthought blog.

The $99 supercomputer

I recently got a Raspberry Pi — a $35 Linux machine a shade larger than a credit card. We're planning to use it at The HUB South Shore to help kids learn to code. These little machines are part of what we think could be an R&D revolution, as it gets cheaper and cheaper to experiment. Check out the University of Southampton's Raspberry Pi cluster!

If that's not awesome enough for you, how about Parallella, which ships this summer and packs 64 cores for under $100! If you're a software developer, you need to think about whether your tools are ready for parallel processing — not just on the desktop, but everywhere. What becomes possible?

Geophysics + 3D printing = awesome

Unless you have been living on a seismic boat for the last 3 years, you can't have failed to notice 3D printing. I get very excited when I think about the possibilities — making real 3D geomodels, printing replacement parts in the field, manifesting wavefields, geobodies, and so on. The best actual application we've heard of so far — these awesome little physical models in the Allied Geophysical Laboratories at the University of Houston (scroll down a bit).

Sugru

Nothing to do with geophysics, but continuing the hacker tech and maker theme... check out sugru.com — amazing stuff. Simple, cheap, practical. I am envisaging a maker lab for geophysics — who wants in?

Is Oasis the new Ocean?

Advanced Seismic is a Houston-based geophysical software startup that graduated from the Surge incubator in 2012. So far, they have attracted a large amount of venture capital, and I understand they're after tens of millions more. They make exciting noises about Oasis, a new class of web-aware, social-savvy software with freemium pricing. But so far there's not a lot to see — almost everything on their site says 'coming soon' and Evan and I have had no luck running the (Windows-only) demo tool. Watch this space.
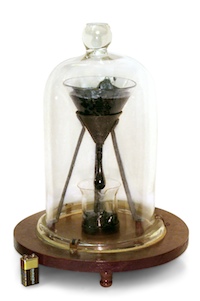
Slow pitch

The world's longest-running lab experiment is a dripping flask of pitch, originally set up in 1927. The hydrocarbon has a viscosity of about 8 billion centipoise, which is 1000 times more viscous than Alberta bitumen. So far 8 drops have fallen, the last on 28 November 2000. The next? Looks like any day now! Or next year. 

Image: University of Queensland, licensed CC-BY-SA. 

Well-tie workflow

We've had a couple of emails recently about well ties. Ever since my days as a Landmark workflow consultant, I've thought the process of calibrating seismic data to well data was one of the rockiest parts of the interpretation workflow—and not just because of SynTool. One might almost call the variety of approaches an unsolved problem.

Tying wells usually involves forward modeling a synthetic seismogram from sonic and density logs, then matching that synthetic to the seismic reflection data, thus producing a relationship between the logs (measured in depth) and the seismic (measured in travel time). Problems arise for all sorts of reasons: the quality of the logs, the quality of the seismic, confusion about handling the shallow section, confusion about integrating checkshots, confusion about wavelets, and the usability of the software. Like much of the rest of interpretation, there is science and judgment in equal measure. 

Synthetic seismogram (right) from the reservoir section of the giant bitumen field Surmont, northern Alberta. The reservoir is only about 450 m deep, and about 70 m thick. From Hall (2009), Calgary GeoConvention. 

Synthetic seismogram (right) from the reservoir section of the giant bitumen field Surmont, northern Alberta. The reservoir is only about 450 m deep, and about 70 m thick. From Hall (2009), Calgary GeoConvention

I'd go so far as to say that I think tying wells robustly is one of the unsolved problems of subsurface geoscience. How else can we explain the fact that any reasonably mature exploration project has at least 17 time-depth curves per well, with names like JLS_2002_fstk01_edit_cks_R24Hz_final?

My top tips

First, read up. White & Simm (2003) in First Break21 (10) is excellent. Rachel Newrick's essays in 52 Things are essential. Next, think about the seismic volume you are trying to tie to. Keep it to the nears if possible (don't use a full-angle stack unless it's all you have). Use a volume with less filtering if you have it (and you should be asking for it). And get your datums straight, especially if you are on land: make certain your seismic datum is correct. Ask people, look at SEGY headers, but don't be satisfied with one data point.

Once that stuff is ironed out:

  1. Chop any casing velocities or other non-data off the top of your log.
  2. Edit as gently and objectively as possible. Some of those spikes might be geology.
  3. Look at the bandwidth of your seismic and make an equivalent zero-phase wavelet.
  4. Don't extract a wavelet till you have a few good ties with a zero-phase wavelet, then extract from several wells and average. Extracting wavelets is a whole other post...
  5. Bulk shift the synthetic (e.g. by varying the replacement velocity) to make a good shallow event tie.
  6. Stretch (or, less commonly, squeeze) the bottom of the log to match the deepest event you can. 
  7. If possible, don't add any more tie points unless you really can't help yourself. Definitely no more than 5 tie points per well, and no closer than a couple of hundred milliseconds.
  8. Capture all the relevant data for every well as you go (screenshot, replacement velocity, cross-correlation coefficient, residual phase, apparent frequency content).
  9. Be careful with deviated wells; you might want to avoid tying the deviated section entirely and use verticals instead. If you go ahead, read your software's manual. Twice.
  10. Do not trust any checkshot data you find in your project — always go back to the original survey (they are almost always loaded incorrectly, mainly because the datums are really confusing).
  11. Get help before trying to load or interpret a VSP unless you really know what you are doing.

I could add some don'ts too...

  • Don't tie wells to 2D seismic lines you have not balanced yet, unless you're doing it as part of the process of deciding how to balance the seismic. 
  • Don't create multiple, undocumented, obscurely named copies or almost-copies of well logs and synthetics, unless you want your seismic interpretation project to look like every seismic interpretation project I've ever seen (you don't).

Well ties are one of those things that get in the way of 'real' (i.e. fun) interpretation so they sometimes get brushed aside, left till later, rushed, or otherwise glossed over. Resist at all costs. If you mess them up and don't find out till later, you will be very sad, but not as sad as your exploration manager.

Update

on 2013-04-27 13:25 by Matt Hall

Can't resist posting this most excellent well tie. Possibly the best you'll ever see.

Picture by Maitri, licensed CC-BY-NC-SA

Update

on 2014-07-04 13:53 by Matt Hall

Evan has written a deconstructed well-tie workflow, complete with IPython Notebook for you to follow along with, for The Leading Edge. Read Well-tie calculus here.

What is an unsession?

Yesterday I invited you (yes, you) to our Unsolved Problems Unsession on 7 May in Calgary. What exactly will be involved? We think we can accomplish two things:

  1. Brainstorm the top 10, or 20, or 50 most pressing problems in exploration geoscience today. Not limited to but focusing on those problems that affect how well we interface — with each other, with engineers, with financial people, with the public even. Integration problems.
  2. Select one or two of those problems and solve them! Well, not solve them, but explore ways to approach solving them. What might a solution be worth? How many disciplines does it touch? How long might it take? Where could we start? Who can help?Word cloud

There are bright, energetic young people out there looking for relevant problems to work on towards a Master's or PhD. There are entrepreneurs looking for high-value problems to create a new business from. And software companies looking for ways to be more useful and relevant to their users. And there is more than one interpreter wishing that innovation would speed up a bit in our industry and make their work a little — or a lot — easier. 

We don't know where it will lead, but we think this unsession is one way to get some conversations going. This is not a session to dip in and out of — we need 4 hours of your time. Bring your experience, your uniqueness, and your curiosity.

Let's reboot our imaginations about what we can do in our science.

An invitation to a brainstorm

Who of us would not be glad to lift the veil behind which the future lies hidden; to cast a glance at the next advances of our science and at the secrets of its development during future centuries? What particular goals will there be toward which the leading [geoscientific] spirits of coming generations will strive? What new methods and new facts in the wide and rich field of [geoscientific] thought will the new centuries disclose?

— Adapted from David Hilbert (1902). Mathematical Problems, Bulletin of the American Mathematical Society 8 (10), p 437–479. Originally appeared in in Göttinger Nachrichten, 1900, pp. 253–297.

Back at the end of October, just before the SEG Annual Meeting, I did some whining about conferences: so many amazing, creative, energetic geoscientists, doing too much listening and not enough doing. The next day, I proposed some ways to make conferences for productive — for us as scientists, and for our science itself. 

Evan and I are chairing a new kind of session at the Calgary GeoConvention this year. What does ‘new kind of session’ mean? Here’s the lowdown:

The Unsolved Problems Unsession at the 2013 GeoConvention will transform conference attendees, normally little more than spectators, into active participants and collaborators. We are gathering 60 of the brightest, sparkiest minds in exploration geoscience to debate the open questions in our field, and create new approaches to solving them. The nearly 4-hour session will look, feel, and function unlike any other session at the conference. The outcome will be a list of real problems that affect our daily work as subsurface professionals — especially those in the hard-to-reach spots between our disciplines. Come and help shed some light, room 101, Tuesday 7 May, 8:00 till 11:45.

What you can do

  • Where does your workflow stumble? Think up the most pressing unsolved problems in your workflows — especially ones that slow down collaboration between the disciplines. They might be organizational, they might be technological, they might be scientific.
  • Put 7 May in your calendar and come to our session! Better yet, bring a friend. We can accommodate about 60 people. Be one of the first to experience a new kind of session!
  • If you would like to help host the event, we're looking for 5 enthusiastic volunteers to play a slightly enlarged role, helping guide the brainstorming and capture the goodness. You know who you are. Email hello@agilegeoscience.com

Backwards and forwards reasoning

Most people, if you describe a train of events to them will tell you what the result will be. There will be few people however, that if you told them a result, would be able to evolve from their own consciousness what the steps were that led to that result. This is what I mean when I talk about reasoning backward.

— Sherlock Holmes, A Study in Scarlet, Sir Arthur Conan Doyle (1887)

Reasoning backwards is the process of solving an inverse problem — estimating a physical system from indirect data. Straight-up reasoning, which we call the forward problem, is a kind of data collection: empiricism. It obeys a natural causality by which we relate model parameters to the data that we observe.

Modeling a measurement

Marmousi_Forward_Inverse_800px.png

Where are you headed? Every subsurface problem can be expressed as the arrow between two or more such panels.Inverse problems exists for two reasons. We are incapable of measuring what we are actually interested in, and it is impossible to measure a subject in enough detail, and in all aspects that matter. If, for instance, I ask you to determine my weight, you will be troubled if the only tool I allow is a ruler. Even if you are incredibly accurate with your tool, at best, you can construct only an estimation of the desired quantity. This estimation of reality is what we call a model. The process of estimation is called inversion.

Measuring a model

Forward problems are ways in which we acquire information about natural phenomena. Given a model (me, say), it is easy to measure some property (my height, say) accurately and precisely. But given my height as the starting point, it is impossible to estimate the me from which it came. This is an example of an ill-posed problem. In this case, there is an infinite number of models that share my measurements, though each model is described by one exact solution. 

Solving forward problems are nessecary to determine if a model fits a set of observations. So you'd expect it to be performed as a routine compliment to interpretation; a way to validate our assumptions, and train our intuition.  

The math of reasoning

Forward and inverse problems can be cast in this seemingly simple equation.

Gm=d

where d is a vector containing N observations (the data), m is a vector of M model parameters (the model), and G is a N × M matrix operator that connects the two. The structure of G changes depending on the problem, but it is where 'the experiment' goes. Given a set of model parameters m, the forward problem is to predict the data d produced by the experiment. This is as simple as plugging values into a system of equations. The inverse problem is much more difficult: given a set of observations d, estimate the model parameters m.

Marmousi_G_Model_Data_800px_updated.png

I think interpreters should describe their work within the Gm = d framework. Doing so would safeguard against mixing up observations, which should be objective, and interpretations, which contain assumptions. Know the difference between m and d. Express it with an arrow on a diagram if you like, to make it clear which direction you are heading in.

Illustrations for this post were created using data from the Marmousi synthetic seismic data set. The blue seismic trace and its corresponding velocity profile is at location no. 250.

How to get paid big bucks

Yesterday I asked 'What is inversion?' and started looking at problems in geoscience as either forward problems or inverse problems. So what are some examples of inverse problems in geoscience? Reversing our forward problem examples:

  • Given a suite of sedimentological observations, provide the depositional environment. This is a hard problem, because different environments can produce similar-looking facies. It is ill-conditioned, because small changes in the input (e.g. the presence of glaucony, or Cylindrichnus) produces large changes in the interpretation.
  • Given a seismic trace, produce an impedance log. Without a wavelet, we cannot uniquely deduce the impedance log — there are infinitely many combinations of log and wavelet that will give rise to the same seismic trace. This is the challenge of seismic inversion. 

To solve these problems, we must use induction — a fancy name for informed guesswork. For example, we can use judgement about likely wavelets, or the expected geology, to constrain the geophysical problem and reduce the number of possibilities. This, as they say, is why we're paid the big bucks. Indeed, perhaps we can generalize: people who are paid big bucks are solving inverse problems...

  • How do we balance the budget?
  • What combination of chemicals might cure pancreatic cancer?
  • What musical score would best complement this screenplay?
  • How do I act to portray a grief-stricken war veteran who loves ballet?

What was the last inverse problem you solved?

What is inversion?

Inverse problems are at the heart of geoscience. But I only hear hardcore geophysicists talk about them. Maybe this is because they're hard problems to solve, requiring mathematical rigour and computational clout. But the language is useful, and the realization that some problems are just damn hard — unsolvable, even — is actually kind of liberating. 

Forwards first

Before worrying about inverse problems, it helps to understand what a forward problem is. A forward problem starts with plenty of inputs, and asks for a straightforward, algorithmic, computable output. For example:

  • What is 4 × 5?
  • Given a depositional environment, what sedimentological features do we expect?
  • Given an impedance log and a wavelet, compute a synthetic seismogram.

These problems are solved by deductive reasoning, and have outcomes that are no less certain than the inputs.

Can you do it backwards?

You can guess what an inverse problem looks like. Computing 4 × 5 was pretty easy, even for a geophysicist, but it's not only difficult to do it backwards, it's impossible:

20 = what × what

You can solve it easily enough, but solutions are, to use the jargon, non-unique: 2 × 10, 7.2 × 1.666..., 6.3662 × π — you get the idea. One way to deal with such under-determined systems of equations is to know about, or guess, some constraints. For example, perhaps our system — our model — only includes integers. That narrows it down to three solutions. If we also know that the integers are less than 10, there can be only one solution.

Non-uniqueness is a characteristic of ill-posed problems. Ill-posedness is a dead giveaway of an inverse problem. Proposed by Jacques Hadamard, the concept is the opposite of well-posedness, which has three criteria:

  • A solution exists.
  • The solution is unique.
  • The solution is well-conditioned, which means it doesn't change disproportionately when the input changes. 

Notice the way the example problem was presented: one equation, two unknowns. There is already a priori knowledge about the system: there are two numbers, and the operator is multiplication. In geoscience, since the earth is not a computer, we depend on such knowledge about the nature of the system — what the variables are, how they interact, etc. We are always working with a model of nature.

Tomorrow, I'll look at some specific examples of inverse problems, and Evan will continue the conversation next week.

The elements of seismic interpretation

I dislike the term seismic interpretation. There. I said it. Not the activity itself, (which I love), just the term. Why? Well, I find it's too broad to describe all of the skills and techniques of those who make prospects. Like most jargon, it paradoxically confuses more than it conveys. Instead, use one of these three terms to describe what you are actually doing. Note: these tasks may be performed in series, but not in parallel.

Visualizing

To visualize is to 'make something visible to the eye'. That definition fits pretty well in what we want to do. We want to see our data. It sounds easy, but it is routinely done poorly. We need context for our data. Being able to change the way our data looks, exploring and exaggerating different perspectives and scales, symbolizing it with perceptually pleasant colors, displaying it alongside other relevant information, and so on.

Visualizing also means using seismic attributes. Being clever enough to judge which ones might be helpful, and analytical enough to evaluate from the range of choices. Even more broadly, visualizing is something that starts with acquisition and survey planning. In fact, the sum of processes that comprise the seismic experiment is to make the unseen visible to the eye. I think there is a lot of room left for bettering our techniques of visualization. Steve Lynch is leading the way on that.

Digitizing

One definition of digitizing is along the lines of 'converting pictures or sound into numbers for processing in a computer'. In seismic interpretation, this usually means capturing and annotating lines, points, and polygons, for making maps. The seismic interpreter may spend the majority of their time picking horizons; a kind of computer-assisted drawing. Seismic digitization, however, is both guided and biased by human labor in order to delineate geologic features requiring further visualization. 

Whether you call it picking, tracking, correlating or digitizing, seismic interpretation always involves some kind of drawing. Drawing is a skill that should be celebrated and practised often. Draw, sketch, illustrate what you see, and do it often. Even if your software doesn't let you draw it the way an artist should.

Modeling

The ultimate goal of the seismic interpreter, if not all geoscientists, is to unambiguously parameterize the present-day state of the earth. There is after all, only one true geologic reality manifested along only one timeline of events.

Even though we are teased by the sparse relics that comprise the rock record, the earth's dynamic history is unknowable. So what we do as interpreters is construct models that reflect the dynamic earth arriving at its current state.

Modeling is another potentially dangerous jargon word that has been tainted by ambiguity. But in the strictest sense, modeling defines the creative act of bringing geologic context to bear on visual and digital elements. Modeling is literally the process of constructing physical parameters of the earth that agree with all available observations, both visualized and digitized. It is the cognitive equivalent of solving a mathematical inverse problem. Yes, interpreters do inversions all the time, in their heads.

Good seismic interpretation requires practising each of these three elements. But indispensable seismic interpretation is achieved only when they are masterfully woven together.

Recommended reading
Steve Lynch's series of posts on wavefield visualization at 3rd Science is a good place to begin.