A forensic audit of seismic data

The SEG-Y “standard” is famously non-standard. (Those air quotes are actually part of the “standard”.)

For example, the inline and crossline location of a given trace — two things that you must have in order to load the data vaguely properly — are “recommended” (remember, it’s a “standard”) to be given in the trace’s header, at byte locations 189 and 193 respectively. Indeed, they might well be there. Or 1 and 5 (well, 5 or 9). Or somewhere else. Or not there at all.

Don Robinson at Resolve told me recently that he has seen more than 180 byte-location combinations, and he said another service company had seen more than 300.

All this can make loading seismic data really, really annoying.

I’d like to propose that the community performs a kind of forensic audit of SEG-Y files. I have 5 main questions:

  1. What proportion of files claim to be Rev 0, Rev 1, and Rev 2? And what standard are they actually? (If any!)

  2. What proportion of files in the wild use IBM vs IEEE floats? What about integers?

  3. What proportion of files in the wild use little-endian vs big-endian byte order. (Please tell me there's no middle-endian data out there!)

  4. What proportion of files in the wild use EBCDIC vs ASCII encoded textual file headers? (Again, I would hope there are no other encodings in use, but I bet there are.)

  5. What proportion of files use the Strongly recommended and Recommended byte locations for trace numbers, sample counts, sample interval, coordinates and inline–crossline numbers?

For each of these <things> it would also be interesting to know:

  • How does <thing> vary with the other things? That is, what's the cross-correlation matrix?

  • How does <thing> vary with the age of the file? Is there a temporal trend?

  • How does <thing> vary with the provenance of the file? What's the geographic trend? (For example, Don told me that the prevalence of PC-based interpretation packages in Canada led to widespread early adoption of IEEE floats and little-endian byte order; indeed, he says that 90% of the SEG-Y he sees in the wild is still IBM ormatted floats!)

While we’re at it, I'd also like in some more esoteric things:

  • How many files have cornerpoints in the text header, and/or trace locations in trace headers?

  • How many files have an unambiguous CRS in the text header?

  • How many files have information about the processing sequence in the text header? (E.g. imaging details, filters, etc.)

  • How many files have incorrect information in the headers (e.g. locations, sample interval, byte format, etc)

  • How many processors bother putting useful things like elevation, filters, sweeps, fold at target, etc, in the trace headers?

I don’t quite know how such a survey would happen. Most of these things are obviously detectable from the files themselves. Perhaps some of the many seismic data management systems already track these things. Or maybe you’re a data manager and you have some anecdotal data you can share.

What do you think? I’d love to hear your thoughts in the comments. Maybe there’s a good hackathon project here!

Transformation in 2021

SU_square_rnd.png

Virtual confererences have become — for now — the norm. In many ways they are far better than traditional conferences: accessible to all, inexpensive to organize and attend, asynchronous, recorded, and no-one has to fly 5,000 km to deliver a PowerPoint. In other ways, they fall short, for example as a way to meet new collaborators or socialize with old ones. As face-to-face meetings become a possibility again this summer, smart organizations will figure out ways to get the best of both worlds.

The Software Underground is continuing its exploration of virtual events next month with the latest edition of the TRANSFORM festival of the digital subsurface. In broad strokes, here’s what’s on offer:

  • The Subsurface Hackathon, starting on 16 April — all are welcome, including those new to programming.

  • 20 free & awesome tutorials, covering topics from Python to R, geothermal wells to seismic, and even reservoir simulation! And of course there’s a bit of machine learning and physics-based modeling in there too. Look forward to content from scientists in North & South America, Norway, Nigeria, and New Zealand.

  • Lightning talks from 24 members of the community — would you like to do one?

  • Birds of a Feather community meet-ups, a special Xeek challenge, and other special events.

  • The Annual General Meeting of the Software Underground, where we’ll adopt our by-law and appoint the board.

gather-town-rosay.png

We’ll even try to get at that tricky “hang out with other scientists” component, because we will have a virtual Gather.town world in which to hang out and hack, chat, or watch the livestreams.

If last year’s event is anything to go by, we can expect fantastic tutorial content, innovative hackathon projects, and great conversation between at least 750 digital geoscientists and engineers. (If you missed TRANSFORM 2020, don’t worry — all the content from last year is online and free forever, so it’s not too late to take part! Check it out.)


Registering for TRANSFORM

Registration is free, or pay-what-you-like. In other words, if you have funding or expenses for conferences and training, there’s an option to pay a small amount. But anyone can attend TRANSFORM free of charge. Thank you to the event sponsors, Studio X, for making this possible. (I will write about Studio X at a later date — they are doing some really cool things in the digital subsurface.)


To register for any part of TRANSFORM — even if you just want to come to the hackathon or a tutorial — click this button and complete the process on the Software Underground website. It’s a ‘pay what you like’ event, so there are 3 registration options with different prices — these are just different donation amounts. They don’t change anything about your registration.

I hope we see you at TRANSFORM. In the meantime, please jump into the Software Underground Slack and get involved in the conversations there. (You can also catch up on recent Software Underground highlights in the new series of blog posts.)

All the wedges

Wedges are a staple of the seismic interpreter’s diet. These simple little models show at a glance how two seismic reflections interact with each other when a rock layer thins down to — and below — the resolution limit of the data. We can also easily study how the interaction changes as we vary the wavelet’s properties, especially its frequency content.

Here’s how to make and plot a basic wedge model with Python in the latest version of bruges, v0.4.2:

 
import bruges as bg
import matplotlib.pyplot as plt

wedge, *_ = bg.models.wedge()

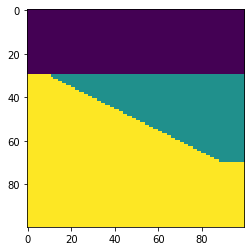
plt.imshow(wedge)
wedge_basic.png

It really is that simple! This model is rather simplistic though: it contains no stratigraphy, and the numerical content of the 2D array is just a bunch of integers. Let’s instead make a P-wave velocity model, with an internal bed of faster rock inside the wedge:

 
strat = [2.35, (2.40, 2.50, 2.40), 2.65]
wedge, *_ = bg.models.wedge(strat=strat)

plt.imshow(wedge)
plt.colorbar()
wedge_layer.png

We can also choose to make the internal geometry top- or bottom-conformant, mimicking onlap or an unconformity, respectively.

 
strat = strat=[0, 7*[1,2], 3]
wedge, *_ = bg.models.wedge(strat=strat,
                            conformance='base'
                           )

plt.imshow(wedge)
wedge_unconformity.png

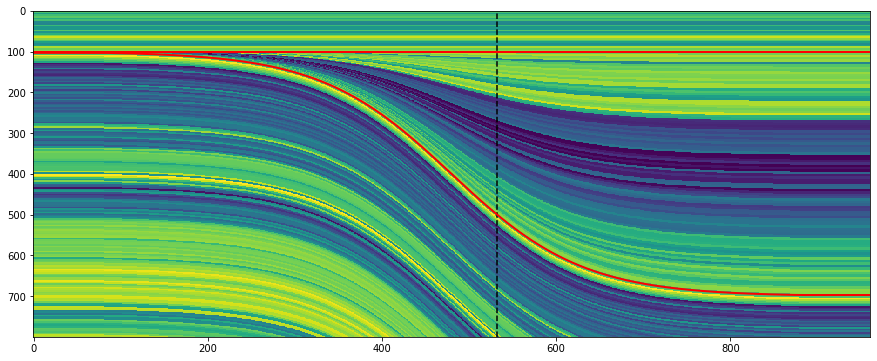
The killer feature of this new function might be using a log to make the stratigraphy, rather than just a few beds. This is straightforward to do with welly, because it makes selecting depth intervals and resampling a bit easier:

 
import welly

gr = welly.Well.from_las('R-39.las').data['GR']
log_above = gr.to_basis(stop=2620, step=1.0)
log_wedge = gr.to_basis(start=2620, stop=2720, step=1.0)
log_below = gr.to_basis(start=2720, step=1.0)

strat = (log_above, log_wedge, log_below)
depth, width = (100, 400, 100), (40, 200, 40)
wedge, top, base, ref = bg.models.wedge(depth=depth,
                                        width=width,
                                        strat=strat,
                                        thickness=(0, 1.5)
                                       )

plt.figure(figsize=(15, 6))
plt.imshow(wedge, aspect='auto')
plt.axvline(ref, color='k', ls='--')
plt.plot(top, 'r', lw=2)
plt.plot(base, 'r', lw=2)
wedge_log.png

Notice that the function returns to you the top and base of the wedgy part, as well as the position of the ‘reference’, in this case the well.

I’m not sure if anyone wanted this feature… but you can make clinoform models too:

wedge_log_clino.png

Lastly, the whole point of all this was to make a synthetic — the forward model of the seismic experiment. We can make a convolutional model with just a few more lines of code:

 
strat = np.array([2.32 * 2.65,  # Layer 1
                  2.35 * 2.60,  # Layer 2
                  2.35 * 2.62,  # Layer 3
                 ])

# Fancy indexing into the rocks with the model.
wedge, top, base, ref = bg.models.wedge(strat=strat)

# Make reflectivity.
rc = (wedge[1:] - wedge[:-1]) / (wedge[1:] + wedge[:-1])

# Get a wavelet.
ricker = bg.filters.ricker(0.064, 0.001, 40)

# Repeated 1D convolution for a synthetic.
syn = np.apply_along_axis(np.convolve, arr=rc, axis=0, v=ricker, mode='same')
wedge_synthetic.png

That covers most of what the tool can do — for now. I’m working on extending the models to three dimensions, so you will be able to vary layers or rock properties in the 3rd dimension. In the meantime, take these wedges for a spin and see what you can make! Do share your models on Twitter or LinkedIn, and have fun!

The hot rock hack is back

shirt_skull.png

Last year we ran the first ever Geothermal Hackathon. As with all things, we started small, but energetic: fourteen of us worked on six projects. Topics ranged from project management to geological mapping to natural language processing. It was a fun two days not thinking about coronavirus.

This year we’ll be meeting up on Thursday 13 and Friday 14 May, starting right after the Geoscience Virtual Event of the World Geothermal Congress. Everyone is invited — geoscientists, engineers, data nerds, programmers. No experience of geothermal is necessary, just creativity and curiosity.

Projects are already being discussed on the Software Underground; here are some of the ideas:

  • Data-munging project for Utah Forge, especially well 58-32.

  • Update the Awesome list Thomas Martin started last year.

  • Implementing classic, or newly published, equations and algorthims from the literature.

I expect the preceeding WGC event will spark some last-minute projects too. But for the time being, you’re welcome to add or vote on ideas on the event page. What tools or visualizations would you find useful?


Build some digital geo skills

📣 If you’re looking to build up your coding skills before the hackathon — or for a research project or an idea at work — join us for a Python class. We teach the fundamentals of Python, NumPy and matplotlib using geological and geophysical examples and geo-familiar datasets. There are two classes coming up in May (Digital Geology) and June (Digital Geophysics).