News of the month

The last news of the year. Here's what caught our eye in December.

Online learning, at a price

There was an online university revolution in 2012 — look for Udacity (our favourite), Coursera, edX, and others. Paradigm, often early to market with good new ideas, launched the Paradigm Online University this month. It's a great idea — but the access arrangement is the usual boring oil-patch story: only customers have access, and they must pay $150/hour — more than most classroom- and field-based courses! Imagine the value-add if it was open to all, or free to customers.

Android apps on your PC

BlueStacks is a remarkable new app for Windows and Mac that allows you to run Google's Android operating system on the desktop. This is potentially awesome news — there are over 500,000 apps on this platform. But it's only potentially awesome because it's still a bit... quirky. I tried running our Volume* and AVO* apps on my Mac and they do work, but they look rubbish. Doubtless the technology will evolve rapidly — watch this space. 

2PFLOPS HPC 4 BP

In March, we mentioned Total's new supercomputer, delivering 2.3 petaflops (quadrillion floating point operations per second). Now BP is building something comparable in Houston, aiming for 2 petaflops and 536 terabytes of RAM. To build it, the company has allocated 0.1 gigadollars to high-performance computing over the next 5 years.

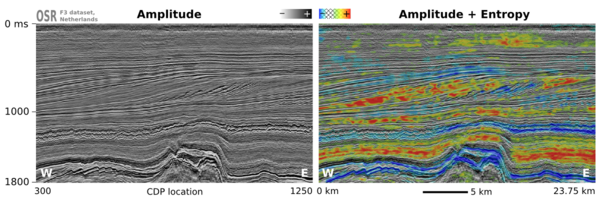
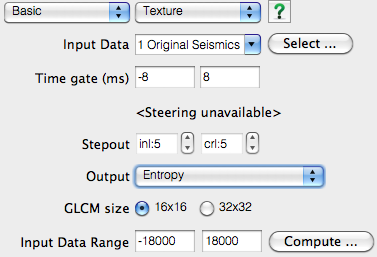
Haralick textures for everyone

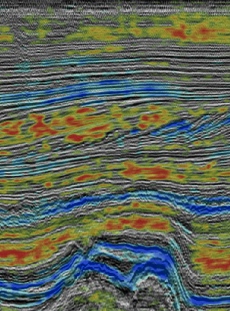
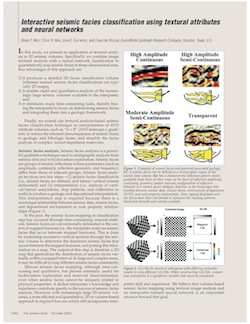
Matt wrote about OpendTect's new texture attributes just before Christmas, but the news is so exciting that we wanted to mention it again. It's exciting because Haralick textures are among the most interesting and powerful of multi-trace attributes — right up there with coherency and curvature. Their appearance in the free and open-source core of OpendTect is great news for interpreters.

That's it for 2012... see you in 2013! Happy New Year.

This regular news feature is for information only. We aren't connected with any of these organizations, and don't necessarily endorse their products or services. Except OpendTect, which we definitely do endorse.

Cope don't fix

Some things genuinely are broken. International financial practices. Intellectual property law. Most well tie software. 

But some things are the way they are because that's how people like them. People don't like sharing files, so they stash their own. Result: shared-drive cancer — no, it's not just your shared drive that looks that way. The internet is similarly wild, chaotic, and wonderful — but no-one uses Yahoo! Directory to find stuff. When chaos is inevitable, the only way to cope is fast, effective search

So how shall we deal with the chaos of well log names? There are tens of thousands — someone at Schlumberger told me last week that they alone have over 50,000 curve and tool names. But these names weren't dreamt up to confound the geologist and petrophysicist — they reflect decades of tool development and innovation. There is meaning in the morasse.

Standards are doomed

Twelve years ago POSC had a go at organizing everything. I don't know for sure what became of the effort, but I think it died. Most attempts at standardization are doomed. Standards are awash with compromise, so they aren't perfect for anything. And they can't keep up with changes in technology, because they take years to change. Doomed.

Instead of trying to fix the chaos, cope with it.

A search tool for log names

We need a search tool for log names. Here are some features it should have:

  • It should be free, easy to use, and fast
  • It should contain every log and every tool from every formation evaluation company
  • It should provide human- and machine-readable output to make it more versatile
  • You should get a result for every search, never drawing a blank
  • Results should include lots of information about the curve or tool, and links to more details
  • Users should be able to flag or even fix problems, errors, and missing entries in the database

To my knowledge, there are only two tools a little like this: Schlumberger's Curve Mnemonic Dictionary, and the SPWLA's Mnemonics Data Search. Schlumberger's widget only includes their tools, naturally. The SPWLA database does at least include curves from Baker Hughes and Halliburton, but it's at least 10 years out of date. Both fail if the search term is not found. And they don't provide machine-readable output, only HTML tables, so it's difficult to build a service on them.

Introducing fuzzyLAS

We don't know how to solve this problem, but we're making a start. We have compiled a database containing 31,000 curve names, and a simple interface and web API for fuzzily searching it. Our tool is called fuzzyLAS. If you'd like to try it out, please get in touch. We'd especially like to hear from you if you often struggle with rogue curve mnemonics. Help us build something useful for our community.

Seismic texture attributes — in the open at last

I read Brian West's paper on seismic facies a shade over ten years ago (West et al., 2002, right). It's a very nice story of automatic facies classification in seismic — in a deep-water setting, presumably in the Gulf of Mexico. I have re-read it, and handed it to others, countless times.

Ever since, for over a decade, I've wanted to be able to reproduce this workflow. It's one of the frustrations of the non-programming geophysicist that such reproduction is so hard (or expensive!). So hard that you may never quite manage it. Indeed, it took until this year, when Evan implemented the workflow in MATLAB, for a geothermal project. Phew!

But now we're moving to SciPy for our scientific programming, so Evan was looking at building the workflow again... until Paul de Groot told me he was building texture attributes into OpendTect, dGB's awesome, free, open source seismic interpretation tool. And this morning, the news came: OpendTect 4.4.0e is out, and it has Haralick textures! Happy Christmas, indeed. Thank you, dGB.

Parameters

There are 4 parameters to set, other than selecting an attribute. Choose a time gate and a kernel size, and the number of grey levels to reduce the image to (either 16 or 32 — more options might be nice here). You also have to choose the dynamic range of the data — don't go too wide with only 16 grey levels, or you'll throw almost all your data into one or two levels. Only the time gate and kernel size affect the run time substantially, and you'll want them to be big enough to capture your textures. 

Reference
West, B, S May, J Eastwood, and C Rossen (2002). Interactive seismic faces classification using textural attributes and neural networks. The Leading Edge, October 2002. DOI: 10.1190/1.1518444

The seismic dataest is the F3 offshore Netherlands volume from the Open Seismic Repository, licensed CC-BY-SA.

2012 retrospective

The end of the year is nigh — time for our self-indulgent look-back at 2012. The most popular posts, not counting appearances on the main page. Remarkably, Shale vs tight has about twice the number of hits of the second place post. 

  1. Shale vs tight, 1984 visits

  2. G is for Gather, 1090 visits (to permalink)

  3. What do you mean by average?, 1008 visits (to permalink)

The most commented-on posts are not necessarily the most-read. This is partly because posts get read for months after they're written, but comments tend to come right away. 

  1. Are conferences failing you too? (16 comments)

  2. Your best work(space) (13 comments)

  3. The Agile toolbox (13 comments)

Personal favourites

Evan

Matt

Where our readers come from

The distribution of readers is global, but has a power law distribution. About 75% of our readers this year were from one of nine countries: USA, Canada, UK, Australia, Norway, India, Germany, Indonesia, and Russia. Some of those are big countries, so we should correct for population—let's look at the number of Agile blog readers per million citizens:

2012_blog_readers_logscale.png
  1. Norway — 292

  2. Canada — 283

  3. Australia — 108

  4. UK — 78

  5. Qatar — 72

  6. Brunei — 67

  7. Ireland — 57

  8. Iceland — 56

  9. Denmark — 46

  10. Netherlands — 46

So we're kind of a big deal in Norway. Hei hei Norge! Kansje vi skulle skrive på norsk herifra.

Google Analytics tells us when people visit too. The busiest days are Tuesday, Wednesday, and Thursday, then Monday and Friday. Weekends are just crickets. Not surprisingly, the average reading time rises monotonically from Monday to Friday — reaching a massive 2:48 on Fridays. (Don't worry, dear manager, those are minutes!)

What we actually do

We don't write much about our work on this blog. In brief, here's what we've been up to:

  • Volume interpretation and rock physics for a geothermal field in southern California

  • Helping the Government of Canada get some of its subsurface data together

  • Curating subsurface content in a global oil & gas company's corporate wiki

  • Getting knowledge sharing off the ground at a Canadian oil & gas company

Oh yeah, we did launch this awesome little book too. That was a proud moment. 

We're looking forward to a fun-filled, idea-jammed, bee-busy 2013 — and wish the same for you. Thank you for your support and encouragement this year. Have a fantastic Yuletide.

Ten ways to spot pseudogeophysics

Geophysicists often try to predict rock properties using seismic attributes — an inverse problem. It is difficult and can be complicated. It can seem like black magic, or at least a black box. They can pull the wool over their own eyes in the process, so don’t be surprised if it seems like they are trying to pull the wool over yours. Instead, ask a lot of questions.

Questions to ask

  1. What is the reliability of the logs that are inputs to the prediction? Ask about hole quality and log editing.
  2. What about the the seismic data? Ask about signal:noise, multiples, bandwidth, resolution limits, polarity, maximum offset angle (for AVO studies), and processing flow (e.g. Emsley, 2012).
  3. What is the quality of the well ties? Is the correlation good enough for the proposed application?
  4. Is there any physical reason why the seismic attribute should predict the proposed rock property? Was this explained to you? Were you convinced?
  5. Is the proposed attribute redundant (sensu Barnes, 2007)? Does it really give better results than a less sexy approach? I’ve seen 5-minute trace integration outperform month-long AVO inversions (Hall et al. 2006).
  6. What are the caveats and uncertainties in the analysis? Is there a quantitative, preferably Bayesian, treatment of the reliability of the predictions being made? Ask about the probability of a prediction being wrong.
  7. Is there a convincing relationship between the rock property (shear impedance, say) and some geologically interesting characteristic that you actually make decisions with, e.g. frackability.
  8. Is there a convincing relationship between the rock property and the seismic attribute at the wells? In other words, does the attribute actually correlate with the property where we have data?
  9. What does the low-frequency model look like? How was it made? Its maximum frequency should be about the same as the seismic data's minimum, no more.
  10. Does the geophysicist compute errors from the training error or the validation error? Training errors are not helpful because they beg the question by comparing the input training data to the result you get when you use those very data in the model. Funnily enough, most geophysicists like to show the training error (right), but if the model is over-fit then of course it will predict very nicely at the well! But it's the reliability away from the wells we are interested in, so we should examine the error we get when we pretend the well isn't there. I prefer this to witholding 'blind' wells from the modeling — you should use all the data. 

Lastly, it might seem harsh but we could also ask if the geophysicist has a direct financial interest in convincing you that their attribute is sound, as well as the normal direct professional interest. It’s not a problem if they do, but be on your guard — people who are selling things are especially prone to bias. It's unavoidable.

What do you think? Are you bamboozled by the way geophysicists describe their predictions?

References
Barnes, A (2007). Redundant and useless seismic attributes. Geophysics 72 (3), p P33–P38. DOI: 10.1190/1.2370420.
Emsley, D. Know your processing flow. In: Hall & Bianco, eds, 52 Things You Should Know About Geophysics. Agile Libre, 2012. 
Hall, M, B Roy, and P Anno (2006). Assessing the success of pre-stack inversion in a heavy oil reservoir: Lower Cretaceous McMurray Formation at Surmont. Canadian Society of Exploration Geophysicists National Convention, Calgary, Canada, May 2006. 

The image of the training error plot — showing predicted logs in red against input logs — is from Hampson–Russell's excellent EMERGE software. I'm claiming the use of the copyrighted image is fair use.  

The digital well scorecard

In my last post, I ranted about the soup of acronyms that refer to well log curves; a too-frequent book-keeping debacle. This pain, along with others before it, has motivated me to design a solution. At this point all I have is this sketch, a wireframe of should-be software that allows you visualize every bit of borehole data you can think of:

The goal is, show me where the data is in the domain of the wellbore. I don't want to see the data explicitly (yet), just its whereabouts in relation to all other data. Data from many disaggregated files, reports, and so on. It is part inventory, part book-keeping, part content management system. Clear the fog before the real work can begin. Because not even experienced folks can see clearly in a fog.

The scorecard doesn't yield a number or a grade point like a multiple choice test. Instead, you build up a quantitative display of your data extents. With the example shown above, I don't even have to look at the well log to tell you that you are in for a challenging well tie, with the absence of sonic measurements in the top half of the well. 

The people that I showed this to immediately undestood what was being expressed. They got it right away, so that bodes well for my preliminary sketch. Can you imagine using a tool like this, and if so, what features would you need? 

Swimming in acronym soup

In a few rare instances, an abbreviation can become so well-known that it is adopted into everyday language; more familar than the words it used to stand for. It's embarrasing, but I needed to actually look up LASER, and you might feel the same way with SONAR. These acronyms are the exception. Most are obscure barriers to entry in technical conversations. They can be constructs for wielding authority and exclusivity. Welcome to the club, if you know the password.

No domain of subsurface technology is riddled with more acronyms than well log analysis and formation evaluation. This is a big part of — perhaps too much of a part of — why petrophysics is hard. Last week, I came across a well. It has an extended suite of logs, and I wanted make a synthetic. Have a glance at the image and see which curve names you recognize (the size represents the frequency the names are encountered across many files of the same well).

I felt like I was being spoken to by some earlier deliquent: I got yer well logs right here buddy. Have fun sorting this mess out.

The log ASCII standard (*.LAS file) file format goes a long way to exposing descriptive information in the header. But this information is often incomplete, missing, and says nothing about the quality or completeness of the data. I had to scan 5 files to compile this soup. A micro-travesty and a failure, in my opinion. How does one turn this into meaningful information for geoscience?

Whose job is it to sort this out? The service company that collected the data? The operator that paid for it? A third party down the road?

What I need is not only an acronym look-up table, but also a data range tool to show me what I've got in the file (or files), and at which locations and depths I've got it. A database to give me more information about these acronyms would be nice too, and a feature that allows me to compare multiple files, wells, and directories at once. It would be like a life preserver. Maybe we should build it.

I made the word cloud by pasting text into wordle.net. I extracted the text from the data files using the wonderful LASReader written by Warren Weckesser. Yay, open source!

How to make a geologist happy

It's that time of year! Students are sitting exams, the northern oil patch is mobilizing, my boatshed office gets a bit chilly, and everyone is talking about AGU. And friends of geologists start wondering what the heck to get for them this Yuletide.

For the diehard field geologist

Maps are the field geoscientist's most basic tool. I have a soft spot for beautiful old maps. And beautiful maps are beautiful. Also expensive. But also beautiful.

A balloon flight over somewhere as geologically remarkable as Cappadocia (right), the Grand CanyonMalham Cove, or the Bay of Fundy would give anyone, geologist or not, something to remember forever. Especially if they are terrified of heights. 

I can't even tell you how much I want a portable Geiger–Müller counter. Almost as much as I want one of Little River's stream tables in my garage. (You could always start off with a budget version). Those Little River guys caused quite a stir with their scale bar pencils last year — you'll have to call them for one, but in the meantime, the forensic photography world has lots of nice scales for the field and lab.

Gifts in spaaaace

Small things are awesome. (Did you see our post last week about Robert Hooke? He liked small things.) You can look at small things all day with this nifty digital microscope. Need something cool to look at? Get some little pieces of scrap metal. From space. Especially this beauty from Manitoba. (How good did you say you've been?)

Geologists aren't exactly sartorially renowned — unless there's GoreTex to be had, obviously — and T-shirts are de rigueur in all conceivable social situations. Avoid that tempting Schist Happens slogan and go for awesome design instead. Like these nice cross-sections (below), only slightly spoiled by the lettering and those dodgy sleeves. I think the peace sign is my favourite. The mineral samples are pretty great though.

If you like textiles, but not tees, try some geological embroidery.

Wrap up and read

T-shirts, while practical and (sometimes) cool, aren't seasonal apparel in every part of the world. We Canadian geologists mostly don chunky jumpers and stay indoors in the winter. So what we need is books. Here's a book about geology and whisky — an ethereal combination. (Read it with a glass of this lovely stuff). And here's a beautiful book of Postcards From Mars. Want something more arty? Andy Goldsworthy is your man (left). And finally, in a shameless plug, who doesn't want to know more about geophysics?

Still stuck? Check our reading list. Not good enough? There are lots more ideas in our 2011 giftology and 2010 giftophysics posts. And you'll find even more geeky awesomeness over at Georneys. If, after all that, you spot something even more giftological, please tell us about it in the comments!

The photo of balloons over Cappadocia is licensed CC-BY-NC by Flickr user Stephen Oung. The T-shirt images are copyright of their respective owners and assumed to be fair use. The Goldsworthy image is licensed CC-BY-SA by Wikipedia user mikeanegus