x lines of Python: Loading images

Difficulty rating: Beginner

We'd often like to load images into Python. Once loaded, we might want to treat them as images, for example cropping them, saving in another format, or adjusting brightness and contrast. Or we might want to treat a greyscale image as a two-dimensional NumPy array, perhaps so that we can apply a custom filter, or because the image is actually seismic data.

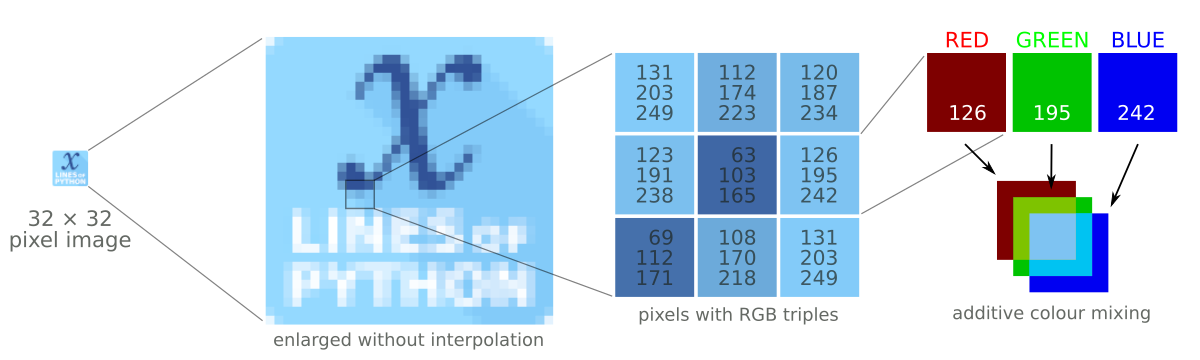
This image-or-array duality is entirely semantic — there is really no difference between images and arrays. An image is a regular array of numbers, or, in the case of multi-channel rasters like full-colour images, a regular array of several numbers: one for each channel. So each pixel location in an RGB image contains 3 numbers:

raster_with_RGB_triples.png

In general, you can go one of two ways with images:

  1. Load the image using a library that 'knows about' (i.e. uses language related to) images. The preeminent tool here is pillow (which is a fork of the grandparent of all Python imaging solutions, PIL).
  2. Load the image using a library that knows about arrays, like matplotlib or scipy. These wrap PIL, making it a bit easier to use, but potentially losing some options on the way.

The Jupyter Notebook accompanying this post shows you how to do both of these things. I recommend learning to use some of PIL's power, but knowing about the easier options too.

Here's the way I generally load an image:

 
from PIL import Image
im = Image.open("my_image.png")

(One strange thing about pillow is that, while you install it with pip install pillow, you still actually import and use PIL in your code.) This im is an instance of PIL's Image class, which is a data structure especially for images. It has some handy methods, like im.crop(), im.rotate(), im.resize(), im.filter(), im.quantize(), and lots more. Doing some of these operations with NumPy arrays is fiddly — hence PIL's popularity.

But if you just want your image as a NumPy array:

 
import numpy as np
arr = np.array(im)

Note that arr is a 3-dimensional array, the dimensions being row, column, channel. You can go off with arr and do whatever you need, then cast back to an Image with Image.fromarray(arr).

All this stuff is demonstrated in the Notebook accompanying this post, or you can use one of these links to run it right now in your browser:

Binder   Run the accompanying notebook in MyBinder


Advice for a new hacker

So you’ve signed up for a hackathon — or maybe you’ve seen an event and you’re still thinking about it.

First thing: I can almost guarantee that you will not regret it, so if you haven’t committed yet, I challenge you to go and sign up now.

But even once you’ve chosen to go, maybe you feel nervous about your skills, or are worried about spending two days with strangers, or aren’t sure about the idea of competitive coding. Someone asked me recently how to prepare — technically and mentally — for the event.

I should say that I’ve only participated in a couple of hackathons, so I definitely don’t know everything there is to know. But I have organized more than 20 hackathons, and helped people skill up for them and (I hope!) enjoy them. Here are the top 10-ish things you can to do to get the most out of the event:

  1. Brush up on your coding. Before the event, find out a bit about what kinds of projects are in the offing. If it’s a machine learning theme, brush up on your data science. Maybe image processing or text processing will be needed. Data management skills and database manipulation are always appreciated. Familiarty with a cloud environment, e.g. AWS, will help.

  2. Find a friend. Either take someone with you, or find a friendly face when you get there. It’s 100% possible to navigate the experience on your own, but much more fun with a partner.

  3. Dive in. You get out of the event what you put in. It’s like most learning experiences. You need an open mind, an enthusiastic demeanour, and a can-do attitude.

  4. Contribute. There’s never enough time, so you are a much-needed part of your team, but unless there’s a strong effort to coordinate the project, it’ll be a bit unstructured. You’ll have to take the initiative on things.

  5. Use a kanban. To help team members see the big picture and select tasks for themselves, put them on stickies on a nearby board. Make 3 areas: ‘to do’, ‘in progress’ and ‘done’. The goal is to move them from left to right.

  6. Ask for help. Every event Agile runs has non-hackers around to help out with stuff — anything from dietary needs to datasets to coding advice. Don’t get stuck on something, find someone to help you.

  7. Take breaks. You and your team should go for a short walk every 90 minutes or so. Relax a bit, but also get caught up: get progress reports from everyone, re-evaluate the goals, identify issues. You will find more clarity away from your keyboards.

  8. Work backwards from the demo. A good strategy is to outline what would make a killer demo of the project you have selected. Include at least one “Wow” feature if at all possible. Then work out what you need to either fake or build to make that demo. Build what you can, fake the rest.

  9. Check in with the other teams. This might not fly at highly competitive events, but at more casual affairs or if everyone is working on different projects, try chatting to some other teams, especially during breaks.

  10. Label your equipment. Hackathons are pretty chaotic, and although 99.9% of hackers are awesome, it’s still a roomful of strangers, so label the gear you care about. And of course keep your phone and computer locked.

  11. Reciprocate. Almost all these bits of advice have corollaries: be friendly and welcoming, accept contributions from others, give help if asked, and so on. Hackathons are social events as much as technical ones — enjoy meeting and collaborating with others.

If you have signed up for an event — I hope you love it! Do let us know how you get along. Or, if you’ve already been to a hackathon and have some advice to share — leave a comment below.


If you’re looking for an event to go to and you’re in western Europe — here’s one! It’s the FORCE Machine Learning Hackathon in Stavanger, Norway. I recently wrote about it — check it out.

If you’re looking for subsurface or geoscience project ideas, then I have a lot of reading for you. Check out the long list of hackathons reports on this blog. You can also dive into the Software Underground Slack to discuss project ideas there.

x lines of Python: Physical units

Difficulty rating: Intermediate

Have you ever wished you could carry units around with your quantities — and have the computer figure out the best units and multipliers to use?

pint is a nice, compact library for doing just this, handling all your dimensional analysis needs. It can also detect units from strings. We can define our own units, it knows about multipliers (kilo, mega, etc), and it even works with numpy and pandas.

To use it in its typical mode, we import the library then instantiate a UnitRegistry object. The registry contains lots of physical units:

 
import pint
units = pint.UnitRegistry()
thickness = 68 * units.m

Now thickness is a Quantity object with the value <Quantity(68, 'meter')>, but in Jupyter we see a nice 68 meter (as far as I know, you're stuck with US spelling).

Let's make another quantity and multiply the two:

 
area = 60 * units.km**2
volume = thickness * area

This results in volume having the value <Quantity(4080, 'kilometer ** 2 * meter')>, which pint can convert to any units you like, as long as they are compatible:

 
>>> volume.to('pint')
8622575788969.967 pint

More conveniently still, you can ask for 'compact' units. For example, volume.to_compact('pint') returns 8.622575788969966 terapint. (I guess that's why we don't use pints for field volumes!)

There are lots and lots of other things you can do with pint; some of them — dealing with specialist units, NumPy arrays, and Pandas dataframes — are demonstrated in the Notebook accompanying this post. You can use one of these links to run this right now in your browser if you like:

Binder   Run the accompanying notebook in MyBinder

Open In Colab   Run the notebook in Google Colaboratory (note the install cell at the beginning)

That's it for pint. I hope you enjoy using it in your scientific computing projects. If you have your own tips for handling units in Python, let us know in the comments!


There are some other options for handling units in Python:

  • quantities, which handles uncertainties without also needing the uncertainties package.
  • astropy.units, part of the large astropy project, is popular among physicists.

The hack returns to Norway

Last autumn Agile helped Peter Bormann (ConocoPhillips Norge) and the FORCE consortium host the first geo-flavoured hackathon in Norway. Maybe you were there, or maybe you read about the nine fascinating machine learning projects here on the blog. If so, you’ll know it was a great event, so we’re doing it again!

Hackthon: 18 and 19 September
Symposium: 20 September


Check out last year’s projects here. Projects included Biostrat!, Virtual Metering, sketch2seis, and AVO ML — a really interesting AVO approach exploiting latent spaces (see image, right). Most of them are on GitHub and could be extended this year.

Part of what I love about these things is that we have no idea what the projects will be. As last year, there’ll be a pre-hackathon meetup in Storhaug the evening before Day 1 (on 17 September) — we’ll figure it all out there. In the meantime, if you have an idea check out the link at the end of this post where you can share and discuss it with others.


20180919_FUJ8654.jpg

The hackathon will be followed by a one-day symposium on machine learning in the subsurface (left). This well attended event was also excellent last year, and promises to deliver again in 2019. Peter did a briliant job of keeping things rooted in real results from real research, so you won’t be subjected to the parade of marketing talks you might have been subjected to at certain other conferences.


Find out more and sign up on NPD.no! Don’t delay; places are limited.

Submit and discuss project ideas on Agile’s Events page. Note that this does not sign you up for the event.

Get on softwareunderground.com/slack to discuss the event in the #force-hack-2019 channel.

See you there!

Impact structures in seismic

I saw this lovely tweet from PGS yesterday:

Kudos to them for sharing this. It’s always great to see seismic data and interpretations on Twitter — especially of weird things. And impact structures are just cool. I’ve interpreted them in seismic myself. Then uninterpreted them.

I wish PGS were able to post a little more here, like a vertical profile, maybe a timeslice. I’m sure there would be tons of debate if we could see more. But not all things are possible when it comes to commercial seismic data.

It’s crazy to say more about it without more data (one-line interpretation, yada yada). So here’s what I think.


Impact craters are rare

There are at least two important things to think about when considering an interpretation:

  1. How well does this match the model? (In this case, how much does it look like an impact structure?)

  2. How likely are we to see an instance of this model in this dataset? (What’s the base rate of impact structures here?)

Interpreters often forget about the second part. (There’s another part too: How reliable are my interpretations? Let’s leave that for another day, but you can read Bond et al. 2007 as homework if you like.)

The problem is that impact structures, or astroblemes, are pretty rare on Earth. The atmosphere takes care of most would-be meteorites, and then there’s the oceans, weather, tectonics and so on. The result is that the earth’s record of surface events is quite irregular compared to, say, the moon’s. But they certainly exist, and occasionally pop up in seismic data.

In my 2011 post Reliable predictions of unlikely geology, I described how skeptical we have to be when predicting rare things (‘wotsits’). Bayes’ theorem tells us that we must modify our assigned probability (let’s say I’m 80% sure it’s a wotsit) with the prior probability (let’s pretend a 1% a priori chance of there being a wotsit in my dataset). Here’s the maths:

\( \ \ \ P = \frac{0.8 \times 0.01}{0.8 \times 0.01\ +\ 0.2 \times 0.99} = 0.0388 \)

In other words, the conditional probability of the feature being a rare wotsit, given my 80%-sure interpretation, is 0.0388 or just under 4%.

As cool as it would be to find a rare wotsit, I probably need a back-up hypothesis. Now, what’s that base rate for astroblemes? (Spoiler: it’s much less than 1%.)

Just how rare are astroblemes?

First things first. If you’re interpreting circular structures in seismic, you need to read Simon Stewart’s paper on the subject (Stewart 1999), and his follow-up impact crater paper (Stewart 2003), which expands on the topic. Notwithstanding Stewart’s disputed interpretation of the Silverpit not-a-crater structure in the North Sea, these two papers are two of my favourites.

According to Stewart, the probability P of encountering r craters of diameter d or more in an area A over a time period t years is given by:

\( \ \ \ P(r) = \mathrm{e}^{-\lambda A}\frac{(\lambda A)^r}{r!} \)

where

\( \ \ \ \lambda = t n \)

and

\( \ \ \ \log n = - (11.67 \pm 0.21) - (2.01 \pm 0.13) \log d \)

Astrobleme_prob.png

We can use these equations to compute the probability plot on the right. It shows the probability of encountering an astrobleme of a given diameter on a 2400 km² seismic survey spanning the Phanerozoic. (This doesn’t take into account anything to do with preservation or detection.) I’ve estimated that survey size from PGS’s tweet, and I’ve highlighted the 7.5 km diameter they mentioned. The probability is very small: about 0.00025. So Bayes tells us that an 80%-confident interpretation has a conditional probability of about 0.001. One in a thousand.

Here’s the Jupyter notebook I used to make that chart using Python.

So what?

My point here isn’t to claim that this structure is not an astrobleme. I haven’t seen the data, I’ve no idea. The PGS team mentioned that they considered the possiblity of influence by salt or shale, and fluid escape, and rejected these based on the evidence.

My point is to remind interpreters that when your conclusion is that something is rare, you need commensurately more and better evidence to support the claim. And it’s even more important than usual to have multiple working hypotheses.

Last thing: if I were PGS and this was my data (i.e. not a client’s), I’d release a little cube (anonymized, time-shifted, bit-reduced, whatever) to the community and enjoy the engagement and publicity. With a proper license, obviously.


References

Hughes, D, 1998, The mass distribution of the crater-producing bodies. In Meteorites: Flux with time and impact effects, Geological Society of London Special Publication 140, 31–42.

Davis, J, 1986, Statistics and data analysis in geology, John Wiley & Sons, New York.

Stewart, SA (1999). Seismic interpretation of circular geological structures. Petroleum Geoscience 5, p 273–285.

Stewart, SA (2003). How will we recognize buried impact craters in terrestrial sedimentary basins? Geology 31 (11), p 929–932.