5 ways to kickstart an interpretation project

Last Friday, teams around the world started receiving external hard drives containing this year's datasets for the AAPG's Imperial Barrel Award (IBA for short). I competed in the IBA in 2008 when I was a graduate student at the University of Alberta. We were coached by the awesome Dr Murray Gingras (@MurrayGingras), we won the Canadian division, and we placed 4th in the global finals. I was the only geophysical specialist on the team alongside four geology graduate students.

Five things to do

Whether you are a staff geoscientist, a contractor, or competitor, it can help to do these things first:

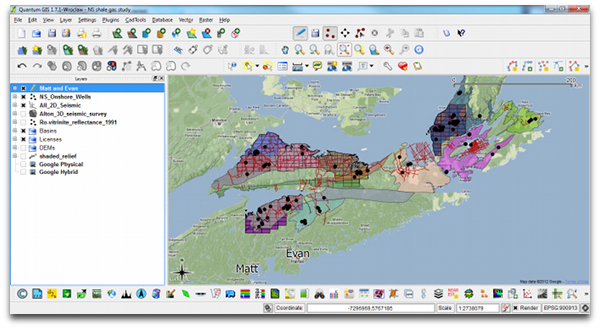
  1. Make a data availability map (preferably in QGIS or ArcGIS). A graphic and geospatial representation of what you have been given.
  2. Make well scorecards: as a means to demonstrate not only that you have wells, but what information you have within the wells.
  3. Make tables, diagrams, maps of data quality and confidence. Indicate if you have doubts about data origins, data quality, interpretability, etc.
  4. Background search: The key word is search, not research. Use Mendeley to organize, tag, and search through the array of literature
  5. Use Time-Scale Creator to make your own stratigraphic column. You can manipulate the vector graphic, and make it your own. Much better than copying an old published figure. But use it for reference.

All of these things can be done before assigning roles, before saying who needs to do what. All of this needs to be done before the geoscience and the prospecting can happen. To skirt around it is missing the real work, and being complacent. Instead of being a hammer looking for a nail, lay out your materials, get a sense of what you can build. This will enable educated conversations about how you can spend your geoscientific manpower, division of labour, resources, time, etc.

Read more, then go apply it 

In addition to these tips for launching out of the blocks, I have also selected and categorized blog posts that I think might be most relevant and useful. We hope they are helpful to all geoscientists, but especially for students. Visit the Agile blog highlights list on SubSurfWiki.

I wish a happy and exciting IBA competition to all participants, and their supporting university departments. If you are competing, say hi in the comments and tell us where you hail from. 

Great geophysicists #7: Leonhard Euler

Leonhard Euler (pronounced 'oiler') was born on 15 April 1707 in Basel, Switzerland, but spent most of his life in Berlin and St Petersburg, where he died on 18 September 1783. Has was blind from the age of 50, but took this handicap stoically—when he lost sight in his right eye at 28 he said, "Now I will have less distraction".

It's hard to list Euler's contributions to the toolbox we call seismic geophysics—he worked on so many problems in maths and physics. For example, much of the notation we use today was invented or at least popularized by him: (x), e, i, π. He reconciled Newton's and Liebnitz's versions of calculus, making huge advances in solving difficult real-world equations. But he made some particularly relevant advances that resonate still:

  • Leonardo and Galileo both worked on mechanical stress distribution in beams, but didn't have the luxuries of calculus or Hooke's law. Daniel Bernoulli and Euler developed an isotropic elastic beam theory, and eventually convinced people you could actually build things using their insights. 
  • Euler's equations of fluid dynamics pre-date the more complicated (i.e. realistic) Navier–Stokes equations. Nonetheless, this work continued into vibrating strings, getting Euler (and Bernoulli) close to a general solution of the wave equation. They missed the mark, however, leaving it to Jean-Baptiste le Rond d'Alembert
  • optics (also wave behaviour). Though many of Euler's ideas about dispersion and lenses turned out to be incorrect (e.g. Pedersen 2008, DOI 10.1162/posc.2008.16.4.392), Euler did at least progress the idea that light is a wave, helping scientists move away from Newton's corpuscular theory.

The moment of Euler's death was described by the Marquis de Condorcet in a eulogy:

He had full possession of his faculties and apparently all of his strength... after having enjoyed some calculations on his blackboard concerning the laws of ascending motion for aerostatic machines... [he] spoke of Herschel's planet and the mathematics concerning its orbit and a little while later he had his grandson come and play with him and took a few cups of tea, when all of a sudden the pipe that he was smoking slipped from his hand and he ceased to calculate and live.

"He ceased to calculate," I love that.

Blurry vision and refractive power

I'm getting LASIK eye surgery today, so I've been preparing myself by learning about the eye's optics, and the surgical procedure that enhances handicapped eyes like my own. Unsurprisingly, there are some noteworthy parallels with seismic.

The eye as a gather

The human eye is akin to a common-depth point (CDP) gather. Both are like cameras constructed to focus rays at an imaging point. The retina, in the case of the eye; the reflection boundary in the case of the gather. In the eye, there are exactly four refracting interfaces at which light rays bend towards the midline and ultimately converge on the retina. In the earth, there an unknown number of interfaces, surely more than four.

Myopia, or near-sightedness, is the condition where images are focused just in front of the retina. Hyperopia, or far-sightedness, is the condition where the eyeball is too short and images would be focused behined the retina. The structure and density of the tissues in the eye have to be aligned just so, for perfect vision. If any combination of them are out of whack, you get blurry vision. Really blurry, in my case.

Characterizing blurry vision can be thought of as a two step process of measurement and validation. First, measurements of the refractive power of the eye are made with an autorefractor; quantifying the amount of first order correction needed. The correction is applied, verified, and fine-tuned by a qualitative visual assessment test. The measurement gets you close to the perfect correction; any residual adjustments may be negligible or imperceptible. And the patient, a subjective observer, is the final judge of clarity and quality of vision.

Four corrections

There are at least four ways to correct for common vision problems. Each is a different way to force the ray geometry:

  • refract the light before it enters the eye (glasses),
  • refract the light just above the cornea (contact lenses), 
  • change the shape of the cornea using LASIK or PRK surgery, or 
  • change the shape or structure of the lens (cataract surgery or implants). 

If the earth were an eye

Seismic processing is the act of measuring the refractive structure of the earth, and correcting for it's natural blurryness. Static correction, is done first in an effort to align the rays into a plane wave before it enters the 'eye'. Seismic velocity analysis is carried out on the rays, as a crude measurement of the earth's 'refractive power'. Migration, is the process of forcing geometries, mathematically instead of surgically, in order to rearrange ray paths to improve focusing. Generally speaking it's the same two-step process: measurement and validation. As with the eye, the quality of the final image is a perceptual one, coming down to subjective visual assessment. But unlike the eye, fortunately, multiple observers can share the same image, talk about it even. Changing the entire discussion about what acuity really means.

The process of vision correction goes sequentially from low order to high order. In the next post I will talk about higher order anomalies within the eye, that, once corrected, can cause super-human vision. Measurements and maps of how the eye sees show surgeons how to correct optical images. In the same vein, measurements and maps of how the seismic experiment sees, show geophysicists how to correct images in the seismic realm.

The plainest English

If you're not already reading xkcd — the must-read sciencey thrice-weekly comic strip — then please give it a try. It's good for you. Check out this wonderful description of the Saturn V rocket, aka Up Goer Five, using only the 1000 most common words in English →

This particular comic took on a life of its own last week, when Theo Sanderson built a clever online text editor that parses your words and highlights the verboten ones. Then, following the lead of @highlyanne, a hydrologist, scientists all over Twitter quickly started describing and sharing parsimonious descriptions of what they do. Anne and her partner in crime, @Allochthonous, then compiled a log of every description they could find. It's worth looking at, though it would take a while to read them all. 

What's it like using only the simplest words? I tried to define a well...

A deep, round, empty space in the ground that is only about as wide as your hand. The empty space is very deep: up to about seven tens of hundreds of times as deep as a man is tall. It is full of water. After making the empty space, we can lower small computers into it. As we pull them out, the computers tell us things about the rocks they can 'see' — like how fast waves move through them, or how much water the rocks have in them.

It's quite hard. But refreshingly so. Here's reflection seismic...

We make a very loud, short sound on the land or in the water — like a cracking sound. The sound waves go down through the rocks under the ground. As they do so, some of them come back — just as waves come back from the side of a body of water when you throw in a small rock. We can listen to the sound waves that come back, and use a computer to help make a picture of what it looks like under the ground.

Is a world without jargon dumbed down, or opened up? What is it we do again?...

It is very hard to do this work. It takes a lot of money and a long time. The people that do it have to think hard about how to do it without hurting other people or the world we live in. We don't always manage to do it well, but we try to learn from the past so we can do better next time. Most people think we should stop, but if we did, the world would go dark, our homes would be cold (or hot), and people would not be able to go very far.

Check out Up Goer Six — Theo's new editor that colour codes each word according to just how common it is. Try it — what do you do for a living? 

The image is licensed CC-BY-NC-2.5 by Randall Munroe at xkcd.com.

The effective medium

Last time, I wrote about the standard-issue composite display used in formation evaluation. The so-called Triple Combo is used to delineate each of the earth's porous media constituents in its own track. But it fails to deliver information about the whole rock, the net effect of all its parts. In contrast, an effective medium property, or bulk property, is one that represents the net effect of all constituents, an aggregate of all three. Examples of effective medium properties are:

  • –P-wave and S-wave velocity
  • –Bulk density
  • –Acoustic impedance and shear impedance
 

Effective properties are what seismic and other geophysical methods are sensitive to. As such, one of the goals of seismic rock physics is to establish site-specific relationships between the elements in the Triple Combo and seismic properties. Link constituents in 1D with effective measurements in 2D or 3D. 

Determining relationships between the Triple Combo and effective media properties is fraught with challenges. Earth materials are complex, have infinite compositional and textural variation, and are unpredictable even. Try modeling a DT log from gamma-ray, resistivity, and neutron and you will likely fail. Therefore, empirical methods are the only way to accurately characterize complex effective media. Another benefit and by-product of drilling and logging wells.

The Triple Combo doesn't inform how rocks, pores, and fluids affect seismic properties. Sonic (DT) and bulk density (RHOB), on the other hand, can be used to compute seismic properties exactly. They are just as important as the Triple Combo. Got a change from shale to sand? Or gas to brine? It's not an "effective" change if the impedance contrast is small or the layer too thin. Formation evaluation can be done by looking at individual elements, but geophysics sees the effective media as a whole. So to bridge the two, you need measurements that deliver the aggregate of all three. 

Rocks, pores and fluids

At an SEG seismic rock physics conference in China several years ago, I clearly remember a catch phrase used by one of the presenters, "It's all about rocks, pores, and fluids." He used it several times throughout his talk as an invocation for geophysicists to translate their seismic measurements of the earth into terms that are more appealing to others. Nobody cares about the VP/VS ratio in a reservoir. Even though I found the repetition slightly off-putting, he succeeded—the phrase stuck. It's all about rock, pores, and fluids.

Fast forward to the SEG IQ Earth Forum a few months ago. The message reared its head again, but in a different form. After dinner one evening, I was speaking with Ran Bachrach about advances in seismic rock physics technology: the glamour and the promise of the state-of-the-art. It was a topic right up his alley, but suprisingly, he seemed ambivalent and under-enthused. Which was unusual for him. "More often than not," he said, "we can get all the information we need from the triple combo." 

What is the triple combo? 

I felt embarrased that I had never heard of the term. Like I had been missing something this whole time. The triple combo is the standard set of measurements used in formation evaluation and wireline logging: gamma-ray, porosity, and resistivity. Simply put, the triple combo tells us about rocks, pores, and fluids. 

I find it curious that the very things we are interested in are impossible to measure directly. For example:

  • A gamma-ray log measures naturally occuring radioactive minerals. We use this to make inferences about lithology.
  • A neutron log measures Compton scattering in proportion to the number of hydrogen atoms. This is a proxy for pores.
  • A resistivity log measures the conductivity of electrical current. We use this to tell us about fluid type and saturation.

Subsurface geotechnology isn't only about recording the earth's constituents in isolation. Some measurements, the sonic log for instance, are useful because of the fact that they are an aggregate of all three.

The well log is a section of the Thebaud_E-74 well available from the offshore Nova Scotia Play Fairway Analysis.

Must-read geophysics blogs

Tuesday's must-read list was all about traditional publishing channels. Today, it's all about new media.

If you're anything like me before Agile, you don't read a lot of blogs. At least, not ones about geophysics. But they do exist! Get these in your browser favourites, or use a reader like Google Reader (anywhere) or Flipboard (on iPad).

Seismos

Chris Liner, a geophysics professor at the University of Arkansas, recently moved from the University of Houston. He's been writing Seismos, a parallel universe to his occasional Leading Edge column, since 2008.

MyCarta

Matteo Niccoli (@My_Carta on Twitter) is an exploration geoscientist in Stavanger, Norway, and he recently moved from Calgary, Canada. He's had MyCarta: Geophysics, visualization, image processing and planetary science, since 2011. This blog is a must-read for MATLAB hackers and image processing nuts. Matteo was one of our 52 Things authors.

GeoMika

Mika McKinnon (@mikamckinnon), a geophysicist in British Columbia, Canada, has been writing GeoMika: Fluid dynamics, diasters, geophysics, and fieldwork since 2008. She's also into education outreach and the maker-hacker scene.

The Way of the Geophysicist

Jesper Dramsch (@JesperDramsch), a geophysicist in Hamburg, Germany has written the wonderfully personal and philosophical The Way of The Geophysicist since 2011. His tales of internships at Fugro and Schlumberger provide great insights for students.

VatulBlog

Maitri Erwin (@maitri), an exploration geoscientist in Texas, USA. She has been blogging since 2001 (surely some kind of record), and both she and her unique VatulBlog: From Kuwait to Katrina and beyond defy categorization. Maitri was also one of our 52 Things authors. 

There are other blogs on topics around seismology and exploration geophysics — shout outs go to Hypocentre in the UK, the Laboratoire d'imagerie et acquisition des mesures géophysiques in Quebec, occasional seismicky posts from sedimentologists like @zzsylvester, and the panoply of bloggery at the AGU. Stick those in your reader!

Must-read geophysics

If you had to choose your three favourite, most revisited, best remembered papers in all of exploration geophysics, what would you choose? Are they short? Long? Full of math? Well illustrated? 

Keep it honest

Barnes, A (2007). Redundant and useless seismic attributes. Geophysics 72 (3). DOI:10.1190/1.2716717
Rarely do we see engaging papers, but they do crop up occasionally. I love Art Barnes's Redundant and useless seismic attributes paper. In this business, I sometimes feel like our opinions — at least our public ones — have been worn down by secrecy and marketing. So Barnes's directness is doubly refreshing:

There are too many duplicate attributes, too many attributes with obscure meaning, and too many unstable and unreliable attributes. This surfeit breeds confusion and makes it hard to apply seismic attributes effectively. You do not need them all.

And keep it honest

Blau, L (1936). Black magic in geophysical prospecting. Geophysics 1 (1). DOI:10.1190/1.1437076
I can't resist Ludwig Blau's wonderful Black magic geophysics, published 77 years ago this month in the very first issue of Geophysics. The language is a little dated, and the technology mostly sounds rather creaky, but the point, like Blau's wit, is as fresh as ever. You might not learn a lot of geophysics from this paper, but it's an enlightening history lesson, and a study in engaging writing the likes of which we rarely see in Geophysics today...

And also keep it honest

Bond, C, A Gibbs, Z Shipton, and S Jones (2007), What do you think this is? "Conceptual uncertainty" in geoscience interpretation. GSA Today 17 (11), DOI: 10.1130/GSAT01711A.1
I like to remind myself that interpreters are subjective and biased. I think we have to recognize this to get better at it. There was a wonderful reaction on Twitter yesterday to a recent photo from Mars Curiosity (right) — a volcanologist thought it looked like a basalt, while a generalist thought it more like a sandstone. This terrific paper by Clare Bond and others will help you remember your biases!

My full list is right here. I hope you think there's something missing... please edit the wiki, or put your personal favourites in the comments. 

The attribute figure is adapted from from Barnes (2007) is copyright of SEG. It may only be used in accordance with their Permissions guidelines. The Mars Curiosity figure is public domain. 

O is for Offset

Offset is one of those jargon words that geophysicists kick around without a second thought, but which might bewilder more geological interpreters. Like most jargon words, offset can mean a couple of different things: 

  • Offset distance, which is usually what is meant by simply 'offset'.
  • Offset angle, which is often what we really care about.
  • We are not talking about offset wells, or fault offset.

What is offset?

Sherriff's Encyclopedic Dictionary is characteristically terse:

Offset: The distance from the source point to a geophone or to the center of a geophone group.

The concept of offset only really makes sense in the pre-stack world — to field data and gathers. The traces in stacked data (everyday seismic volumes) combine data from many offsets. So let's look at the geometry of seismic acquisition. A map shows the layout of shots (red) and receivers (blue). We can define offset and azimuth A at the midpoint of every shot–receiver pair, on a map (centre) and in section (right):

Offset distance applies to traces. The offset distance is the straight-line distance from the vibrator, shot-hole or air-gun (or any other source) to the particular receiver that recorded the trace in question. If we know the geometry of the acquisition, and the size of the recording patch or length of the streamers, then we can calculate offset distance exactly. 

Offset angle applies to specific samples on a trace. The offset angle is the incident angle of the reflected ray that that a given sample represents. Samples at the top of a trace have larger offset angles than those at the bottom, even though they have the same offset distance. To compute these angles, we need to know the vertical distances, and this requires knowledge of the velocity field, which is mostly unknown. So offset angle is not objective, but a partly interpreted quantity.

Why do we care?

Acquiring longer offsets can help undershoot gaps in a survey, or image beneath salt canopies and other recumbent features. Longer offsets also helps with velocity estimation, because we see more moveout.

Looking at how the amplitude of a reflection changes with offset is the basis of AVO analysis. AVO analysis, in turn, is the basis of many fluid and lithology prediction techniques.

Offset is one of the five canonical dimensions of pre-stack seismic data, along with inline, crossline, azimuth, and frequency. As such, it is a key part of the search for sparsity in the 5D interpolation method perfected by Daniel Trad at CGGVeritas. 

Recently, geophysicists have become interested not just in the angle of a reflection, but in the orientation of a reflection too. This is because, in some geological circumstances, the amplitude of a reflection depends on the orientation with respect to the compass, as well as the incidence angle. For example, looking at data in both of these dimensions can help us understand the earth's stress field.

Offset is the characteristic attribute of pre-stack seismic data. Seismic data would be nothing without it.