February linkfest

The linkfest is back! All the best bits from the news feed. Tips? Get in touch.

The latest QGIS — the free and open-source GIS we use — dropped last week. QGIS v2.8 'Wien' has lots of new features like expressions in property fields, better legends, and colour palettes.

On the subject of new open-source software, I've mentioned Wayne Mogg's OpendTect plug-ins before. This time he's outdone himself, with an epic new plug-in providing an easy way to write OpendTect attributes in Python. This means we can write seismic attribute algorithms in Python, using OpendTect for I/O,project management, visualization, and interpretation. 

It's not open source, but Google Earth Pro is now free! The free version was pretty great, but Pro has a few nice features, like better measuring tools, higher resolution screen-grabs, movies, and ESRI shapefile import. Great for scoping field areas.

Speaking of fieldwork, is this the most amazing outcrop you've ever seen? Those are house-sized blocks floating around in a mass-transport deposit. If you want to know more, you're in luck, because Zane Jobe blogged about it recently.  (You do follow his blog, right?)

By the way, if sedimentology is your thing, for some laboratory eye-candy, follow SedimentExp on Twitter. (Zane's on Twitter too!)

If you like to look after your figures, Rougier et al. recently offered 10 simple rules for making them better. Not only is the article open access (more amazing: it's public domain), the authors provide Python code for all their figures. Inspiring.

Open, even interactive, code will — it's clear — be de rigueur before the decade is out. Even Nature is at it. (Well, I shouldn't say 'even', because Nature is a progressive publishing hose, at the same time as being part of 'the establishment'.) Take a few minutes to play with it... it's pretty cool. We have published lots of static notebooks, as has SEG; interactivity is coming!

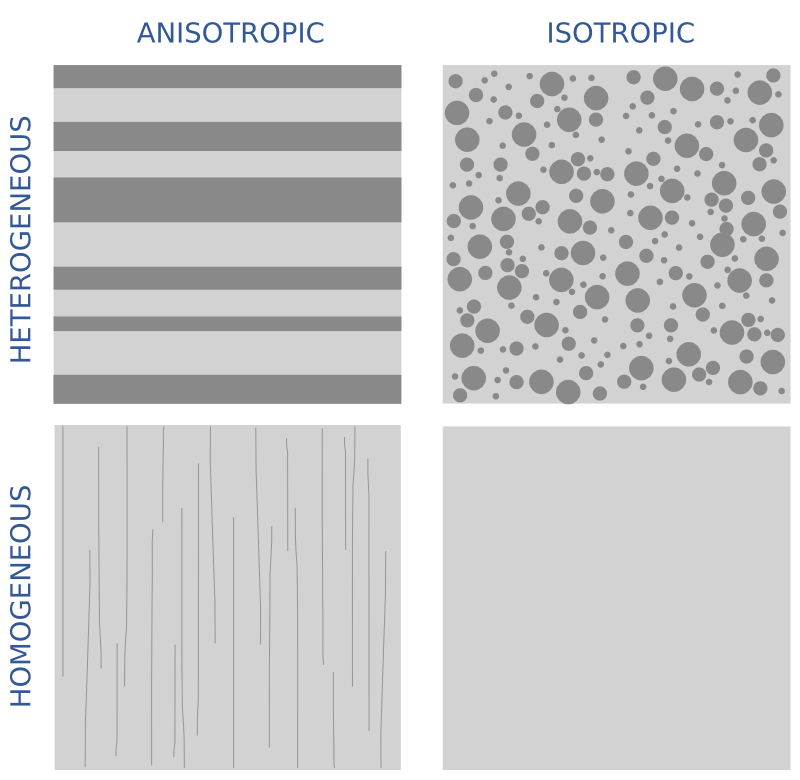
A question came up recently on the Earth Science Stack Exchange that made me stop and think: why do geophysicists use \(V_\mathrm{P}/V_\mathrm{S}\) ratio, and not \(V_\mathrm{S}/V_\mathrm{P}\) ratio, which is naturally bounded. (Or is it? Are there any materials for which \(V_\mathrm{S} > V_\mathrm{P}\)?) I think it's tradition, but maybe you have a better answer?

On the subject of geophysics, I think this is the best paper title I've seen for a while: A current look at geophysical detection of illicit tunnels (Steve Sloan in The Leading Edge, February 2015). Rather topical just now too.

At the SEG Annual Meeting in Denver, I recorded an interview with SEG's Isaac Farley about wikis and knowledge sharing...

OK, well if this is just going to turn into blatant self-promotion, I might as well ask you to check out Pick This, now with over 600 interpretations! Please be patient with it, we have a lot of optimization to do...

Rock property catalog

RPC.png

One of the first things I do on a new play is to start building a Big Giant Spreadsheet. What goes in the big giant spreadsheet? Everything — XRD results, petrography, geochemistry, curve values, elastic parameters, core photo attributes (e.g. RGB triples), and so on. If you're working in the Athabasca or the Eagle Ford then one thing you have is heaps of wells. So the spreadsheet is Big. And Giant. 

But other people's spreadsheets are hard to use. There's no documentation, no references. And how to share them? Email just generates obsolete duplicates and data chaos. And while XLS files are not hard to put on the intranet or Internet,  it's hard to do it in a way that doesn't involve asking people to download the entire spreadsheet — duplicates again. So spreadsheets are not the best choice for collaboration or open science. But wikis might be...

The wiki as database

Regular readers will know that I'm a big fan of MediaWiki. One of the most interesting extensions for the software is Semantic MediaWiki (SMW), which essentially turns a wiki into a database — I've written about it before. Of course we can read any wiki page over the web, but you can query an SMW-powered wiki, which means you can, for example, ask for the elastic properties of a rock, such as this Mesaverde sandstone from Thomsen (1986). And the wiki will send you this JSON string:

{u'exists': True,
 u'fulltext': u'Mesaverde immature sandstone 3 (Kelly 1983)',
 u'fullurl': u'http://subsurfwiki.org/wiki/Mesaverde_immature_sandstone_3_(Kelly_1983)',
 u'namespace': 0,
 u'printouts': {
    u'Lithology': [{u'exists': True,
      u'fulltext': u'Sandstone',
      u'fullurl': u'http://www.subsurfwiki.org/wiki/Sandstone',
      u'namespace': 0}],
    u'Delta': [0.148],
    u'Epsilon': [0.091],
    u'Rho': [{u'unit': u'kg/m\xb3', u'value': 2460}],
    u'Vp': [{u'unit': u'm/s', u'value': 4349}],
    u'Vs': [{u'unit': u'm/s', u'value': 2571}]
  }
}

This might look horrendous at first, or even at last, but it's actually perfectly legible to Python. A little bit of data wrangling and we end up with data we can easily plot. It takes no more than a few lines of code to read the wiki's data, and construct this plot of \(V_\text{P}\) vs \(V_\text{S}\) for all the rocks I have so far put in the wiki — grouped by gross lithology:

A page from the Rock Property Catalog in Subsurfwiki.org. Very much an experiment, rocks contain only a few key properties today.

A page from the Rock Property Catalog in Subsurfwiki.org. Very much an experiment, rocks contain only a few key properties today.

If you're interested in seeing how to make these queries, have a look at this IPython Notebook. It takes you through reading the data from my embryonic catalogue on Subsurfwiki, processing the JSON response from the wiki, and making the plot. Once you see how easy it is, I hope you can imagine a day when people are publishing open data on the web, and sharing tools to query and visualize it.

Imagine it, then figure out how you can help build it!


References

Thomsen, L (1986). Weak elastic anisotropy. Geophysics 51 (10), 1954–1966. DOI 10.1190/1.1442051.

Pick This! Social interpretation

PIck This is a new web app for social image interpretation. Sort of Stack Exchange or Quora (both awesome Q&A sites) meets Flickr. You look for an interesting image and offer your interpretation with a quick drawing. Interpretations earn reputation points. Once you have enough rep, you can upload images and invite others to interpret them. Find out how others would outline that subtle brain tumour on the MRI, or pick that bifurcated fault...

A section from the Penobscot 3D, offshore Nova Scotia, Canada. Overlain on the seismic image is a heatmap of interpretations of the main fault by 26 different interpreters. The distribution of interpretations prompts questions about what is 'the' an…

A section from the Penobscot 3D, offshore Nova Scotia, Canada. Overlain on the seismic image is a heatmap of interpretations of the main fault by 26 different interpreters. The distribution of interpretations prompts questions about what is 'the' answer. Pick this image yourself at pickthis.io.

The app was born at the Geophysics Hackathon in Denver last year. The original team consisted of Ben Bougher, a UBC student and long-time Agile collaborator, Jacob Foshee, a co-founder of Durwella, Chris Chalcraft, a geoscientist at OpenGeoSolutions, Agile's own Evan Bianco of course, and me ordering pizzas and googling domain names. By demo time on Sunday afternoon, we had a rough prototype, good enough for the audience to provide the first seismic interpretations.

Getting from prototype to release

After the hackathon, we were very excited about Pick This, with lots of ideas for new features. We wanted it to be easy to upload an image, being clear about its provenance, and extremely easy to make an interpretation, right in the browser. After some great progress, we ran into trouble bending the drawing library, Raphael.js, to our will. The app languished until Steve Purves, an affable geoscientist–programmer who lives on a volcano in the middle of the Atlantic, came to the rescue a few days ago. Now we have something you can use, and it's fun! For example, how would you pick this unconformity

This data is proprietary to MultiKlient Invest AS. Licensed CC-BY-SA. 

This data is proprietary to MultiKlient Invest AS. Licensed CC-BY-SA. 

This beautiful section is part of this month's Tutorial in SEG's The Leading Edge magazine, and was the original inspiration for the app. The open access essay is by Don Herron, the creator of Interpreter Sam, and describes his approach to interpreting unconformities, using this image as the partially worked example. We wanted a way for readers to try the interpretation themselves, without having to download anything — it's always good to have a use case before building something new. 

What's next for Pick This?

I'm really excited about the possibilities ahead. Apart from the fun of interpreting other people's data, I'm especially excited about what we could learn from the tool — how long do people spend interpreting? How many edits do they make before submitting? And we'd love to add other modes to the tool, like choosing between two image enhancement results, or picking multiple features. And these possibilities only multiply when you think about applications outside earth science, in medical imaging, remote sensing, or astronomy. So much to do, so little time! 

We trust your opinion. Maybe you can help us:

  • Is Pick This at all interesting or fun or useful to you? Is there a use case that occurs to you? 
  • Making the app better will take time and therefore money. If your organization is interested in image enhancement, subjectivity in interpretation, or machine learning, then maybe we can work together. Get in touch!

Whatever you do, please have a look at Pick This and let us know what you think.

Minecraft for geoscience

The Isle of Wight, complete with geology. ©Crown copyright. 

The Isle of Wight, complete with geology. ©Crown copyright. 

You might have heard of Minecraft. If you live with any children, then you definitely have. It's a computer game, but it's a little unusual — there isn't really a score, and the gameplay has no particular goal or narrative, leaving everything to the player or players. It's more like playing with Lego than, say, playing chess or tennis or paintball. The game was created by Swede Markus Persson and then marketed by his company Mojang. Microsoft bought Mojang in September last year for $2.5 billion. 

What does this have to do with geoscience?

Apart from being played by 100 million people, the game has attracted a lot of attention from geospatial nerds over the last 12–18 months. Or rather, the Minecraft environment has. The game chiefly consists of fabricating, placing and breaking 1-m-cubed blocks of various materials. Even in normal use, people create remarkable structures, and I don't just mean 'big' or 'cool', I mean truly remarkable. So the attention from the British Geological Survey and the Danish Geodata Agency. If you've spent any time building geocellular models, then the process of constructing elaborate digital models is familiar to you. And perhaps it's not too big a leap to see how the virtual world of Minecraft could be an interesting way to model the subsurface. 

Still I was surprised when, chatting to Thomas Rapstine at the Geophysics Hackathon in Denver, he mentioned Joe Capriotti and Yaoguo Li, fellow researchers at Colorado School of Mines. Faced with the problem of building 3D earth models for simulating geophysical experiments — a problem we've faced with modelr.io — they hit on the idea of adapting Minecraft models. This is not just a gimmick, because Minecraft is specifically designed for simulating and manipulating landscapes.

The Minecraft model (left) and synthetic gravity data (right). Image ©2014 SEG and Capriotti & Li. Used in acordance with SEG's permissions. 

The Minecraft model (left) and synthetic gravity data (right). Image ©2014 SEG and Capriotti & Li. Used in acordance with SEG's permissions

If you'd like to dabble in geospatial Minecraft yourself, the FME software from Safe now has a standardized way to get Minecraft data into and out of the environment. Essentially they treat the blocks as point clouds (e.g. as you might get from Lidar or a laser scan), so they can do conventional operations, such as differences or filtering, with the software. They recorded a webinar on the subject yesterday.

Minecraft is here to stay

There are two other important angles to Minecraft, both good reasons why it will probably be around for a while, and probably both something to do with why Microsoft bought Mojang...

  1. It is a programming gateway drug. Like web coding, and image processing, Minecraft might be another way to get people, especially young people, interested in computing. The tiny Linux machine Raspberry Pi comes with a version of the game with a full Python API, so you can control the game programmatically.  
  2. Its potential beyond programming as a STEM teaching aid and engagement tool. Here's another example. Indeed, the United Nations is involved in Block By Block, an effort around collaborative public space design echoing the Blockholm project, an early attempt to explore social city planning in the tool.

All of which is enough to make me more curious about the crazy-sounding world my kids have built, with its Houston-like city planning: house, school, house, Home Sense, house, rocket launch pad...

References

Capriotti, J and Yaoguo Li (2014) Gravity and gravity gradient data: Understanding their information content through joint inversions. SEG Technical Program Expanded Abstracts 2014: pp. 1329-1333. DOI 10.1190/segam2014-1581.1 

The thumbnail image is from an image by Terry Madeley.

UPDATE: Thank you to Andy for pointing out that Yaoguo Li is a prof, not a student.

What is anisotropy?

anisotropy_vs_heterogeneity.png

Geophysicists often assume that the earth is isotropic. This word comes from 'iso', meaning same, and 'tropikos', meaning something to do with turning. The idea is that isotropic materials look the same in all directions — they have no orientation, and we can make measurements in any direction and get the same result. Note that this is different from homogeneous, which is the quality of uniformity of composition. You can think of anisotropy as a directional (not just spatial) variation in homogeneity. 

In the illustration, I may have cheated a bit. The lower-left image shows a material that is homogeneous but anisotropic. The thin lines are supposed to indicate microfractures, say, or the alignment of clay flakes, or even just stress. So although the material has uniform composition, at least at this scale, it has an orientation.

The recognition of the earth's anisotropy is a dominant theme among papers in our forthcoming 52 Things book on rock physics. It's not exactly a new thing — it was an emerging trend 10 years ago when Larry Lines at U of C reviewed Milo Backus's famous 'challenges' (Lines 2005). And even then, the spread of anisotropic processing and analysis had been underway for almost 20 years since Leon Thomsen's classic 1986 paper, Weak elastic anisotropy. This paper introduced three parameters that we need—alongside the usual \(V_\text{P}\), \(V_\text{S}\), and \(\rho\)—to describe anisotropy. They are \(\delta\) (delta), \(\epsilon\) (epsilon), and \(\gamma\) (gamma), collectively referred to as Thomsen's parameters

  • \(\delta\) or delta — the short offset effect — captures the relationship between the velocity required to flatten gathers (the NMO velocity) and the zero-offset average velocity as recorded by checkshots. It's easy to measure, but perhaps hard to understand in physical terms.
  • \(\epsilon\) or epsilon — the long offset effect — is, according to Thomsen himself:  "the fractional difference between vertical and horizontal P velocities; i.e., it is the parameter usually referred to as 'the' anisotropy of a rock". Unfortunately, the horizontal velocity is rather hard to measure. 
  • \(\gamma\) or gamma — the shear wave effect — relates, as rock physics meister Colin Sayers put it on Twitter, a horizontal shear wave with horizontal polarization to a vertical shear wave. He added, "\(\gamma\) can be determined in a single well using sonic. So the correlation with \(\epsilon\) and \(\delta\) is of great interest."

Sidenote to aspiring authors: Thomsen's seminal paper, which has been cited over 2800 times, is barely 13 pages long. Three and a half of those pages are taken up by... data! A huge table containing the elastic parameters of almost 60 samples. And this is from a corporate scientist at Amoco. So no more excuses: publish you data! </rant>

Vertical transverse what now?

The other bit of jargon you will come across is the concept of transverse isotropy, which is a slightly perverse (to me) way of expressing the orientation of the anisotropy effect. In vertical transverse isotropy, the horizontal velocity is different from the vertical velocity. Think of flat-lying shales with gravity dominating the stress field. Usually, the velocity is faster along the beds than it is across the beds. This manifests as nonhyperbolic moveout in the far offsets, in particular a pull-up or 'hockey stick' effect in the gathers — the arrivals are unexpectedly early at long offsets. Clearly, this will also affect AVO analysis

There's more jargon. If the rocks are dipping, we call it tilted transverse isotropy, or TTI. But if the anisotropies, so to speak, are oriented vertically — as with fractures, for example, or simply horizontal stress — then it's horizontal transverse isotropy, or HTI. This causes azimuthal (compass directional) travel-time variations. We can even venture into situations where we encounter orthorhombic anisotropy, as in the combined VTI/HTI model shown above. It's easy to imagine how these effects, if not accounted for in processing, can (and do!) result in suboptimal seismic images. Accounting for them is not easy though, and trying can do more harm than good.

If you have handy rules of thumb of ways of conceptualizing anisotropy, I'd love to hear about them. Some time soon I want to write about thin-layer anisotropy, which is where this post was going until I got sidetracked...

References

Lines, L (2005). Addressing Milo's challenges with 25 years of seismic advances. The Leading Edge 24 (1), 32–35. DOI 10.1190/1.2112389.

Thomsen, L (1986). Weak elastic anisotropy. Geophysics 51 (10), 1954–1966. DOI 10.1190/1.1442051.