Here are some of our highlights from the second half of the AAPG Annual Convention in Houston.
Conceptual uncertainty in interpretation
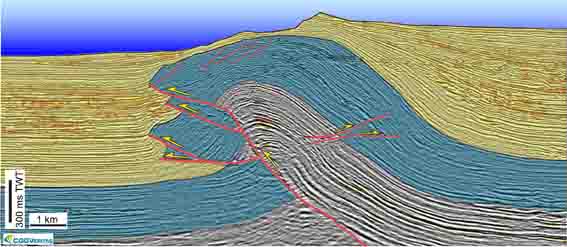 Fold-thrust belt, offshore Nigeria. Virtual Seismic Atlas.Rob Butler's research is concerned with the kinematic evolution of mountain ranges and fold thrust belts in order to understand the localization of deformation across many scales. Patterns of deformed rocks aren't adequately explained by stress fields alone; they are also controlled by the mechancial properties of the layers themselves. Given this fact, the definition of the layers becomes a doubly important part of the interpretation.
The biggest risk in structural interpretation is not geometrical accuracy but whether or not the concept is correct. This is not to say that we don't understand geologic processes. Rather, a section can always be described in more than one way. It is this risk in the first order model that impacts everything we do. To deal with conceptual uncertainty we must first capture the range, otherwise it is useless to do any more refinement.
 He showed a crowd-sourced compiliation of 24 interpretations from the Virtual Seismic Atlas as a way to stack up a series of possible structural frameworks. Fifteen out of twenty-four interviewees interpreted a continuous, forward-propagating thrust fault as the main structure. The disagreements were around the existence and location of a back thrust, linkage between fore- and back-thrusts, the existence and location of a detachment surface, and its linkage to the fault planes above. Given such complexity, "it's rather daft," he said, "to get an interpretation from only one or two people."
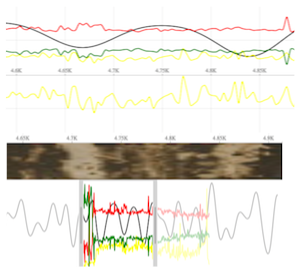
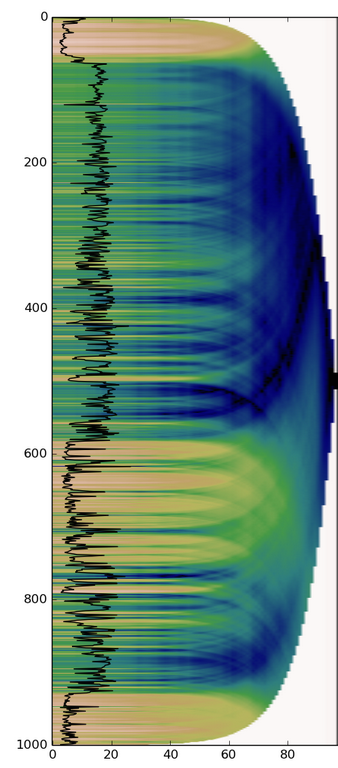
CT scanning gravity flows
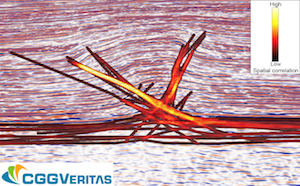
Mike Tilston and Bill Arnott gave a pair of talks about their research into sediment gravity flows in the lab. This wouldn't be newsworthy in itself, but their 2 key innovations caught our attention:
- A 3D velocity profiler capable of making 23 measurements a second
- The flume tank ran through a CT scanner, giving a hi-res cross-section view
These two methods sidestep the two major problems with even low-density (say 4% by weight) sediment gravity flows: they are acoustically attenuative, and optically opaque. Using this approach Tilston and Arnott investigated the effect of grain size on the internal grain distribution, finding that fine-grained turbidity currents sustain a plug-like wall of sediment, while coarse-grained flows have a more carpet-like distribution. Next, they plan to look at particle shape effects, finer grain sizes, and grain mixtures. Technology for the win!
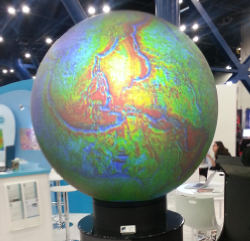
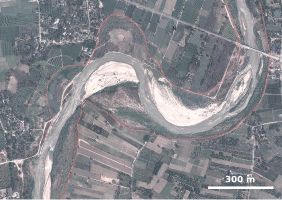
Hypothesizing a martian ocean
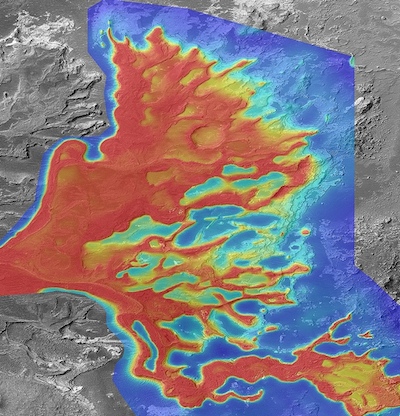 Lorena Moscardelli showed topograhic renderings of the Eberswalde delta (right) on the planet Mars, hypothesizing that some martian sedimentary rocks have been deposited by fluvial processes. An assertion that posits the red planet with a watery past. If there are sedimentary rocks formed by fluids, one of the fluids could have been water. If there has been water, who knows what else? Hydrocarbons? Imagine that! Her talk was in the afternoon session on Space and Energy Frontiers, sandwiched by less scientific speakers raising issues for staking claims and models for governing mineral and energy resources away from earth. The idea of tweaking earthly policies and state regulations to manage resources on other planets, somehow doesn't align with my vision of an advanced civilization. But the idea of doing seismic on other planets? So cool.
Poster gorgeousness
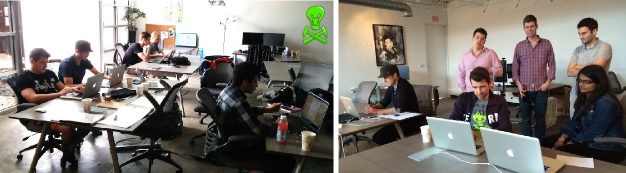
Matt and I were both invigorated by the quality, not to mention the giant size, of the posters at the back of the exhibition hall. It was a place for the hardcore geoscientists to retreat from the bright lights, uniformed sales reps, and the my-carpet-is-cushier-than-your-carpet marketing festival. An oasis of authentic geoscience and applied research.
 We both finally got to meet Brian Romans, a sedimentologist at Virginia Tech, amidst the poster-paneled walls. He said that this is his 10th year venturing to the channel deposits that crop out in the Magallanes Basin of southern Chile. He is now one of the three young, energetic profs behind the hugely popular Chile Slope Systems consortium.
Three years ago he joined forces with Lisa Stright (University of Utah), and Steve Hubbard (University of Calgary) and formed the project investigating processes of sediment transfer across deepwater slopes exposed around Patagonia. It is a powerhouse of collaborative research, and the quality of graduate student work being pumped out is fantastic. Purposeful and intentional investigations carried out by passionate and tech-savvy scientists. What can be more exciting than that?
Do you have any highlights of your own? Please leave a note in the comments.

 There's a new book in town... Rob Simm and Mike Bacon have put together a great-looking text on seismic amplitude intepretation (Cambridge, 2014). Mine hasn't arrived yet, so I can't say much more — for now, you can preview it in Google Books. I should add it to my list.
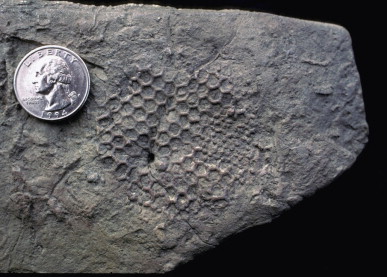 Dolf Seilacher, the German ichnologist and palaeontologist, died 4 days ago at the age of 89. For me at least, his name is associated with the mysterious trace fossil Palaeodictyon — easily one of the weirdest things on earth (right).


 Except where noted, this content is licensed