Code Show version 1.0

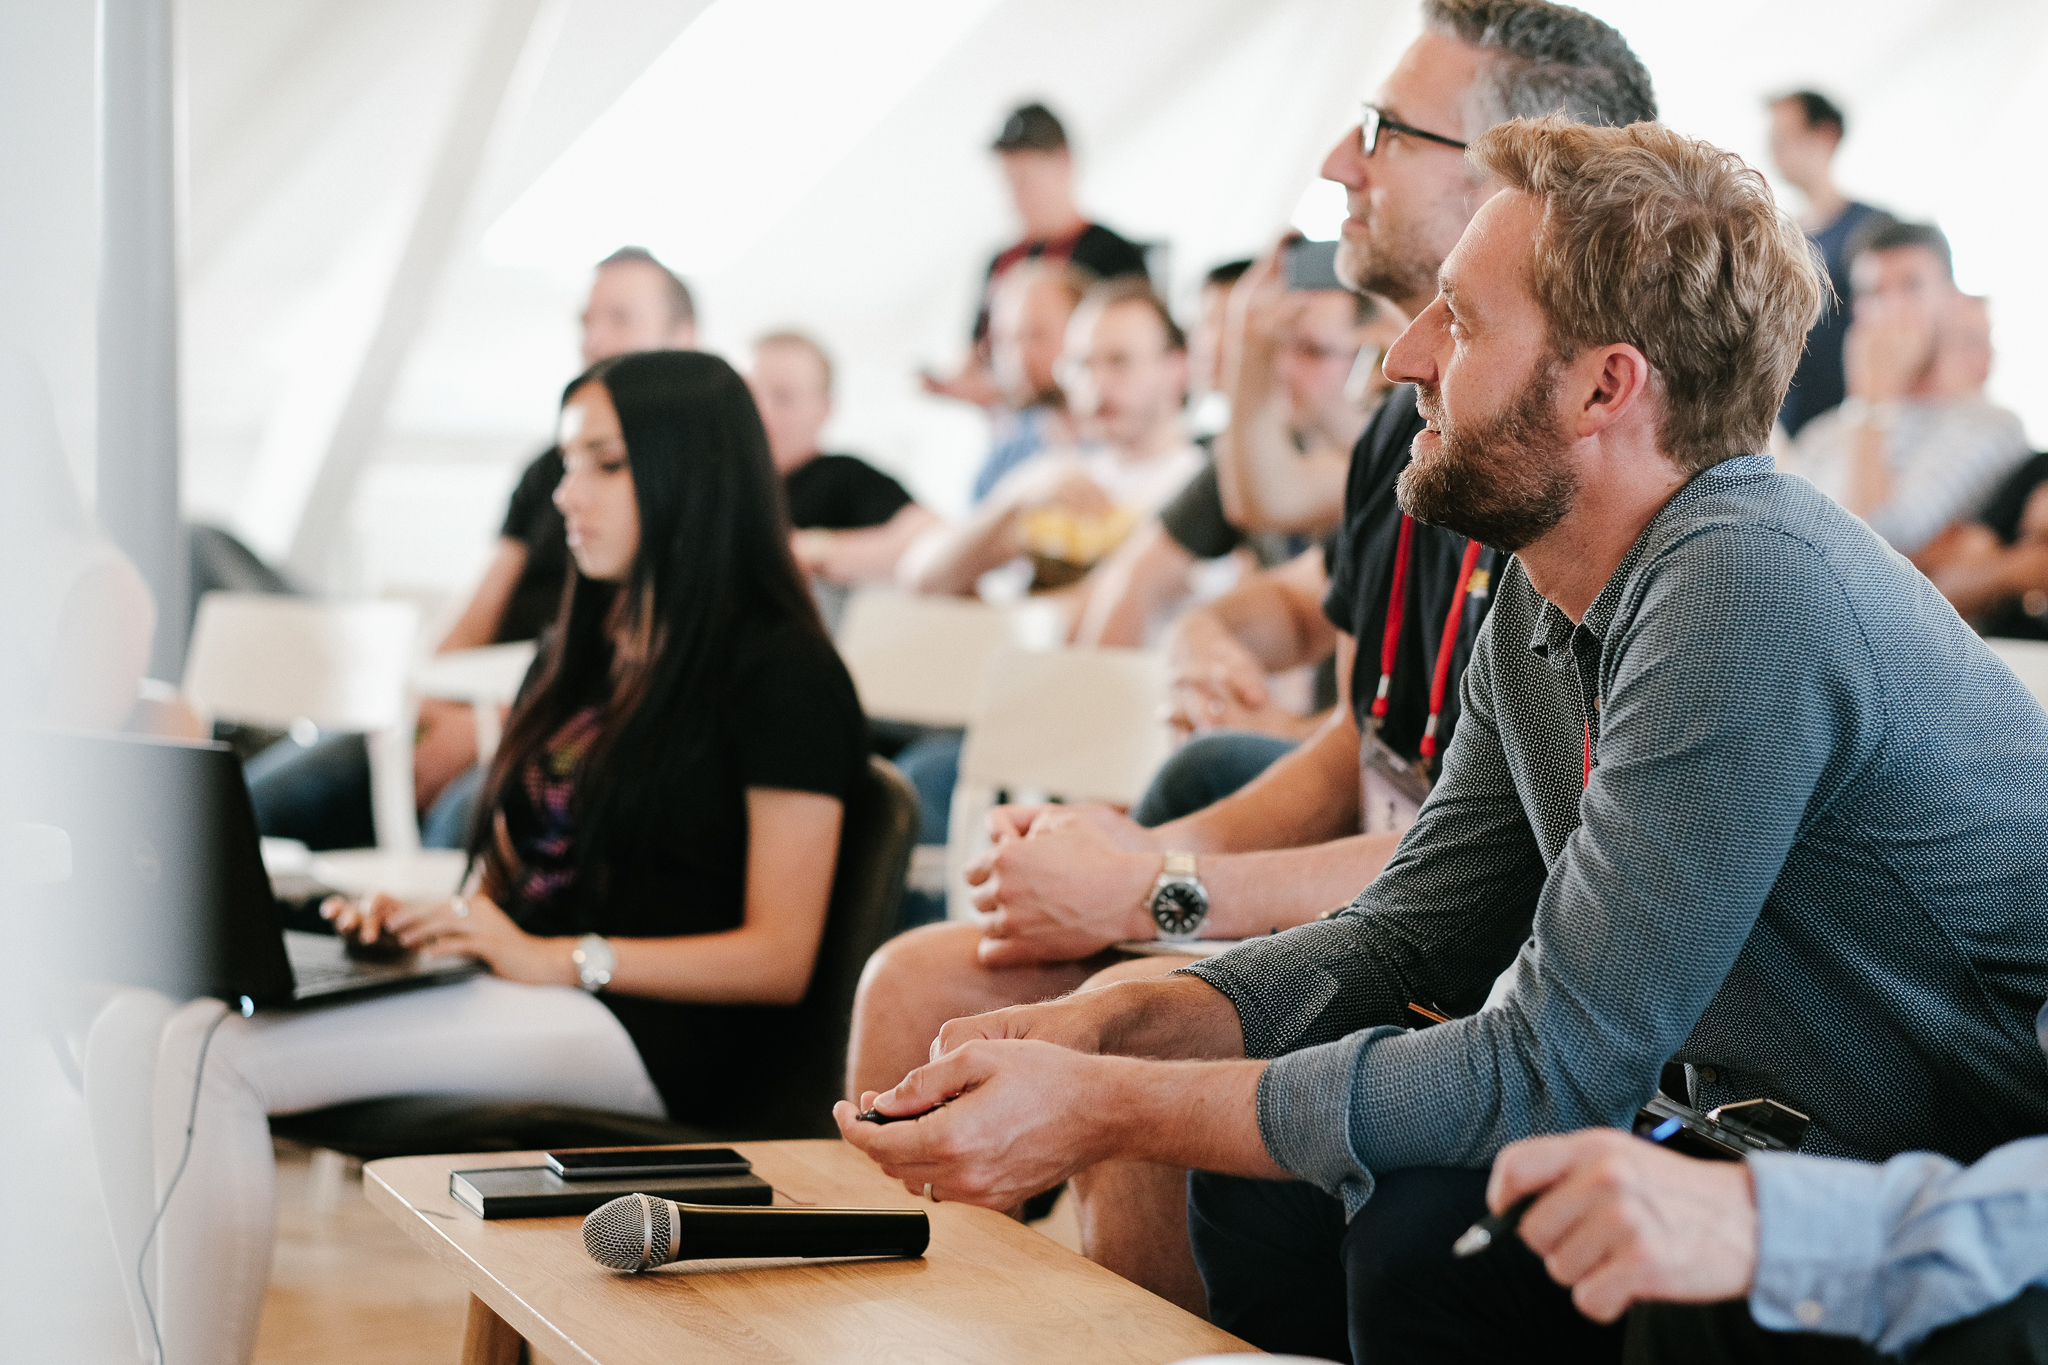
Last week we released Code Show version 1.0. In a new experiment, we teamed up with Total and the European Association of Geoscientists and Engineers at the EAGE Annual Conference and Exhibition in Copenhagen. Our goal was to bring a little of the hackathon to as many conference delegates as possible. We succeeded in reaching a few hundred people over the three days, making a lot of new friends in the process. See the action in this Twitter Moment.

What was on the menu?

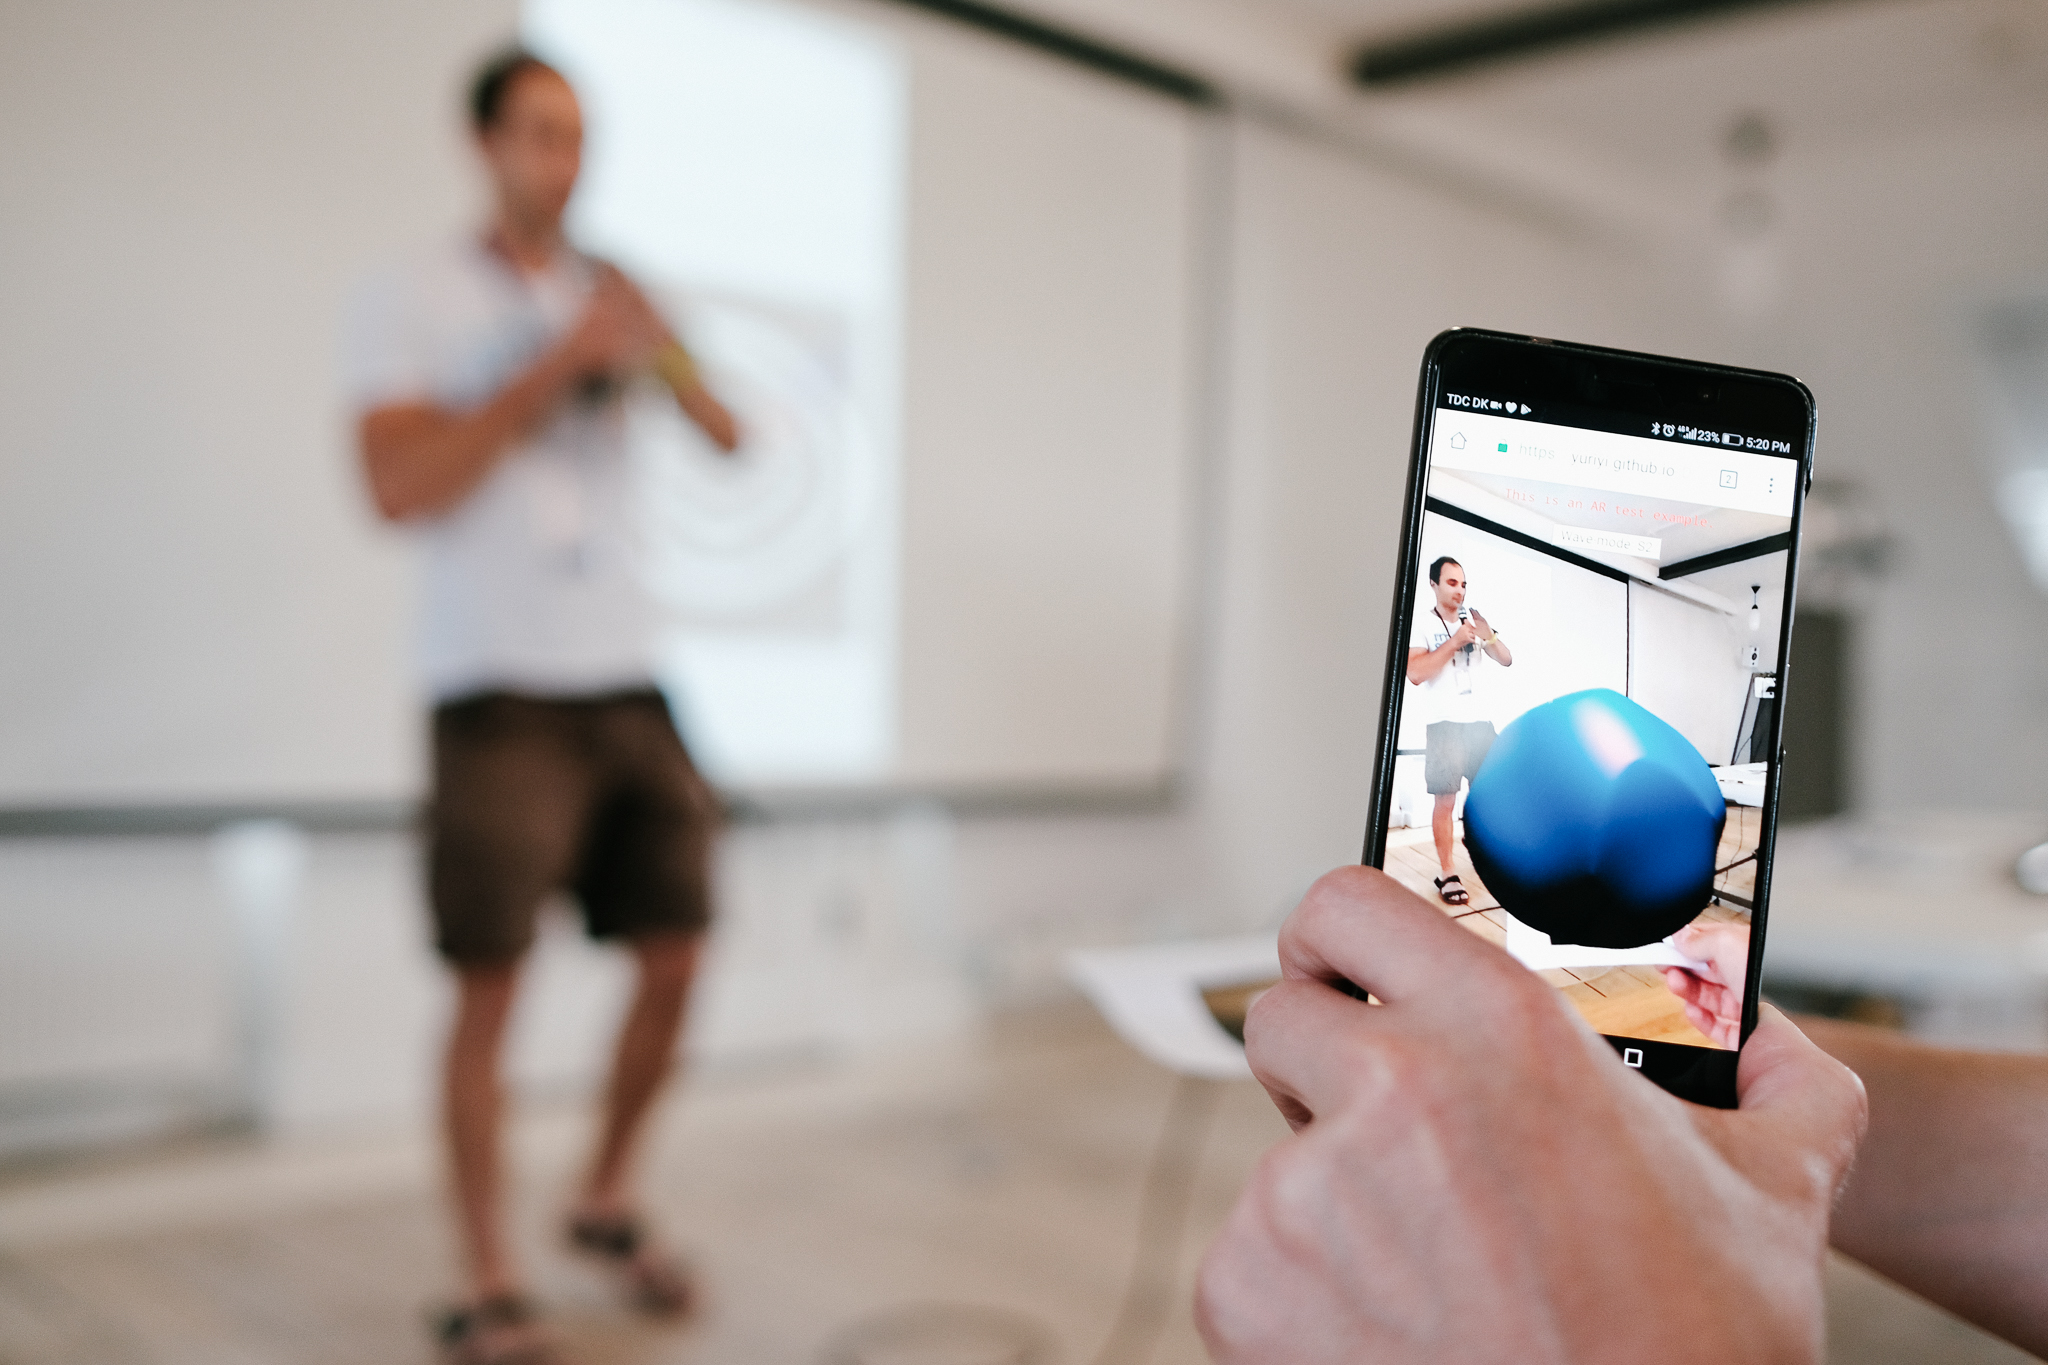
The augmented reality sandbox that Simon Virgo and his colleagues brought from the University of Aachen. The sandbox displayed both a geological map generated by the GemPy 3D implicit geological modeling tool, as well as a seismic wavefield animation generated by the Devito modeling and inversion project. Thanks to Yuriy Ivanov (NTNU) and others in his hackathon team for contributing the seismic modeling component.  

Demos from the Subsurface Hackathon. We were fortunate to have lots of hackathon participants make time for the Code Show. Graham Brew presented the uncertainty visualizer his team built; Jesper Dramsch and Lukas Mosser showed off their t-SNE experiments; Florian Smit and Steve Purves demoed their RGB explorations; and Paul Gabriel shared the GiGa Infosystems projects in AR and 3D web visualization. Many thanks to those folks and their teams.

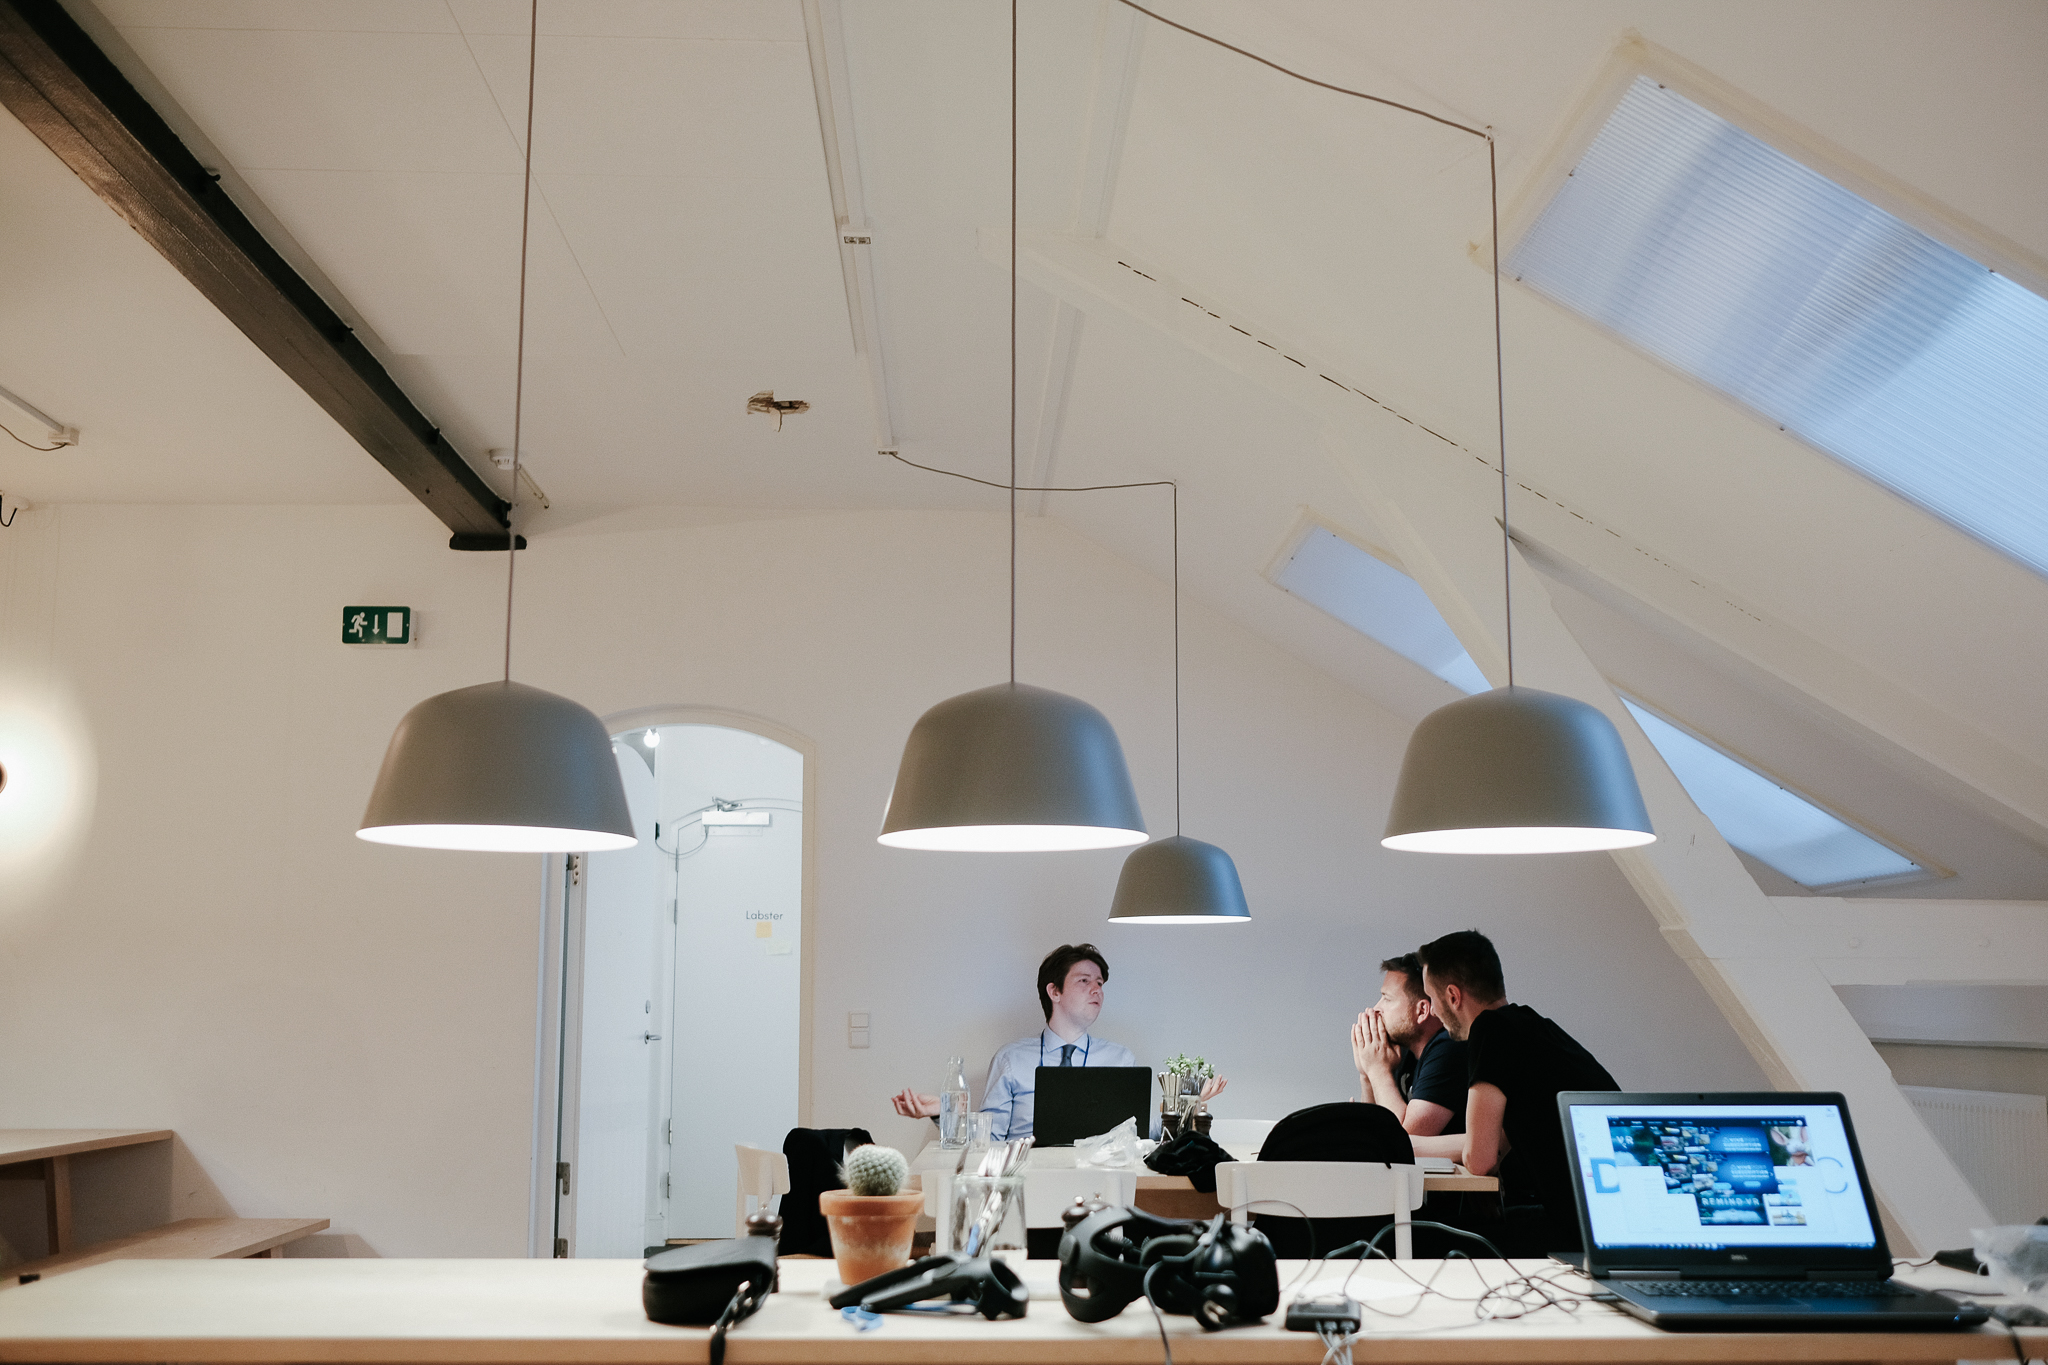
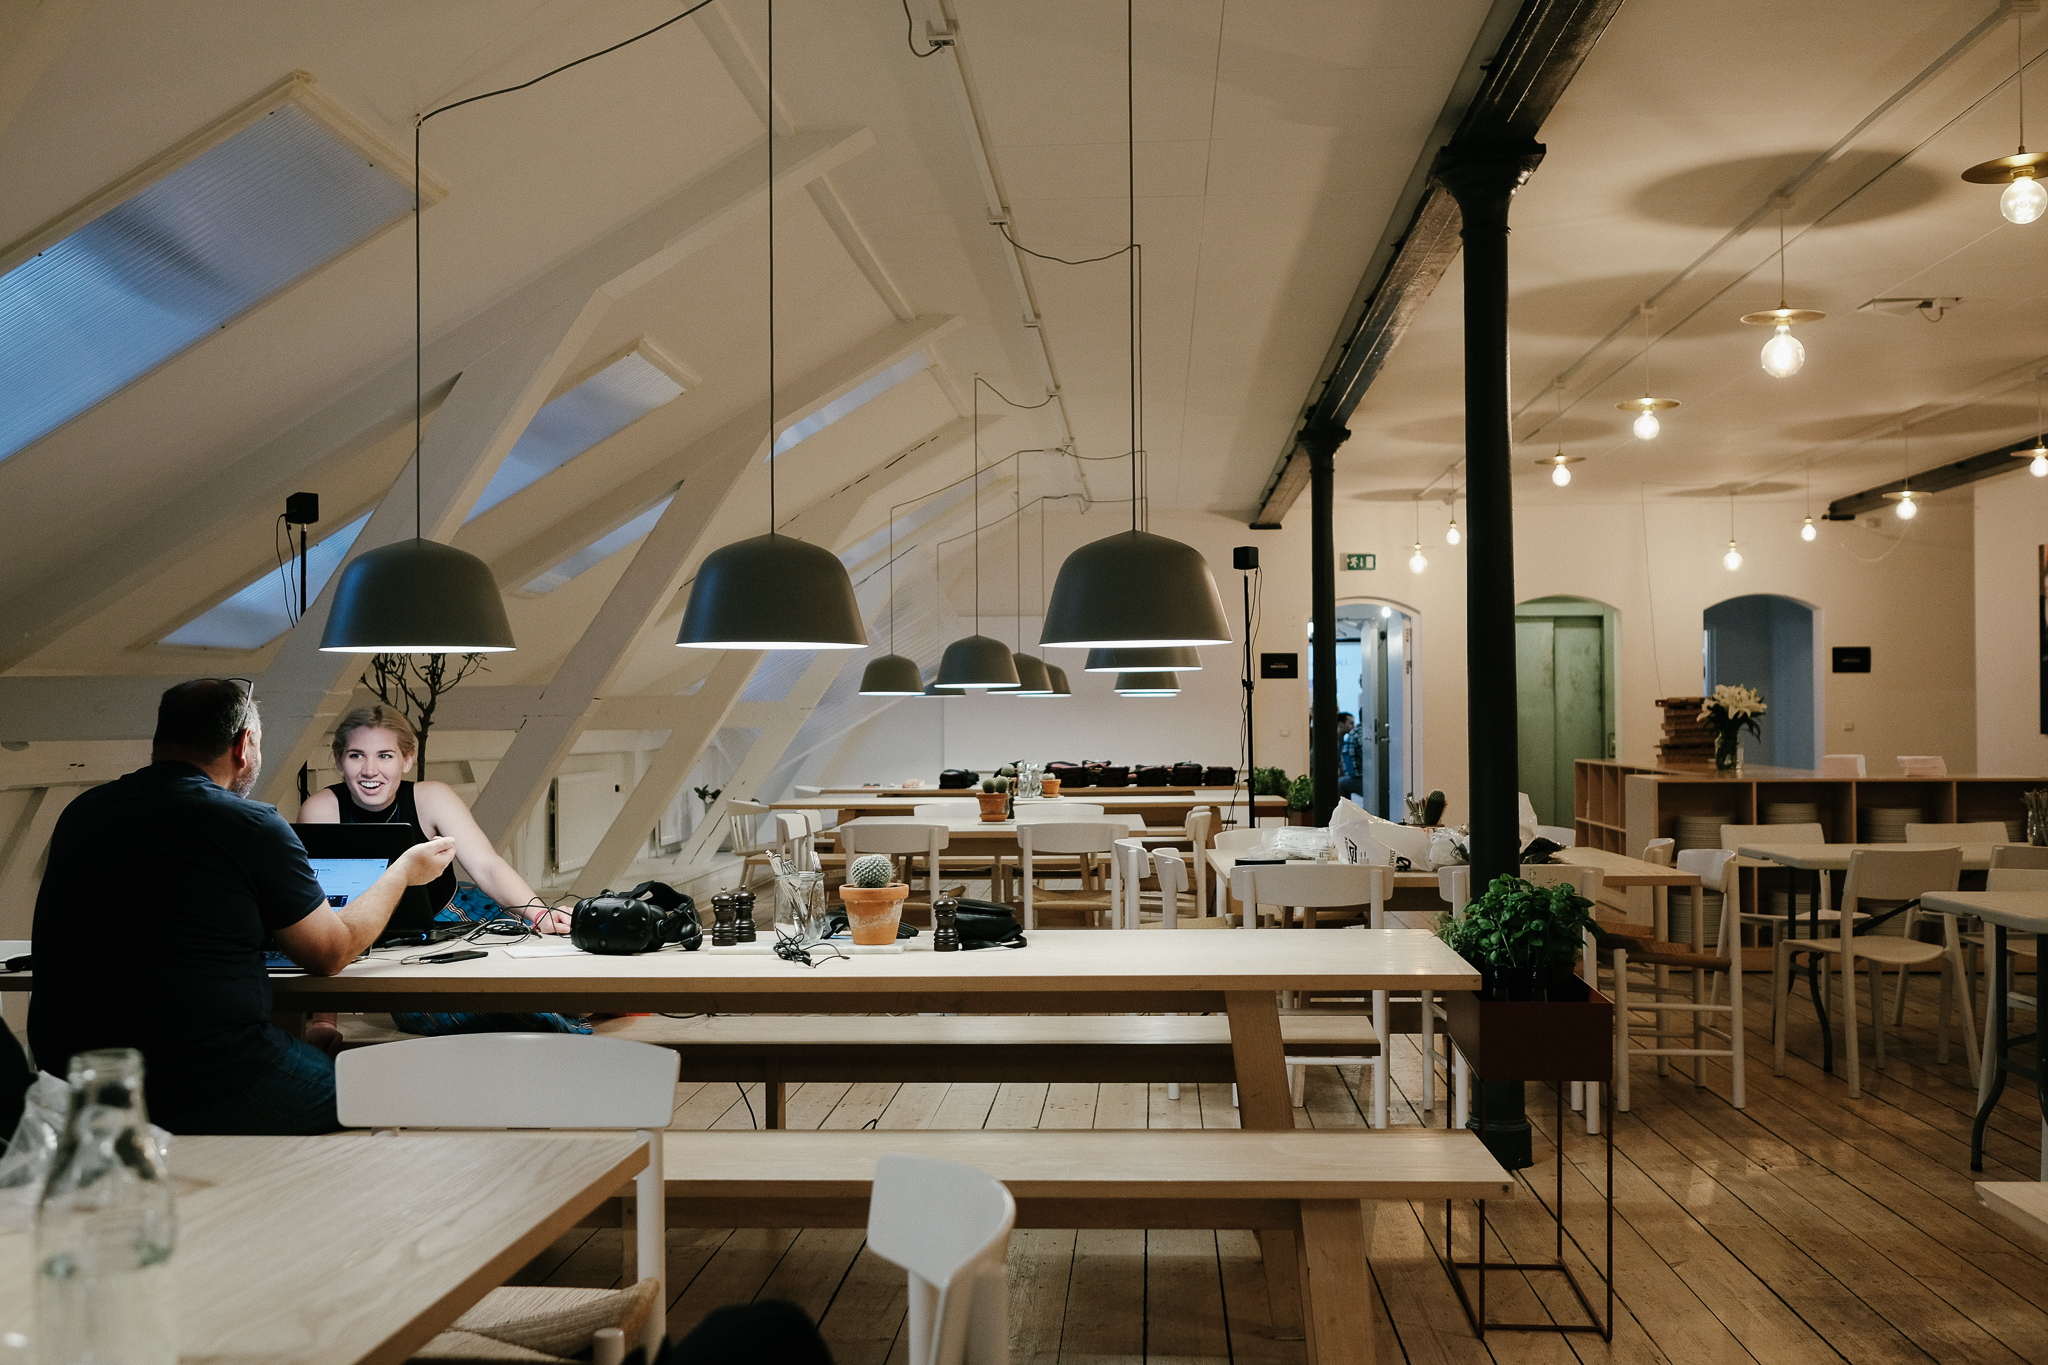
AR and VR demos by the Total team. Dell EMC provided HTC Vive and Meta 2 kits, with Dell Precision workstations, for people to try. They were a lot of fun, provoking several cries of disbelief and causing at least one person to collapse in a heap on the floor.

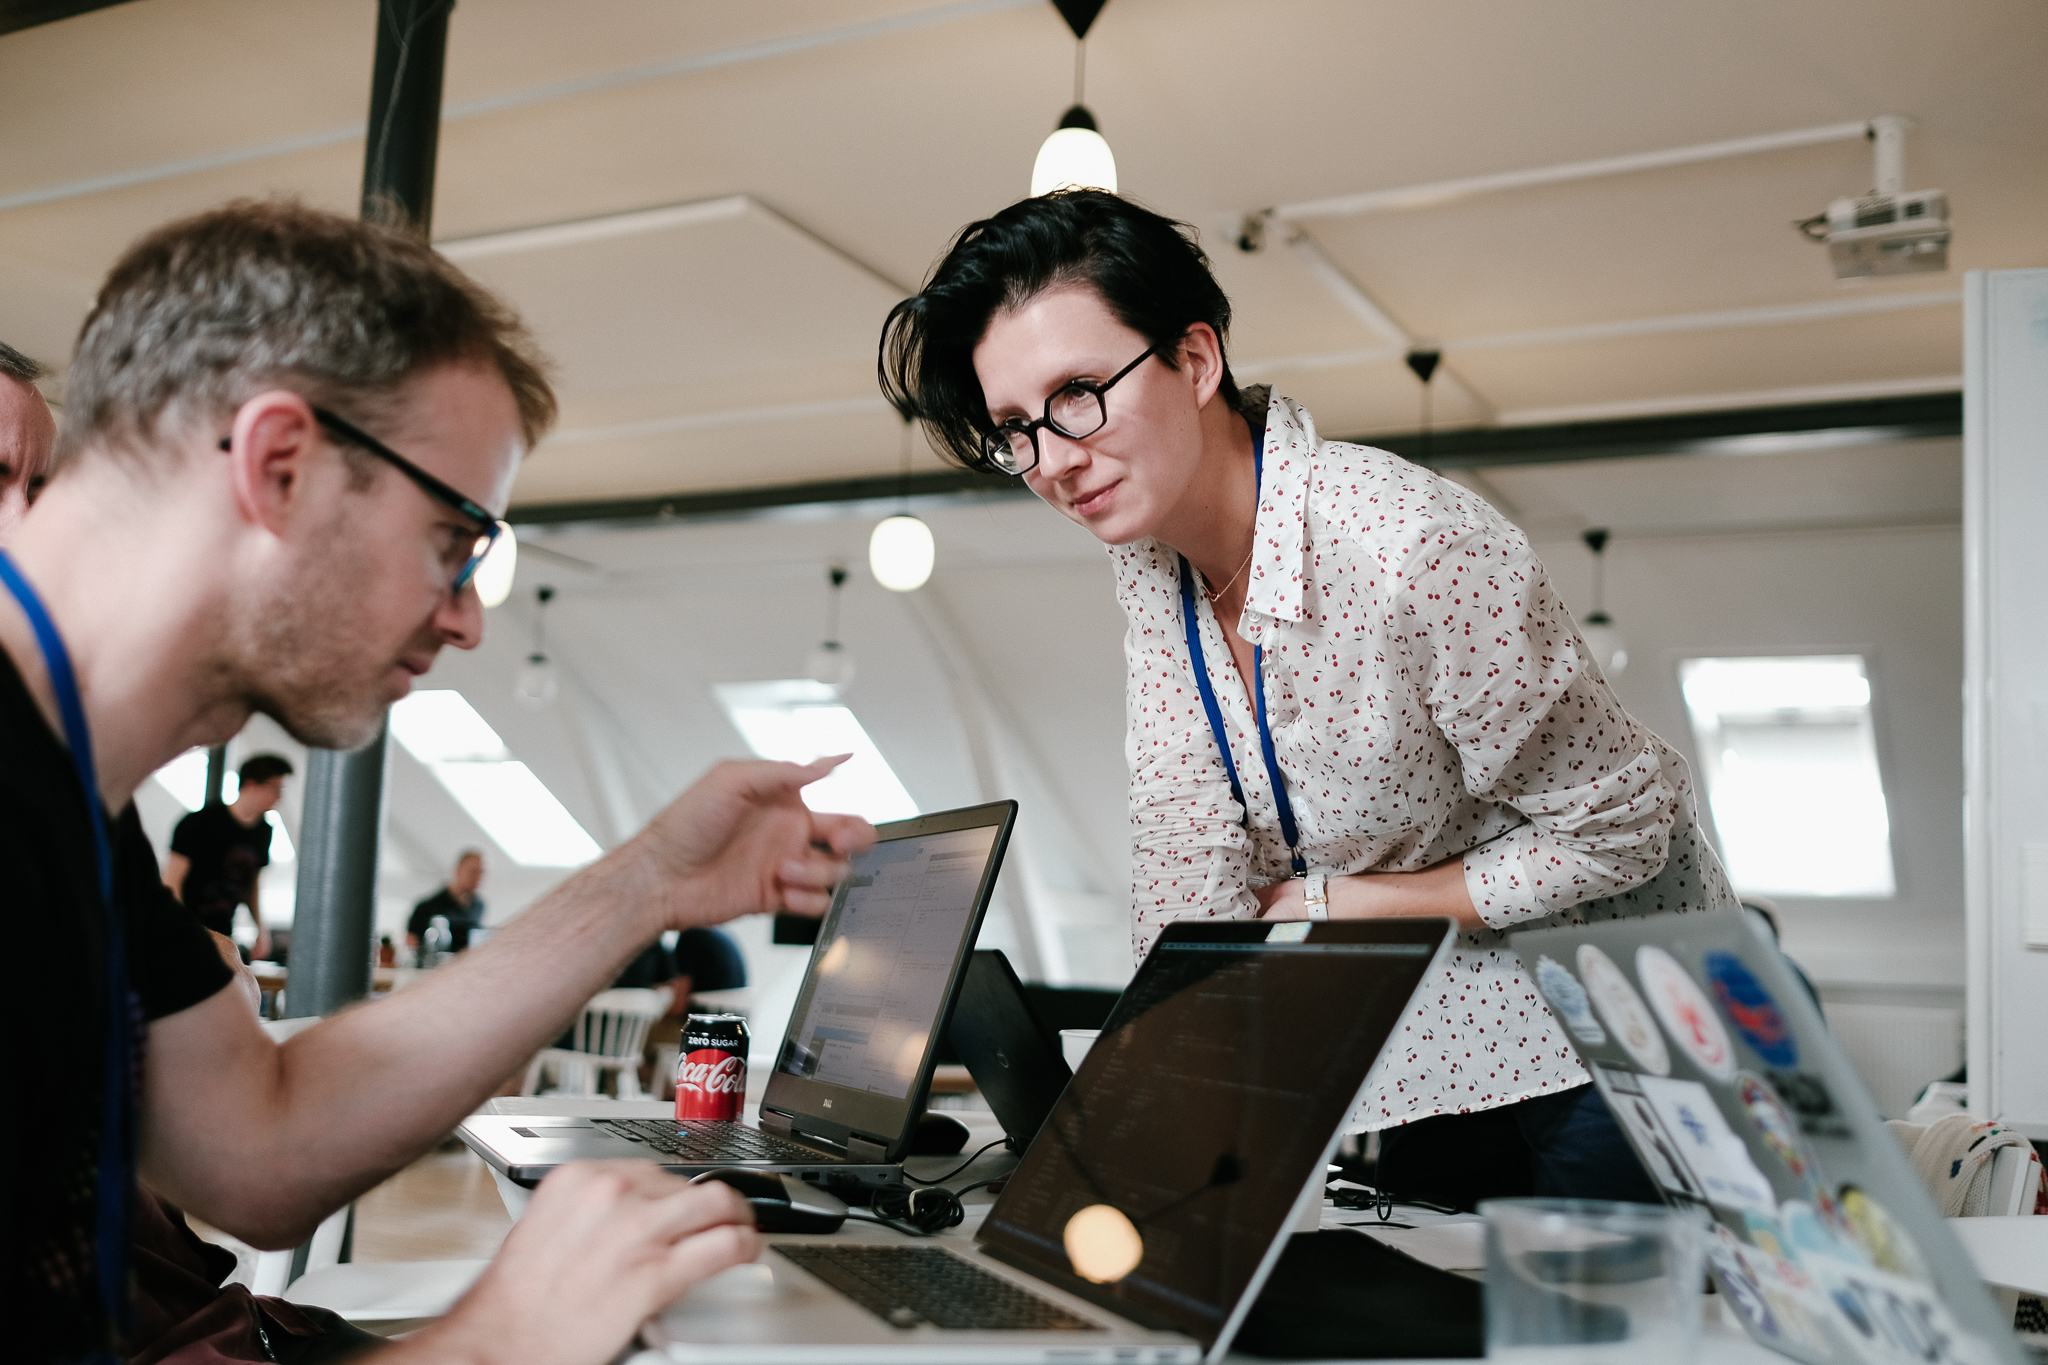
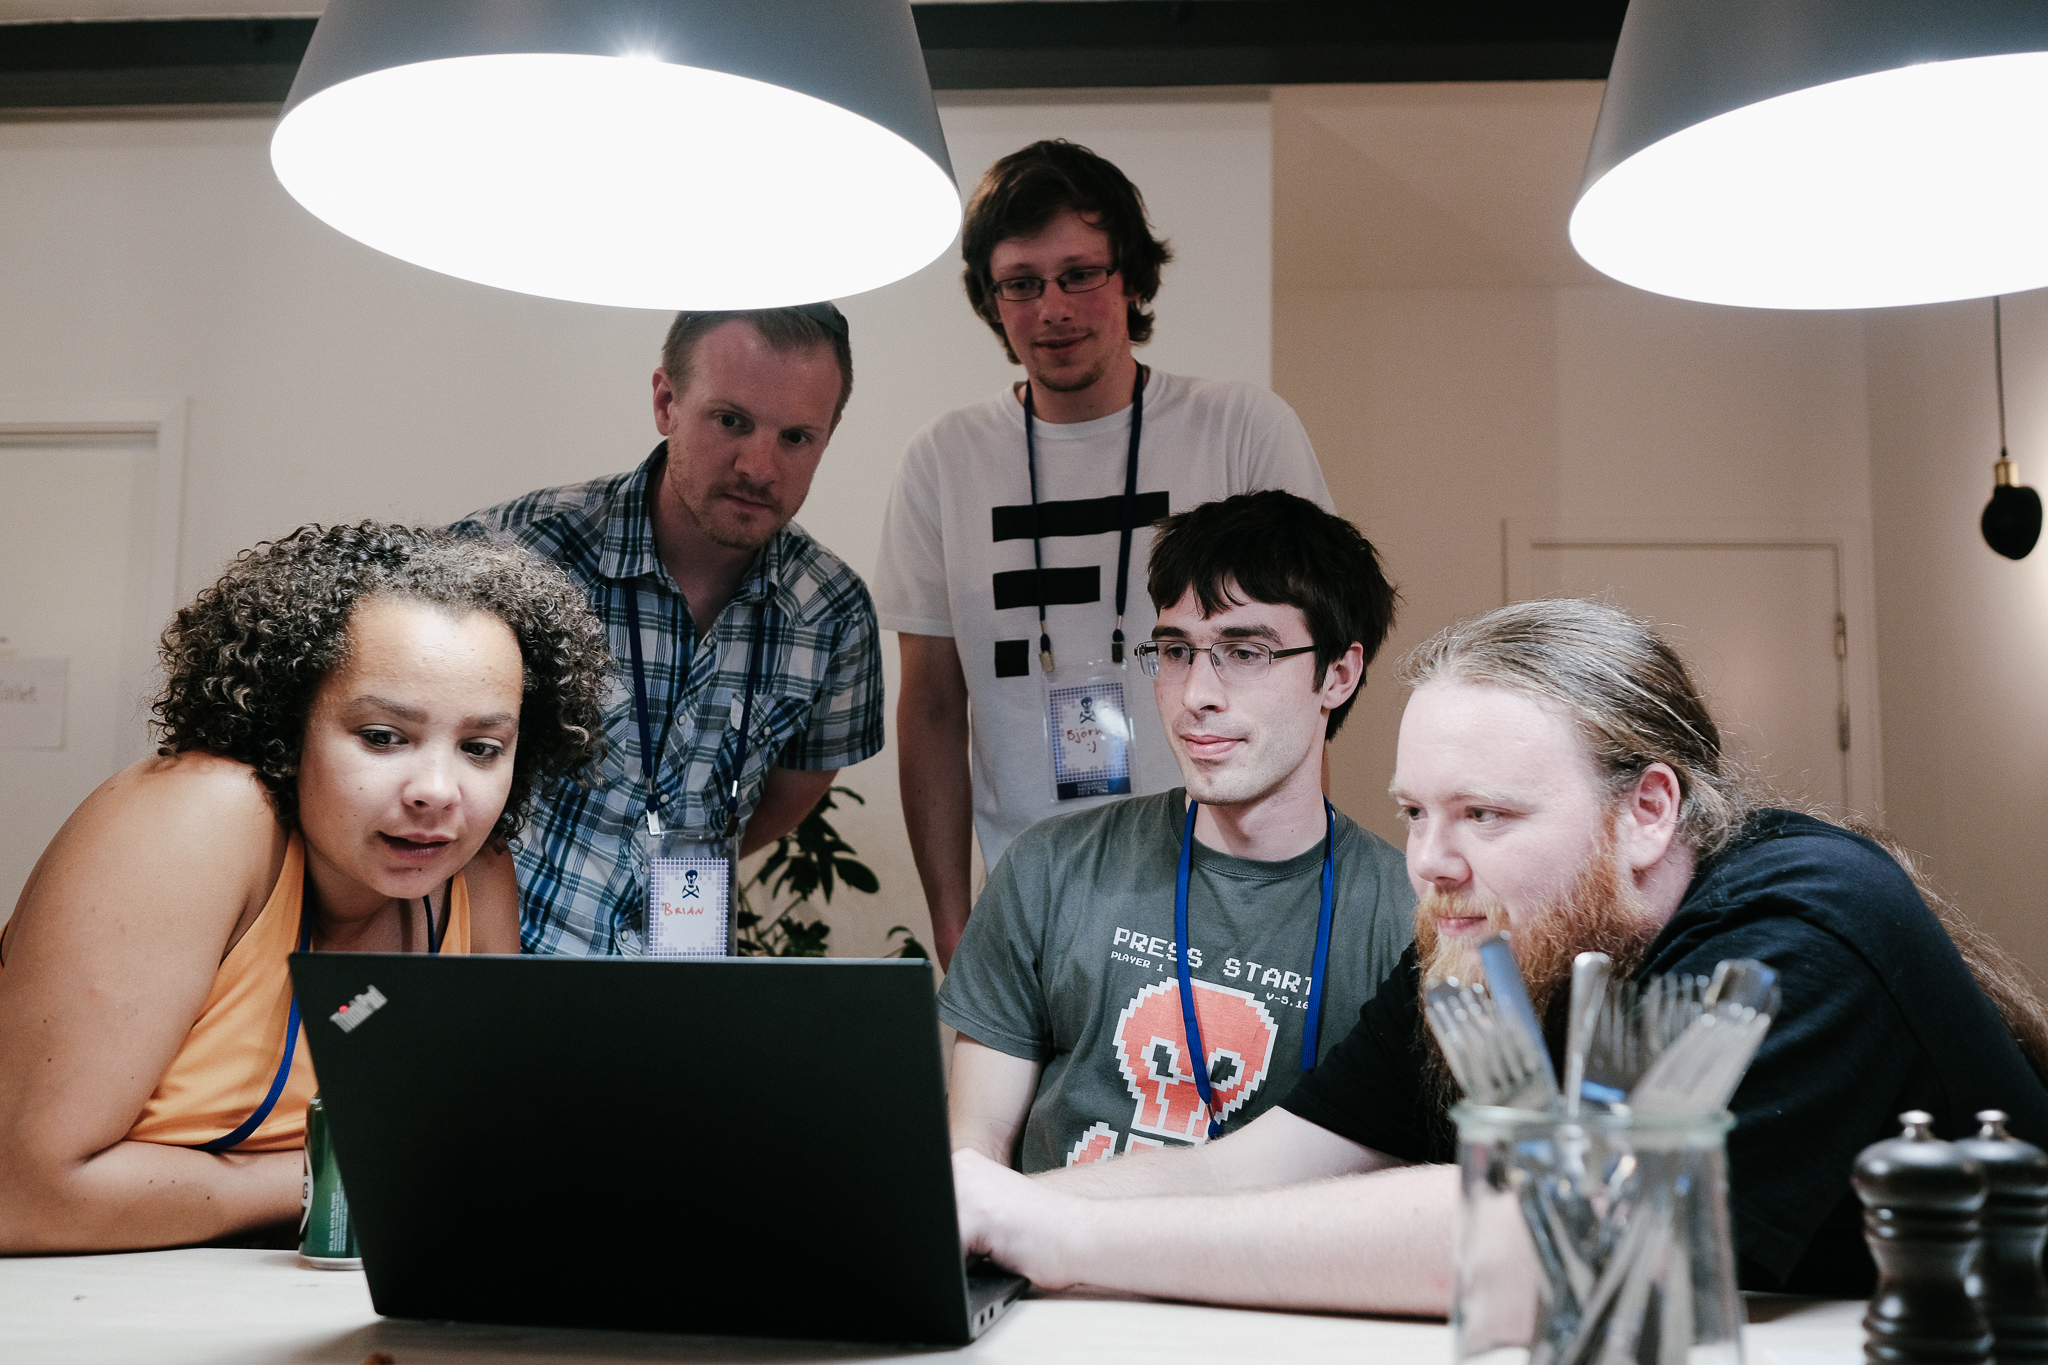
Python demos by the Agile team. Dell EMC also kindly provided lots more Dell Precision workstations for general use. We hooked up some BBC micro:bit microcontrollers, Microsoft Azure IoT DevKits, and other bits and bobs, and showed anyone who would listen what you can do with a few lines of Python. Thank you to Carlos da Costa (University of Edinburgh) for helping out!

Tech demos by engineers from Intel and INT. Both companies are very active in visualization research and generously spent time showing visitors their technology. 

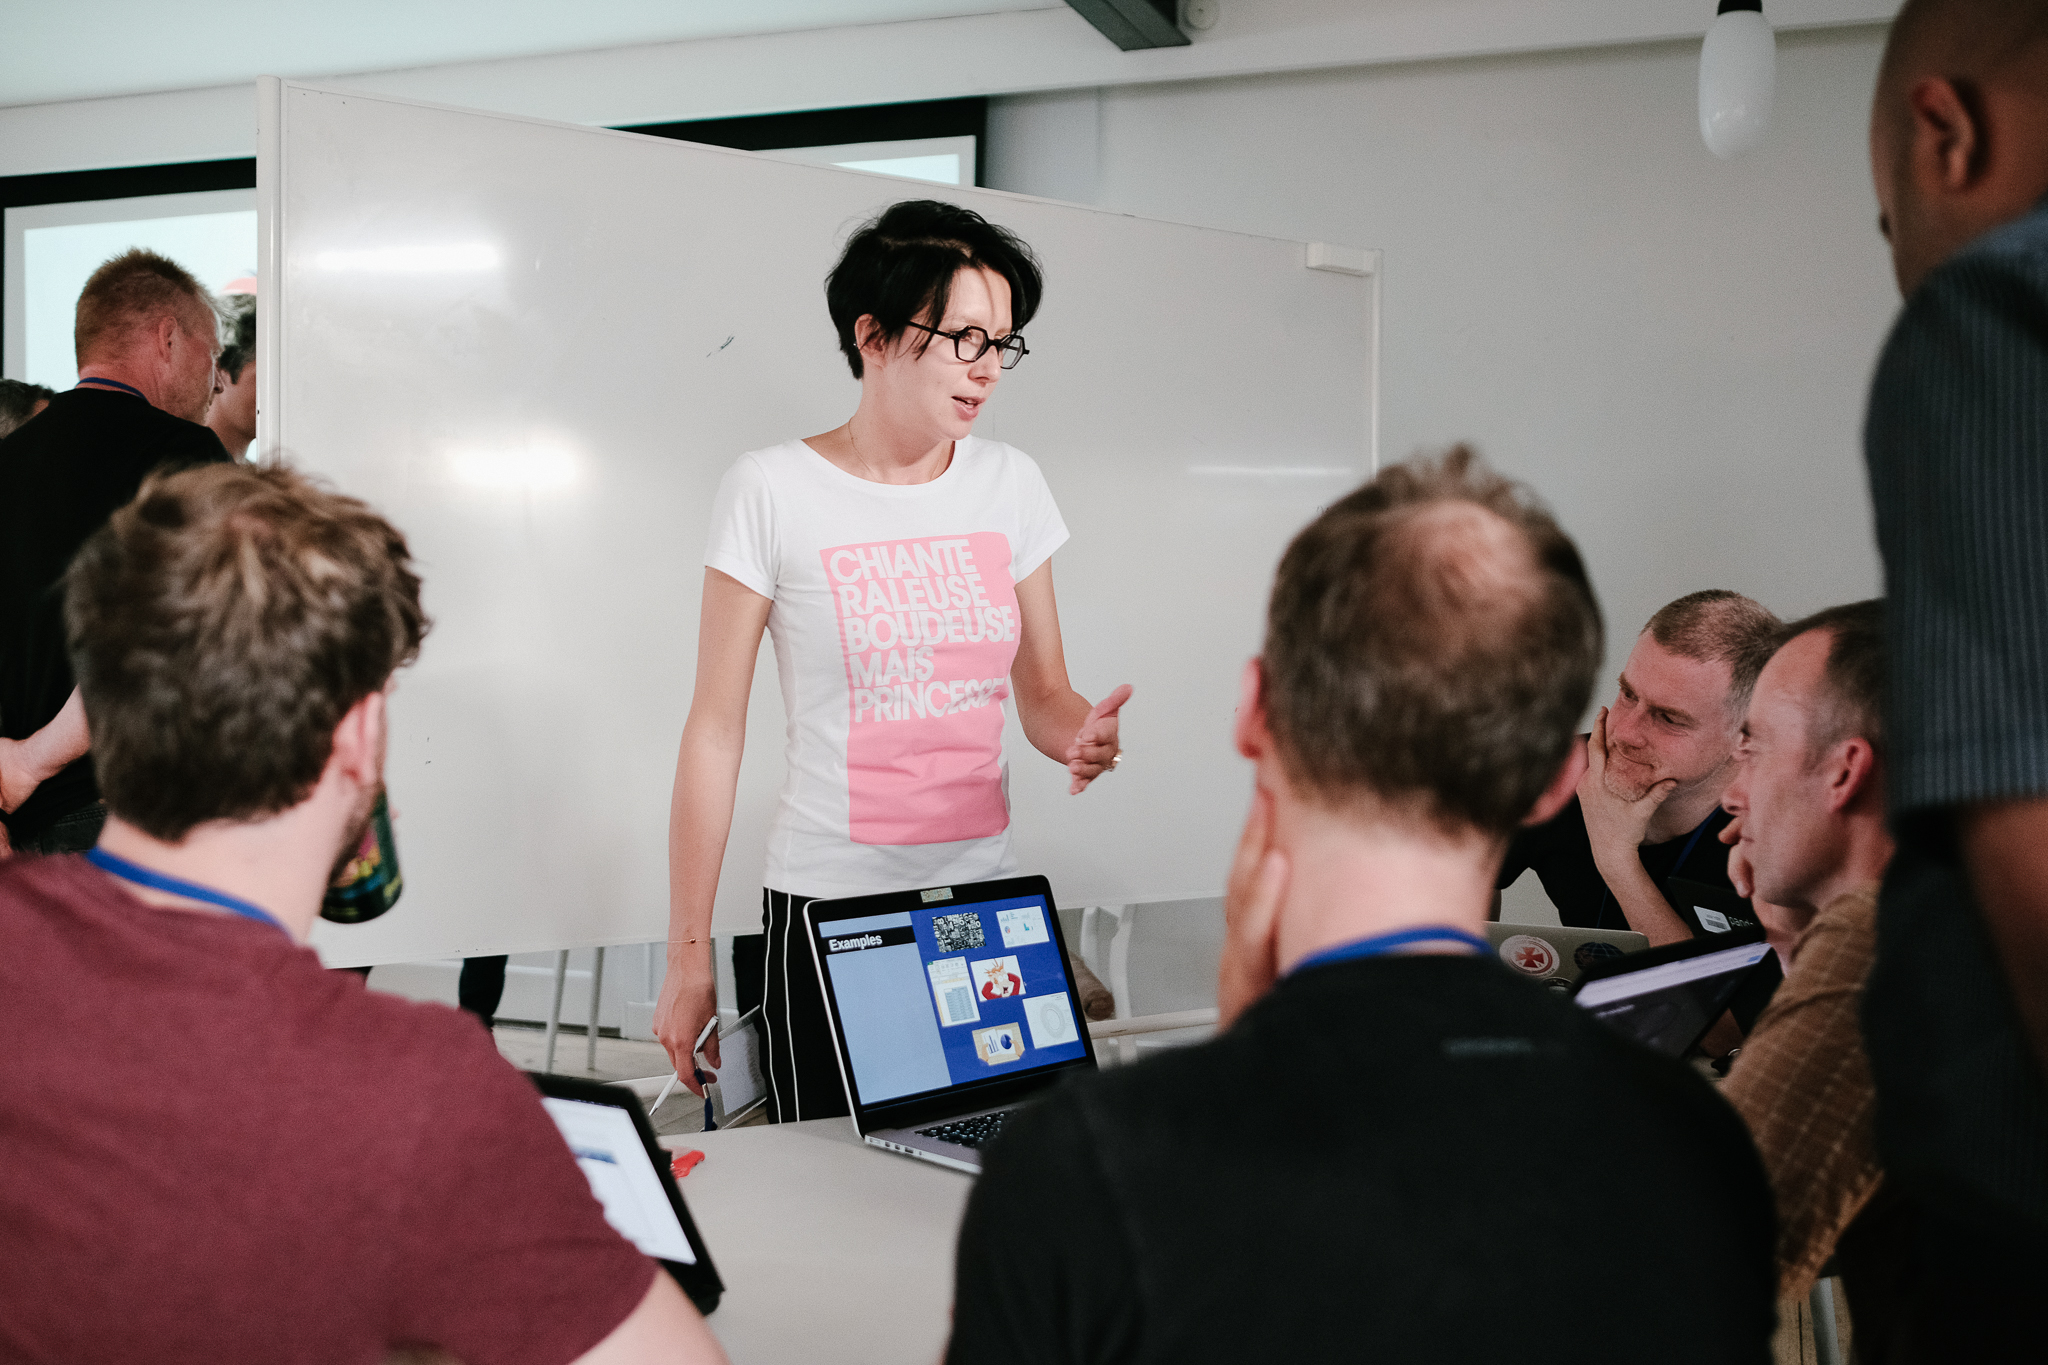
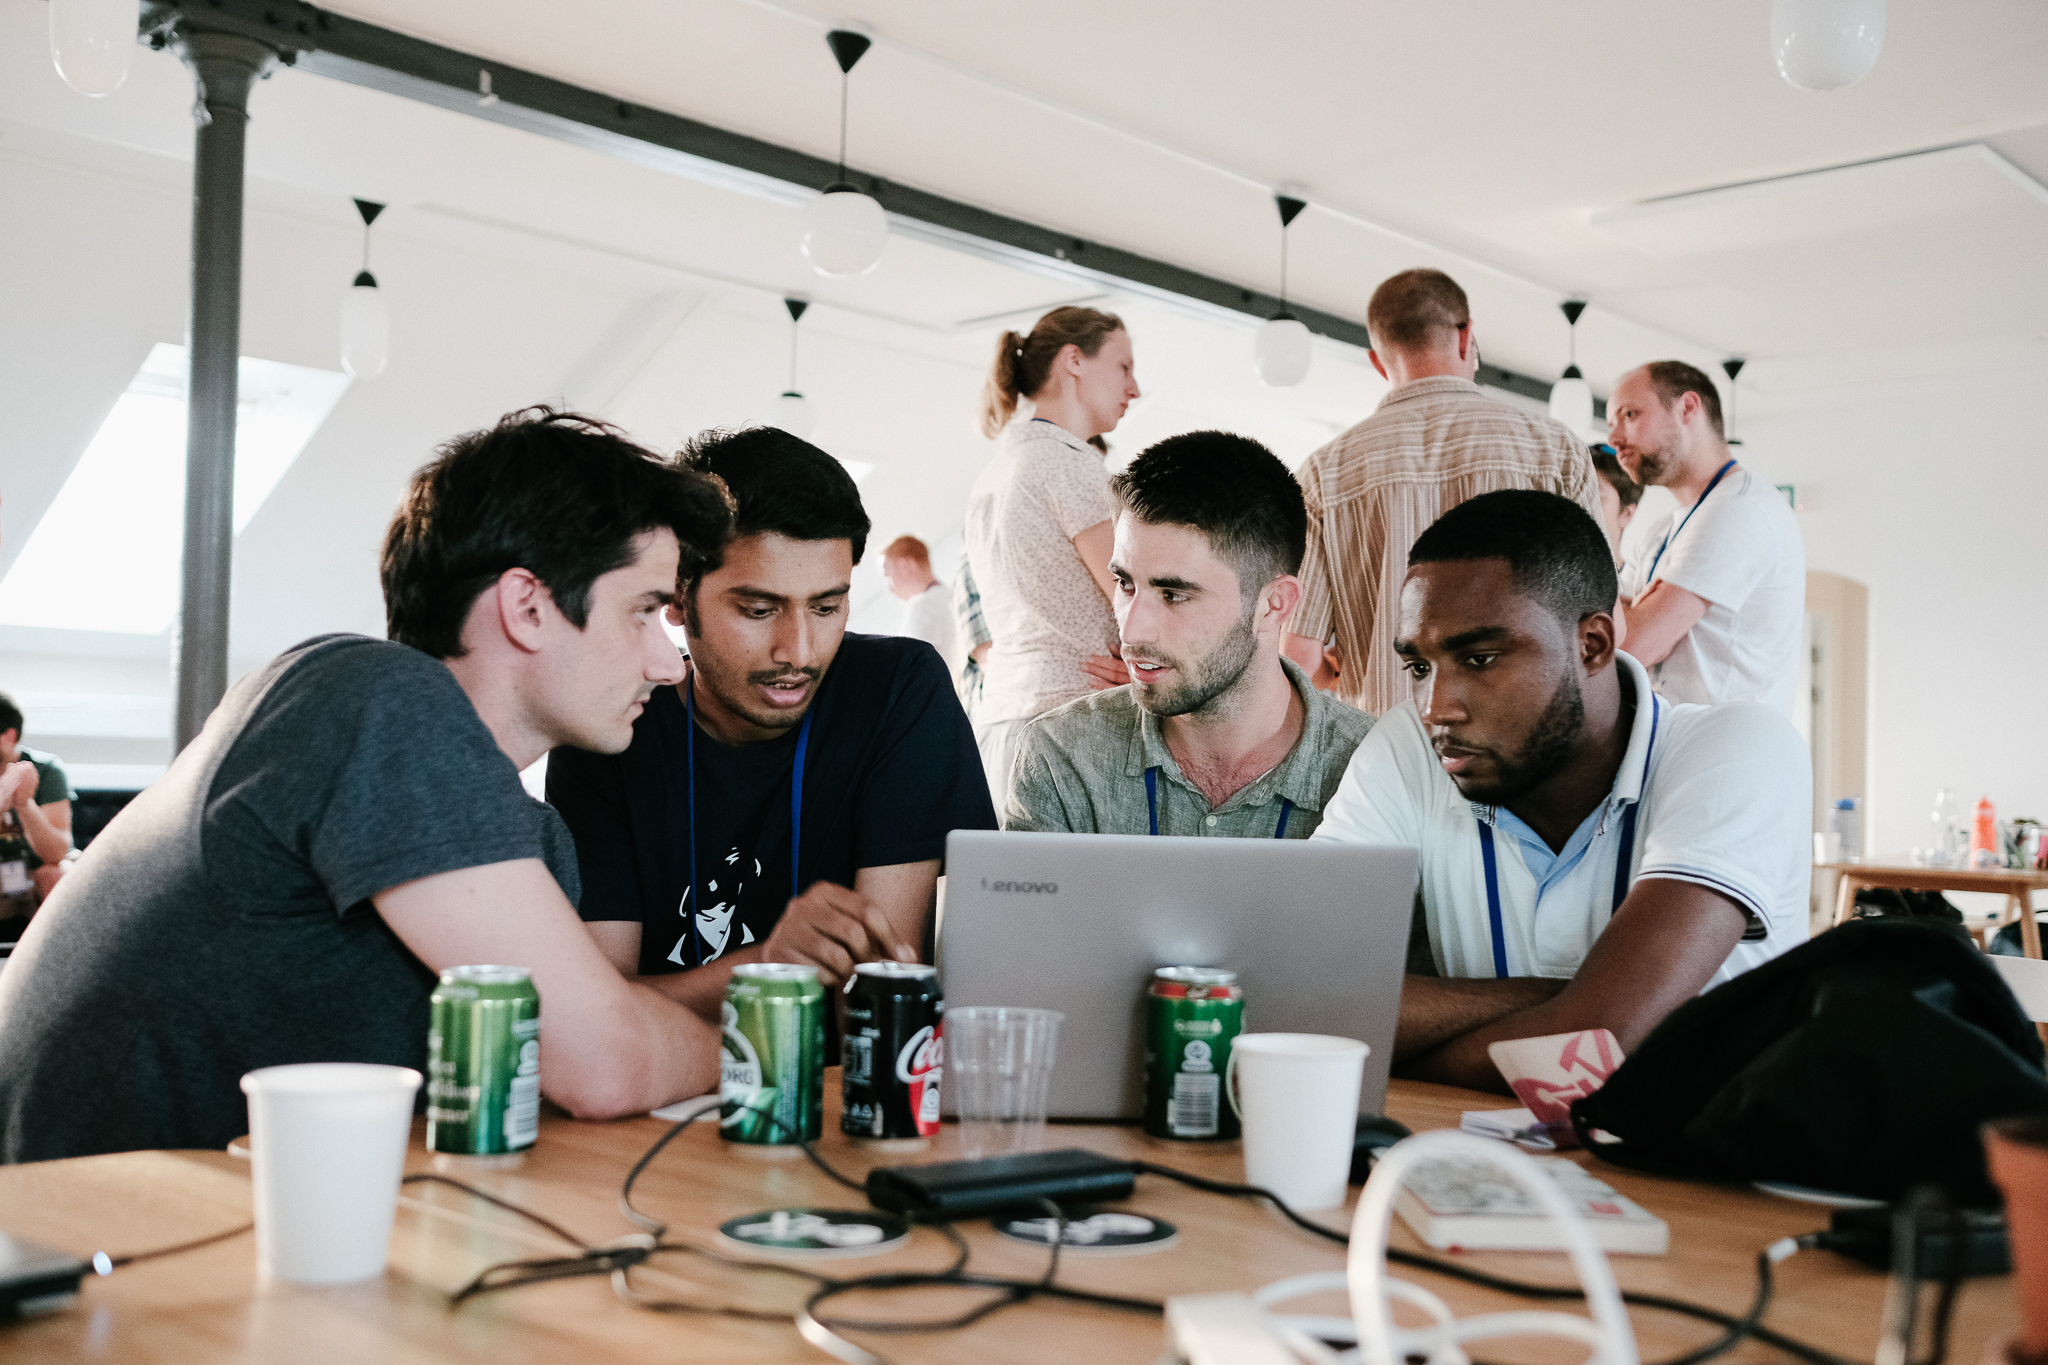
The code show in full swing. 

The code show in full swing. 

v 2.0 next year... maybe?

The booth experience was new to us. Quite a few people came to find us, so it was nice to have a base, rather than cruising around as we usually do. I'd been hoping to get more people set up with Python on their own machines, but this may be too in-depth for most people in a trade show setting. Most were happy to see some new things and maybe tap out some Python on a keyboard.

Overall, I'd call it a successful experiment. If we do it next year in London, we have a very good idea of how to shape an even more engaging experience. I think most visitors enjoyed themselves this year though; If you were one of them, we'd love to hear from you!

Big open data... or is it?

Huge news for data scientists and educators. Equinor, the company formerly known as Statoil, has taken a bold step into the open data arena. On Thursday last week, it 'disclosed' all of its subsurface and production data for the Volve oil field, located in the North Sea. 

What's in the data package?

A lot! The 40,000-file package contains 5TB of data, that's 5,000GB!

volve_data.png

This collection is substantially larger, both deeper and broader, than any other open subsurface dataset I know of. Most excitingly, Equinor has released a broad range of data types, from reports to reservoir models: 3D and 4D seismic, well logs and real-time drilling records, and everything in between. The only slight problem is that the seismic data are bundled in very large files at the moment; we've asked for them to be split up.

Questions about usage rights

Regular readers of this blog will know that I like open data. One of the cornerstones of open data is access, and there's no doubt that Equinor have done something incredible here. It would be preferable not to have to register at all, but free access to this dataset — which I'm guessing cost more than USD500 million to acquire — is an absolutely amazing gift to the subsurface community.

Another cornerstone is the right to use the data for any purpose. This involves the owner granting certain privileges, such as the right to redistribute the data (say, for a class exercise) or to share derived products (say, in a paper). I'm almost certain that Equinor intends the data to be used this way, but I can't find anything actually granting those rights. Unfortunately, if they aren't explicitly granted, the only safe assumption is that you cannot share or adapt the data.

For reference, here's the language in the CC-BY 4.0 licence:


Subject to the terms and conditions of this Public License, the Licensor hereby grants You a worldwide, royalty-free, non-sublicensable, non-exclusive, irrevocable license to exercise the Licensed Rights in the Licensed Material to:

  1. reproduce and Share the Licensed Material, in whole or in part; and
  2. produce, reproduce, and Share Adapted Material.
 

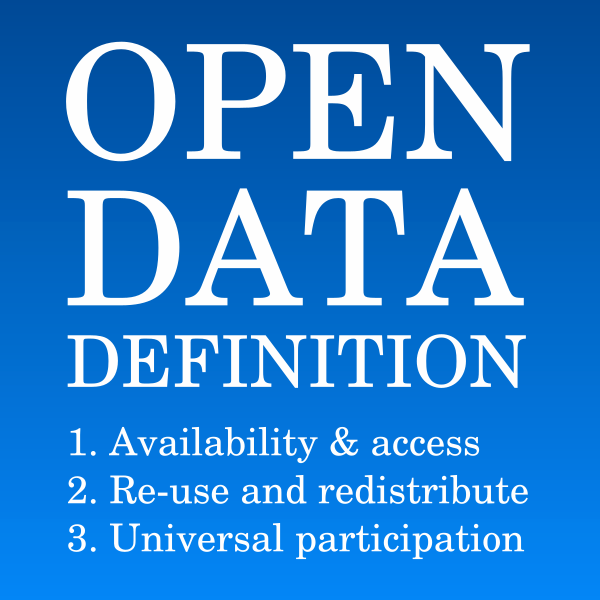
You can dig further into the requirements for open data in the Open Data Handbook.

The last thing we need is yet another industry dataset with unclear terms, so I hope Equinor attaches a clear licence to this dataset soon. Or, better still, just uses a well-known licence such as CC-BY (this is what I'd recommend). This will clear up the matter and we can get on with making the most of this amazing resource.

More about Volve

The Volve field was discovered in 1993, but not developed until 15 years later. It produced oil and gas for 8.5 years, starting on 12 February 2008 and ending on 17 September 2016, though about half of that came in the first 2 years (see below). The facility was the Maersk Inspirer jack-up rig, standing in 80 m of water, with an oil storage vessel in attendance. Gas was piped to Sleipner A. In all, the field produced 10 million Sm³ (63 million barrels) of oil, so is small by most standards, with a peak rate of 56,000 barrels per day.

Volve production over time in standard m³ (i.e. at 20°C). Multiply by 6.29 for barrels.

Volve production over time in standard m³ (i.e. at 20°C). Multiply by 6.29 for barrels.

The production was from the Jurassic Hugin Formation, a shallow-marine sandstone with good reservoir properties, at a depth of about 3000 m. The top reservoir depth map from the discovery report in the data package is shown here. (I joined Statoil in 1997, not long after this report was written, and the sight of this page brings back a lot of memories.)


The top reservoir depth map from the discovery report. The Volve field (my label) is the small closure directly north of Sleipner East, with 15/9-19 well on it.


Get the data

To explore the dataset, you must register in the 'data village', which Equinor has committed to maintaining for 2 years. It only takes a moment. You can get to it through this link.

Let us know in the comments what you think of this move, and do share what you get up to with the data!

Visualize this!

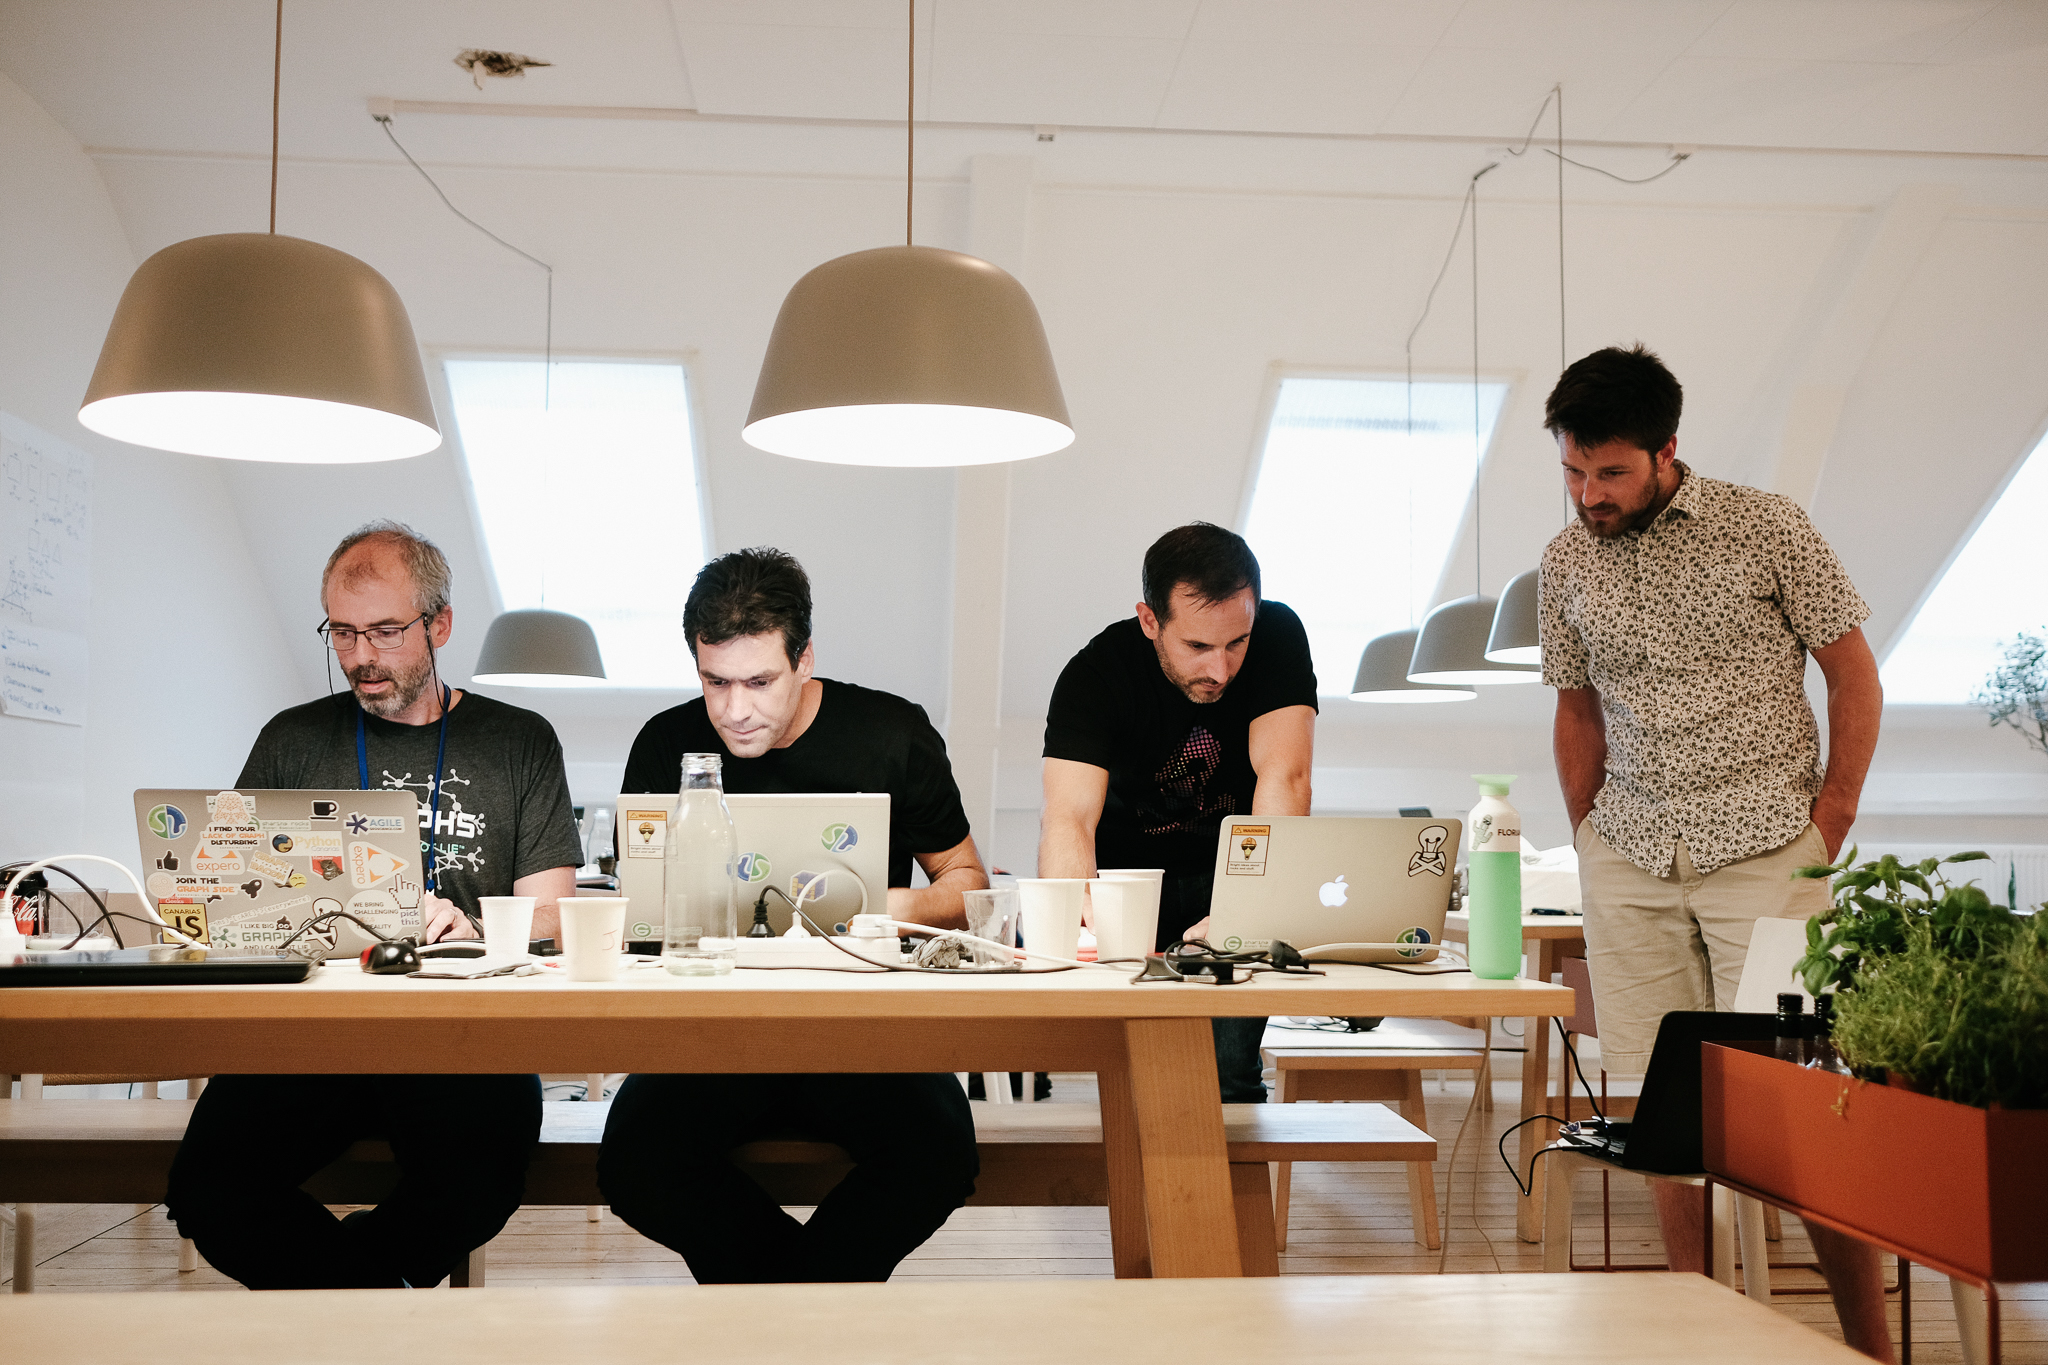
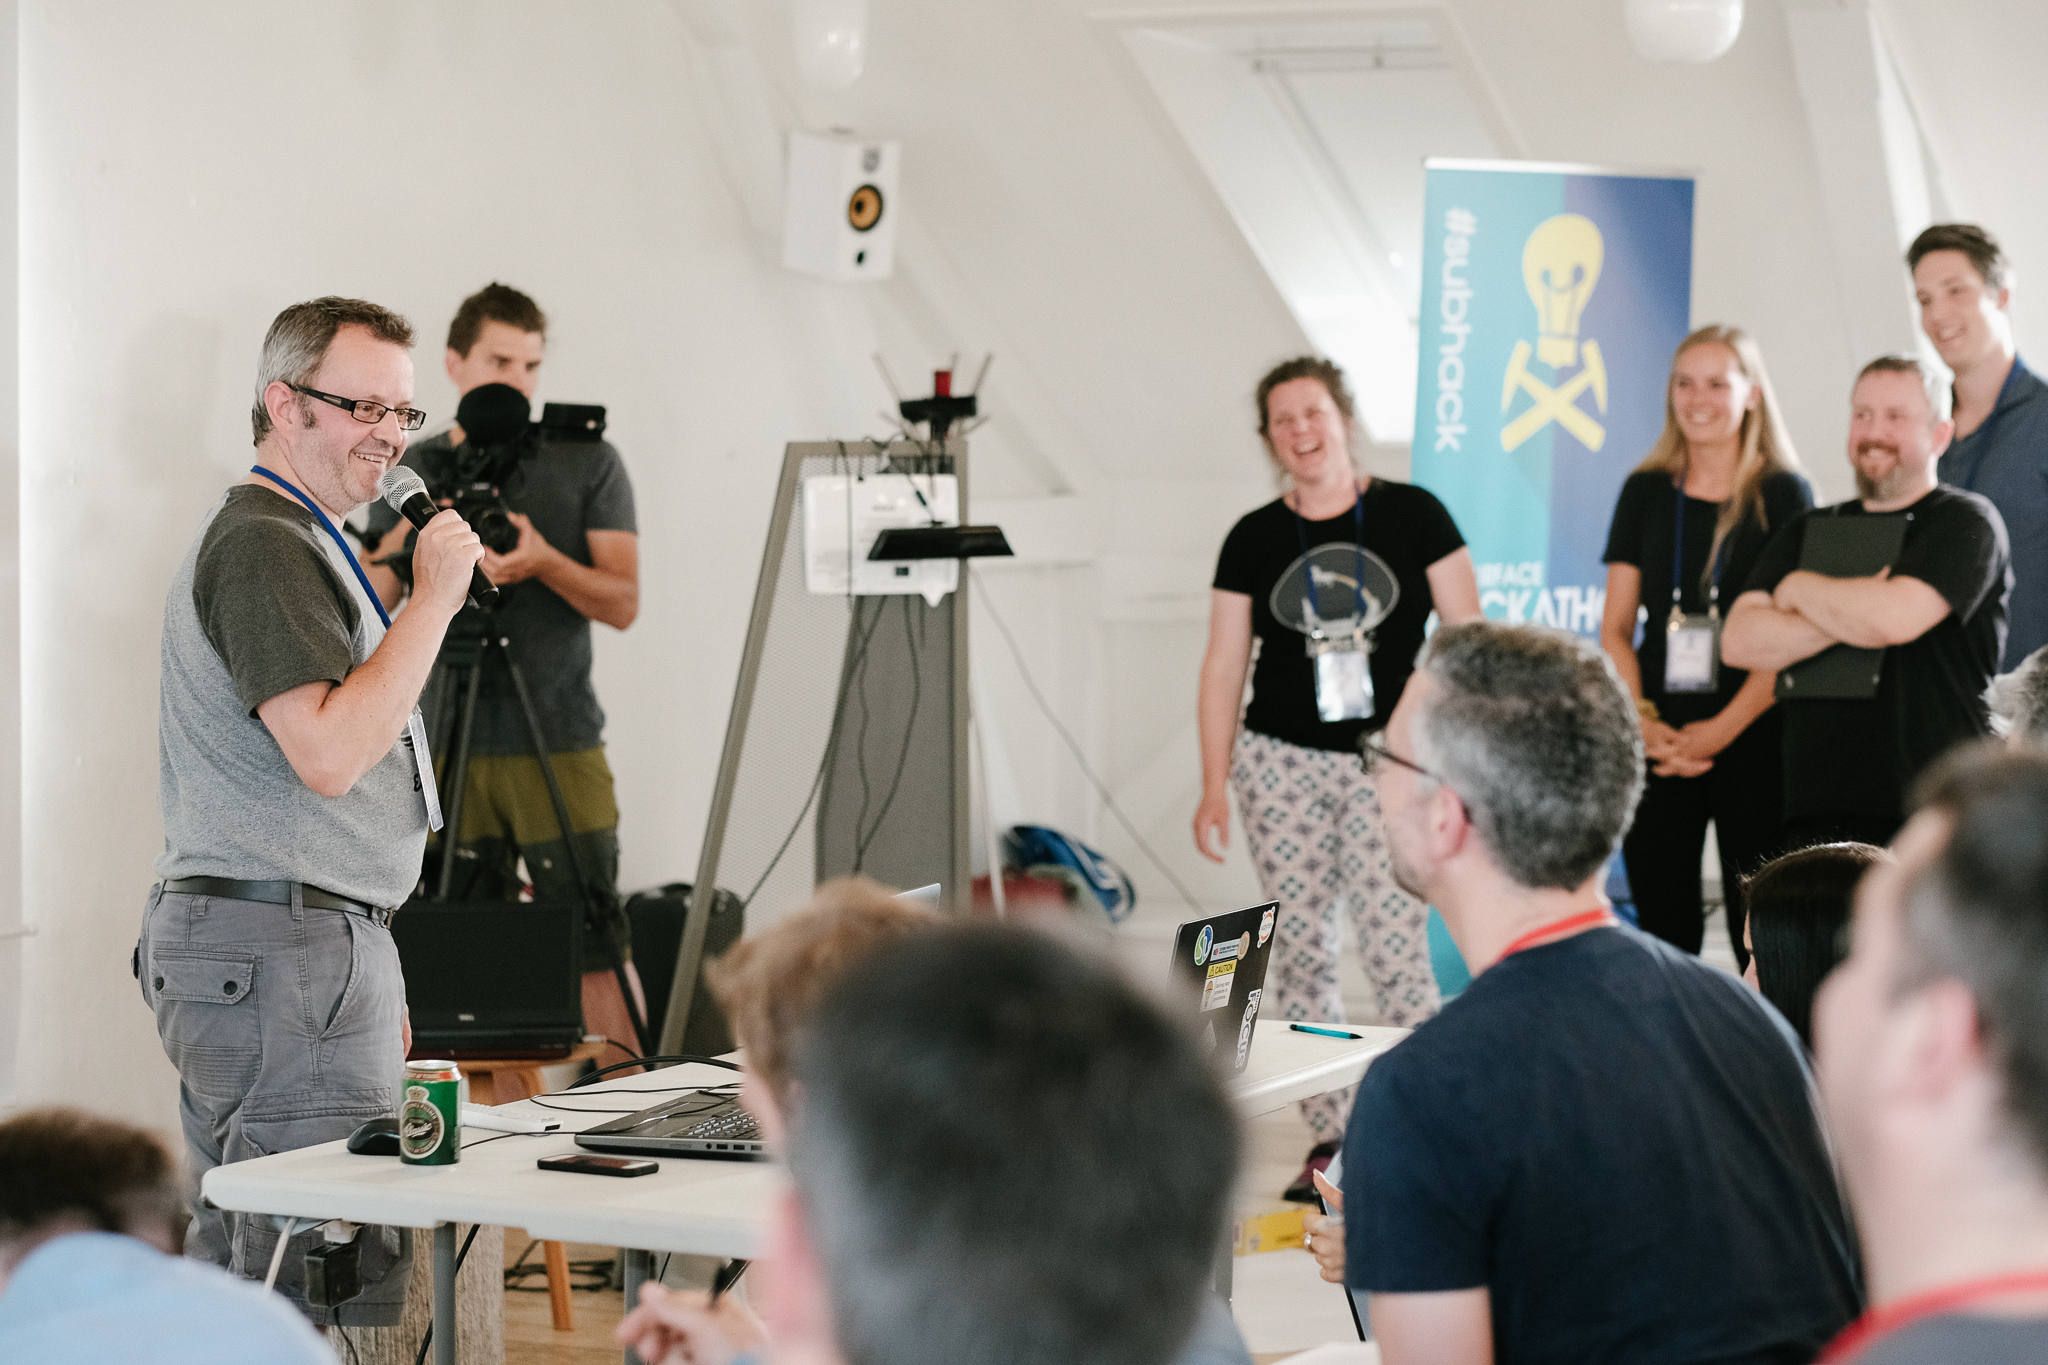
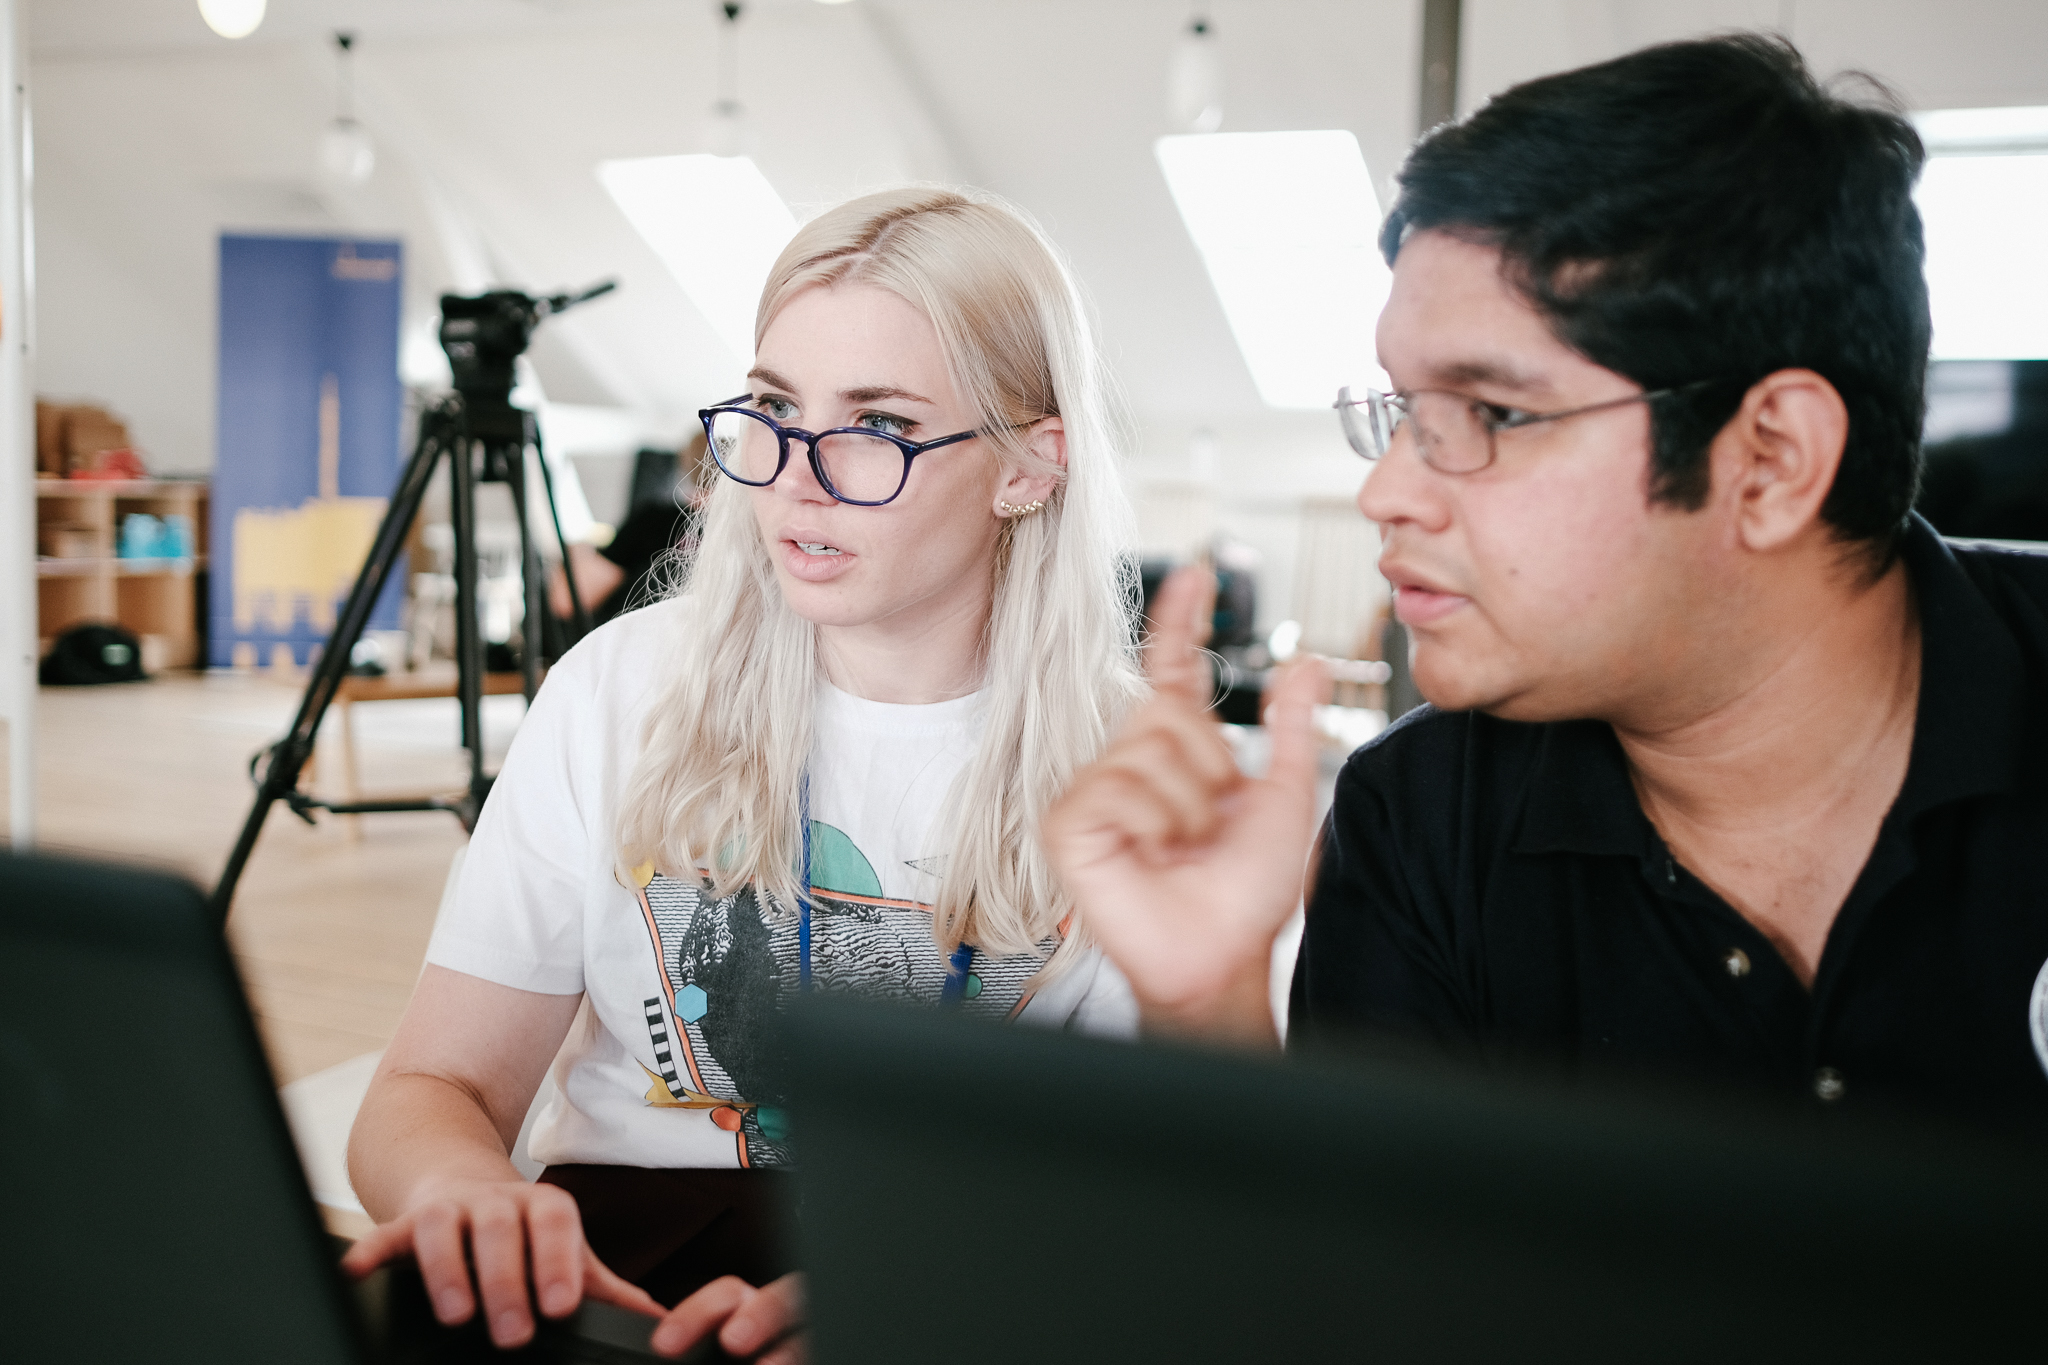
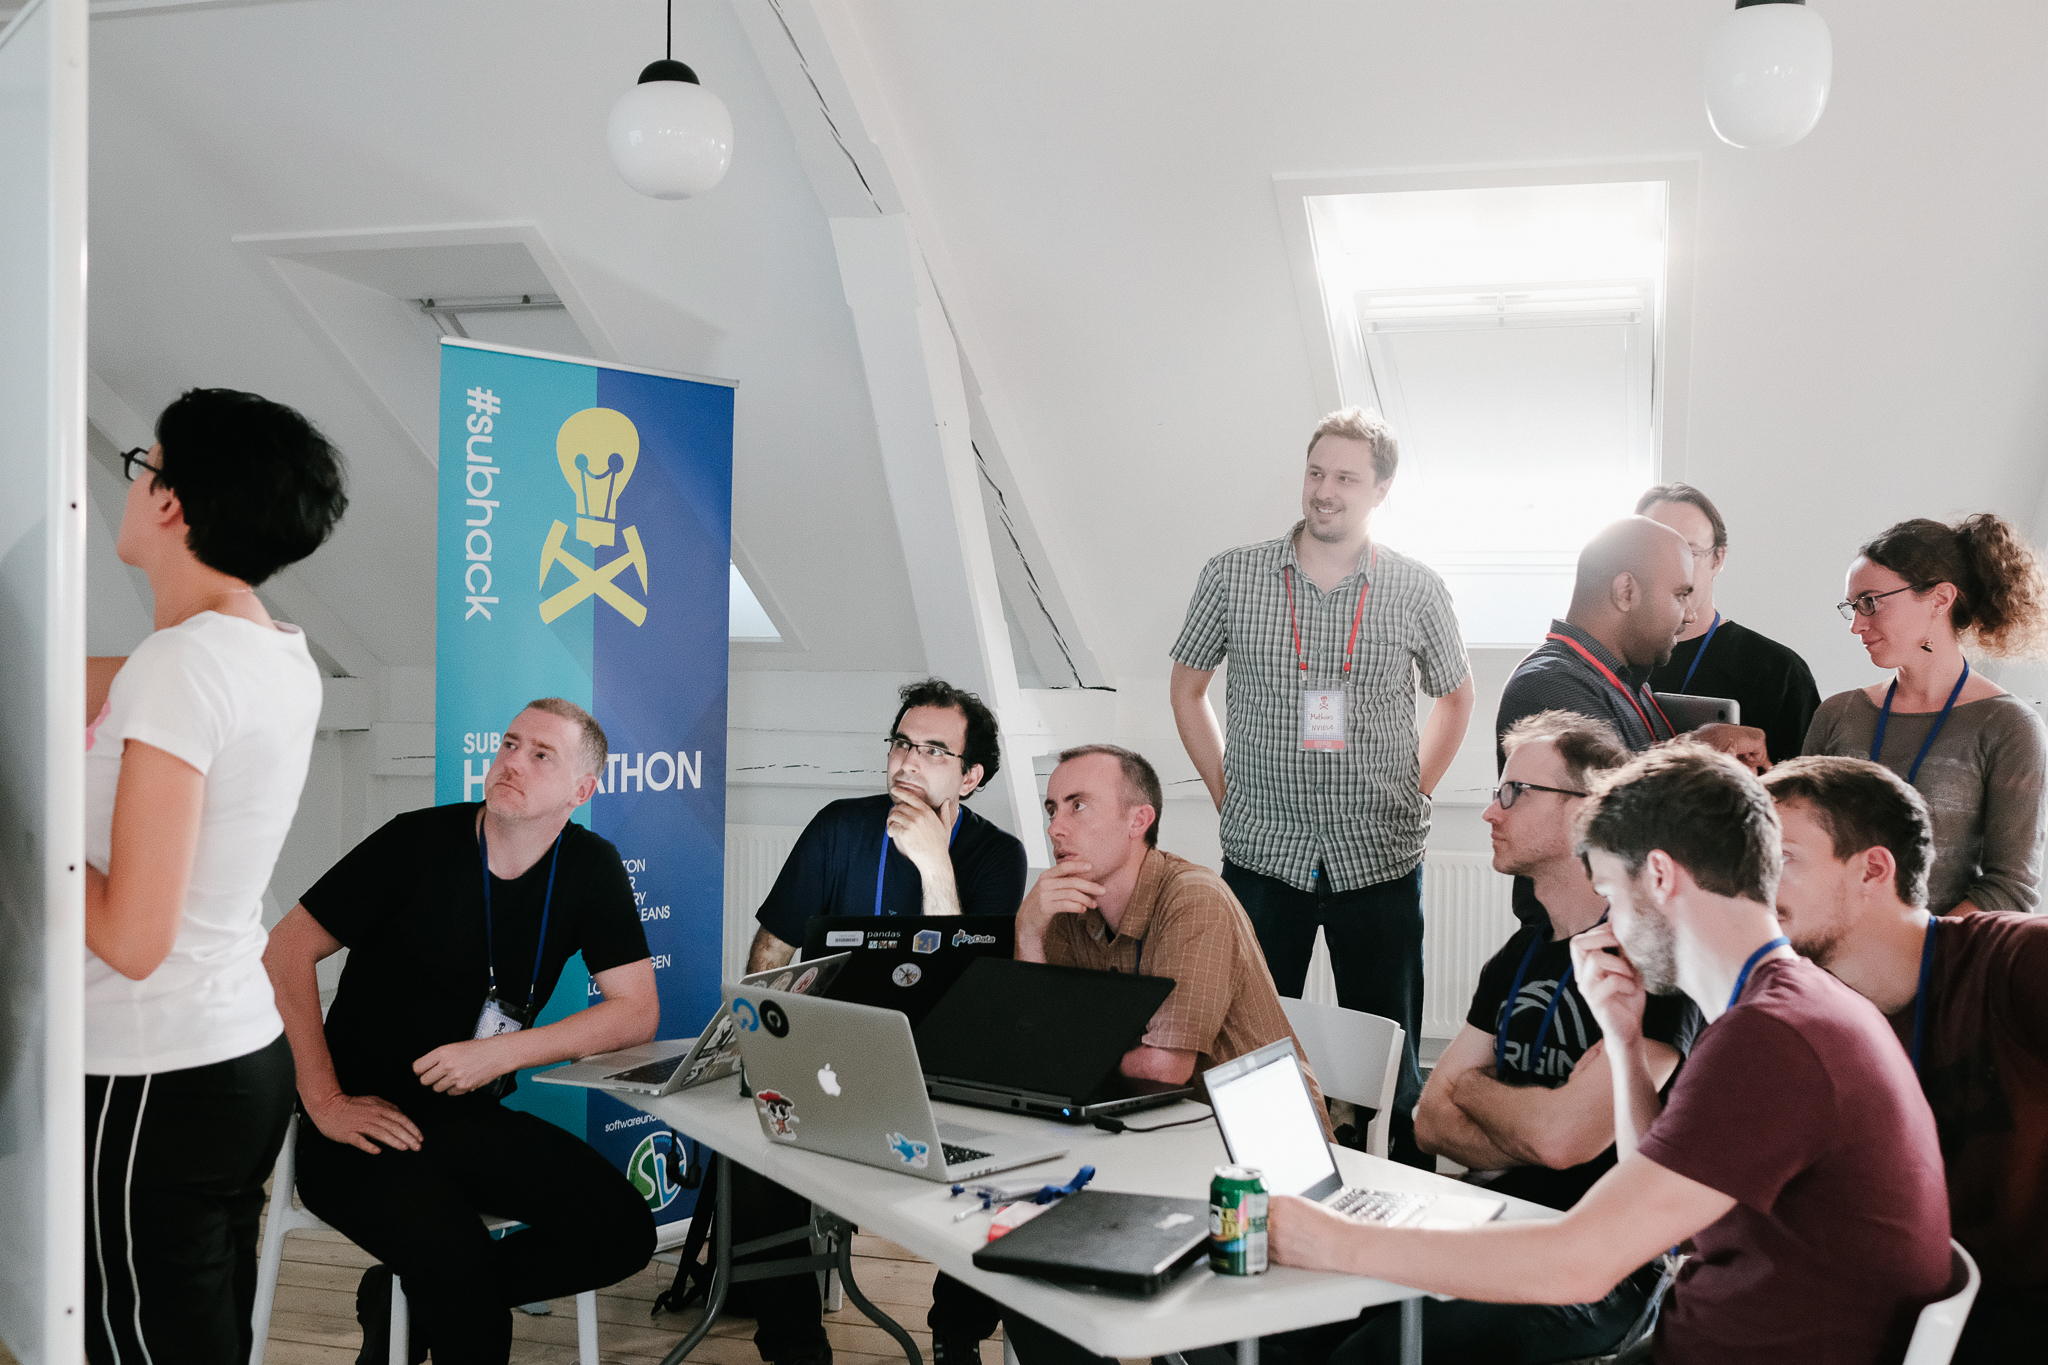
The Copenhagen edition of the Subsurface Hackathon is over! For three days during the warmest June in Denmark for over 100 years, 63 geoscientists and programmers cooked up hot code in the Rainmaking Loft, one of the coolest, and warmest, coworking spaces you've ever seen. As always, every one of the participants brought their A game, and the weekend flew by in a blur of creativity, coffee, and collaboration. And croissants.

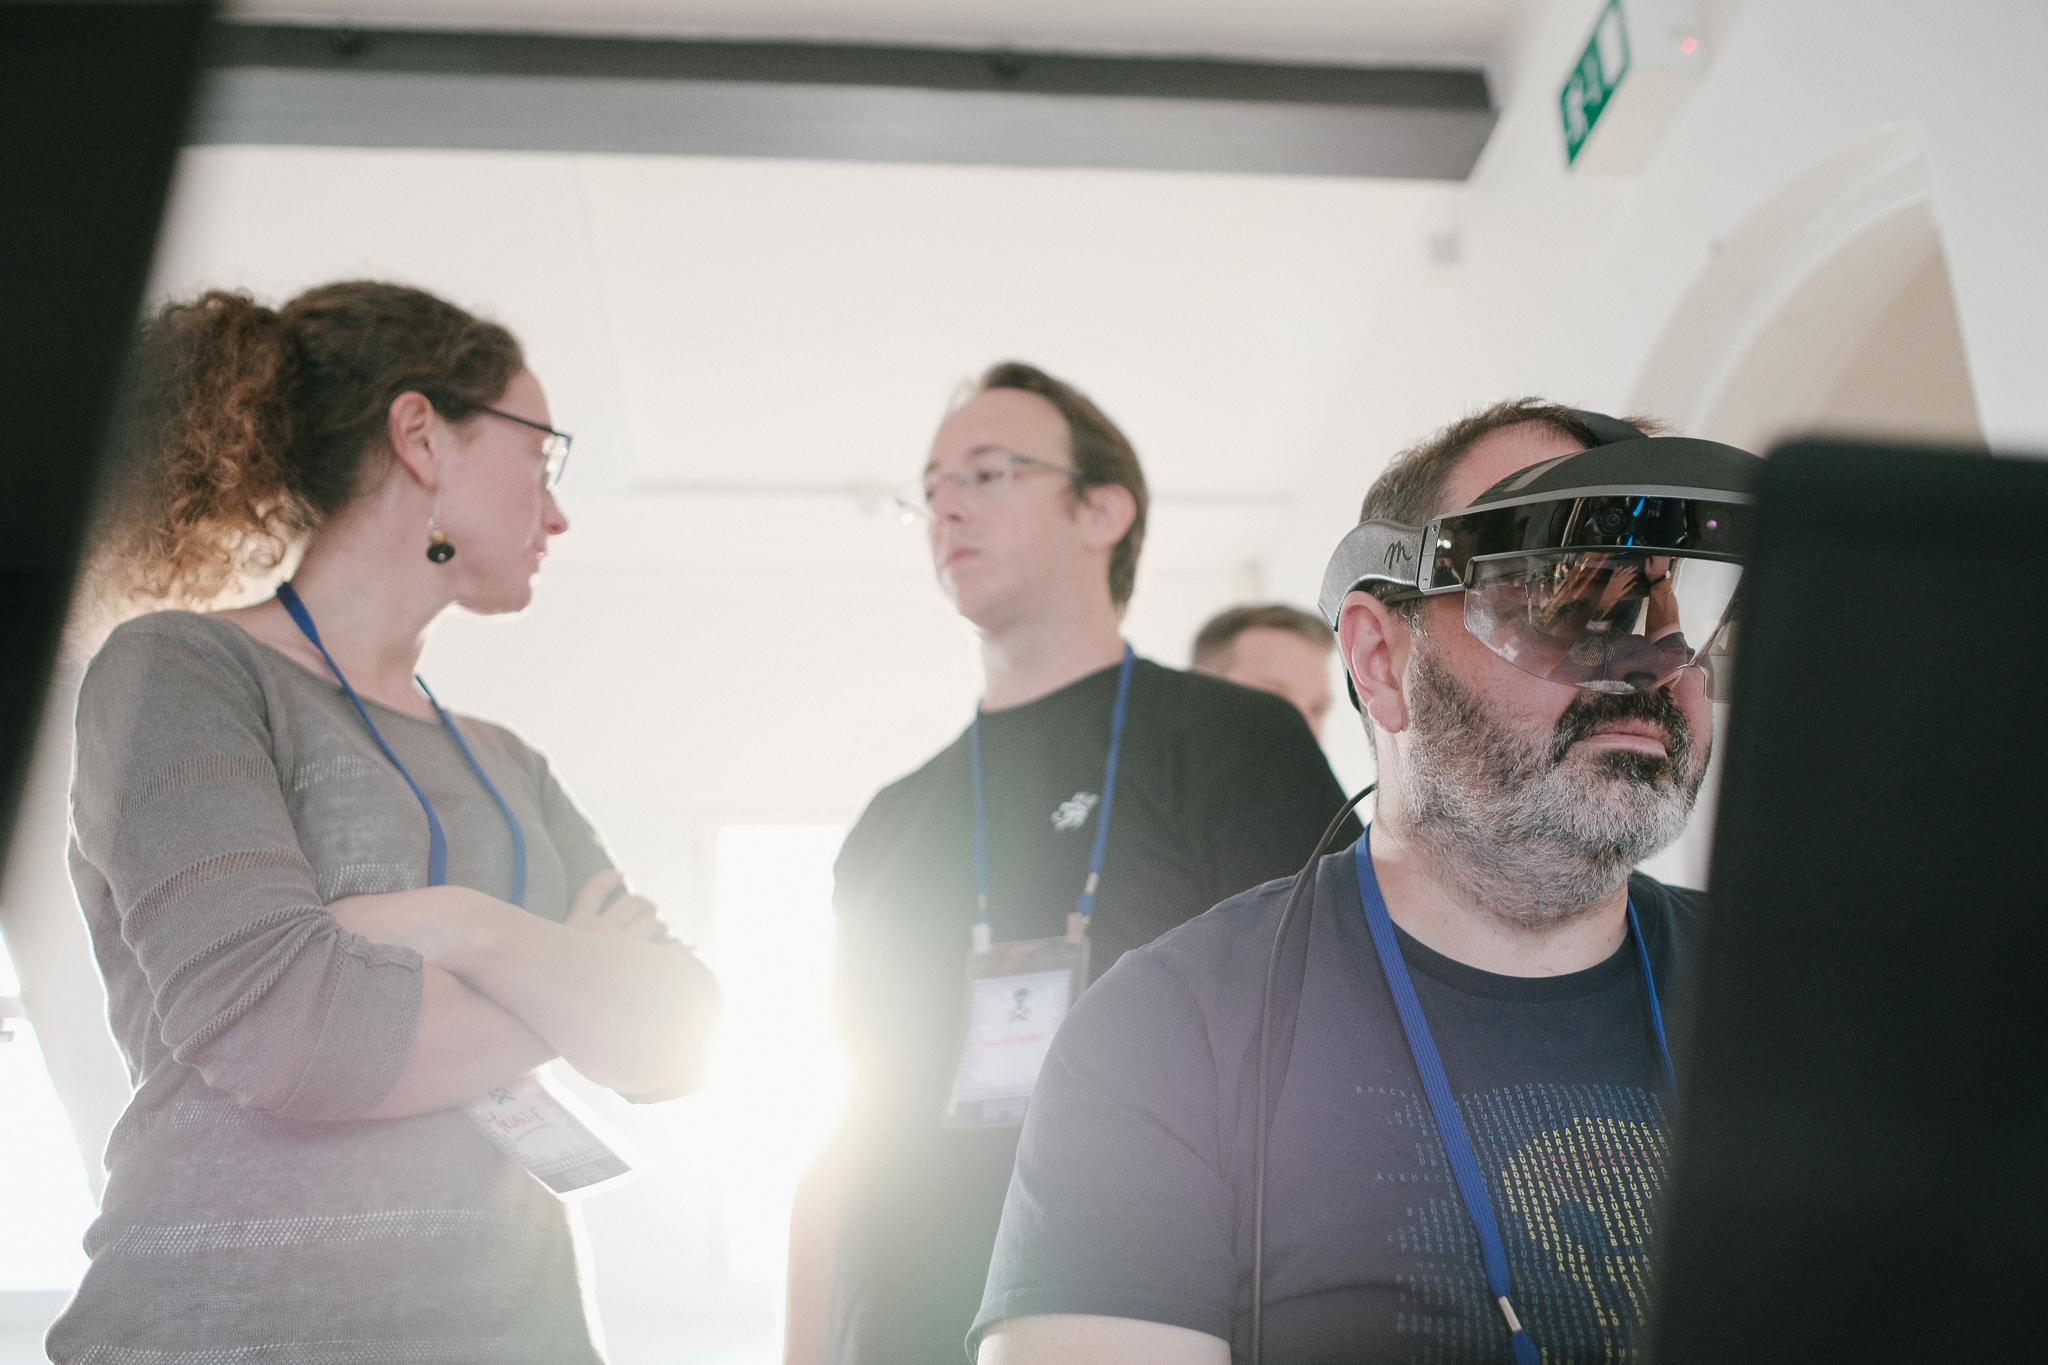
Pierre enjoying the Meta AR headset that DEll EMC provided.

Pierre enjoying the Meta AR headset that DEll EMC provided.

Our sponsors have always been unusually helpful and inspiring, pushing us to get more audacious, but this year they were exceptionally engaged and proactive. Dell EMC, in the form of David and Keith, provided some fantastic tech for the teams to explore; Total supported Agile throughout the organization phase, and Wintershall kindly arranged for the event to be captured on film — something I hope to be able to share soon. See below for the full credit roll!

sponsors.png

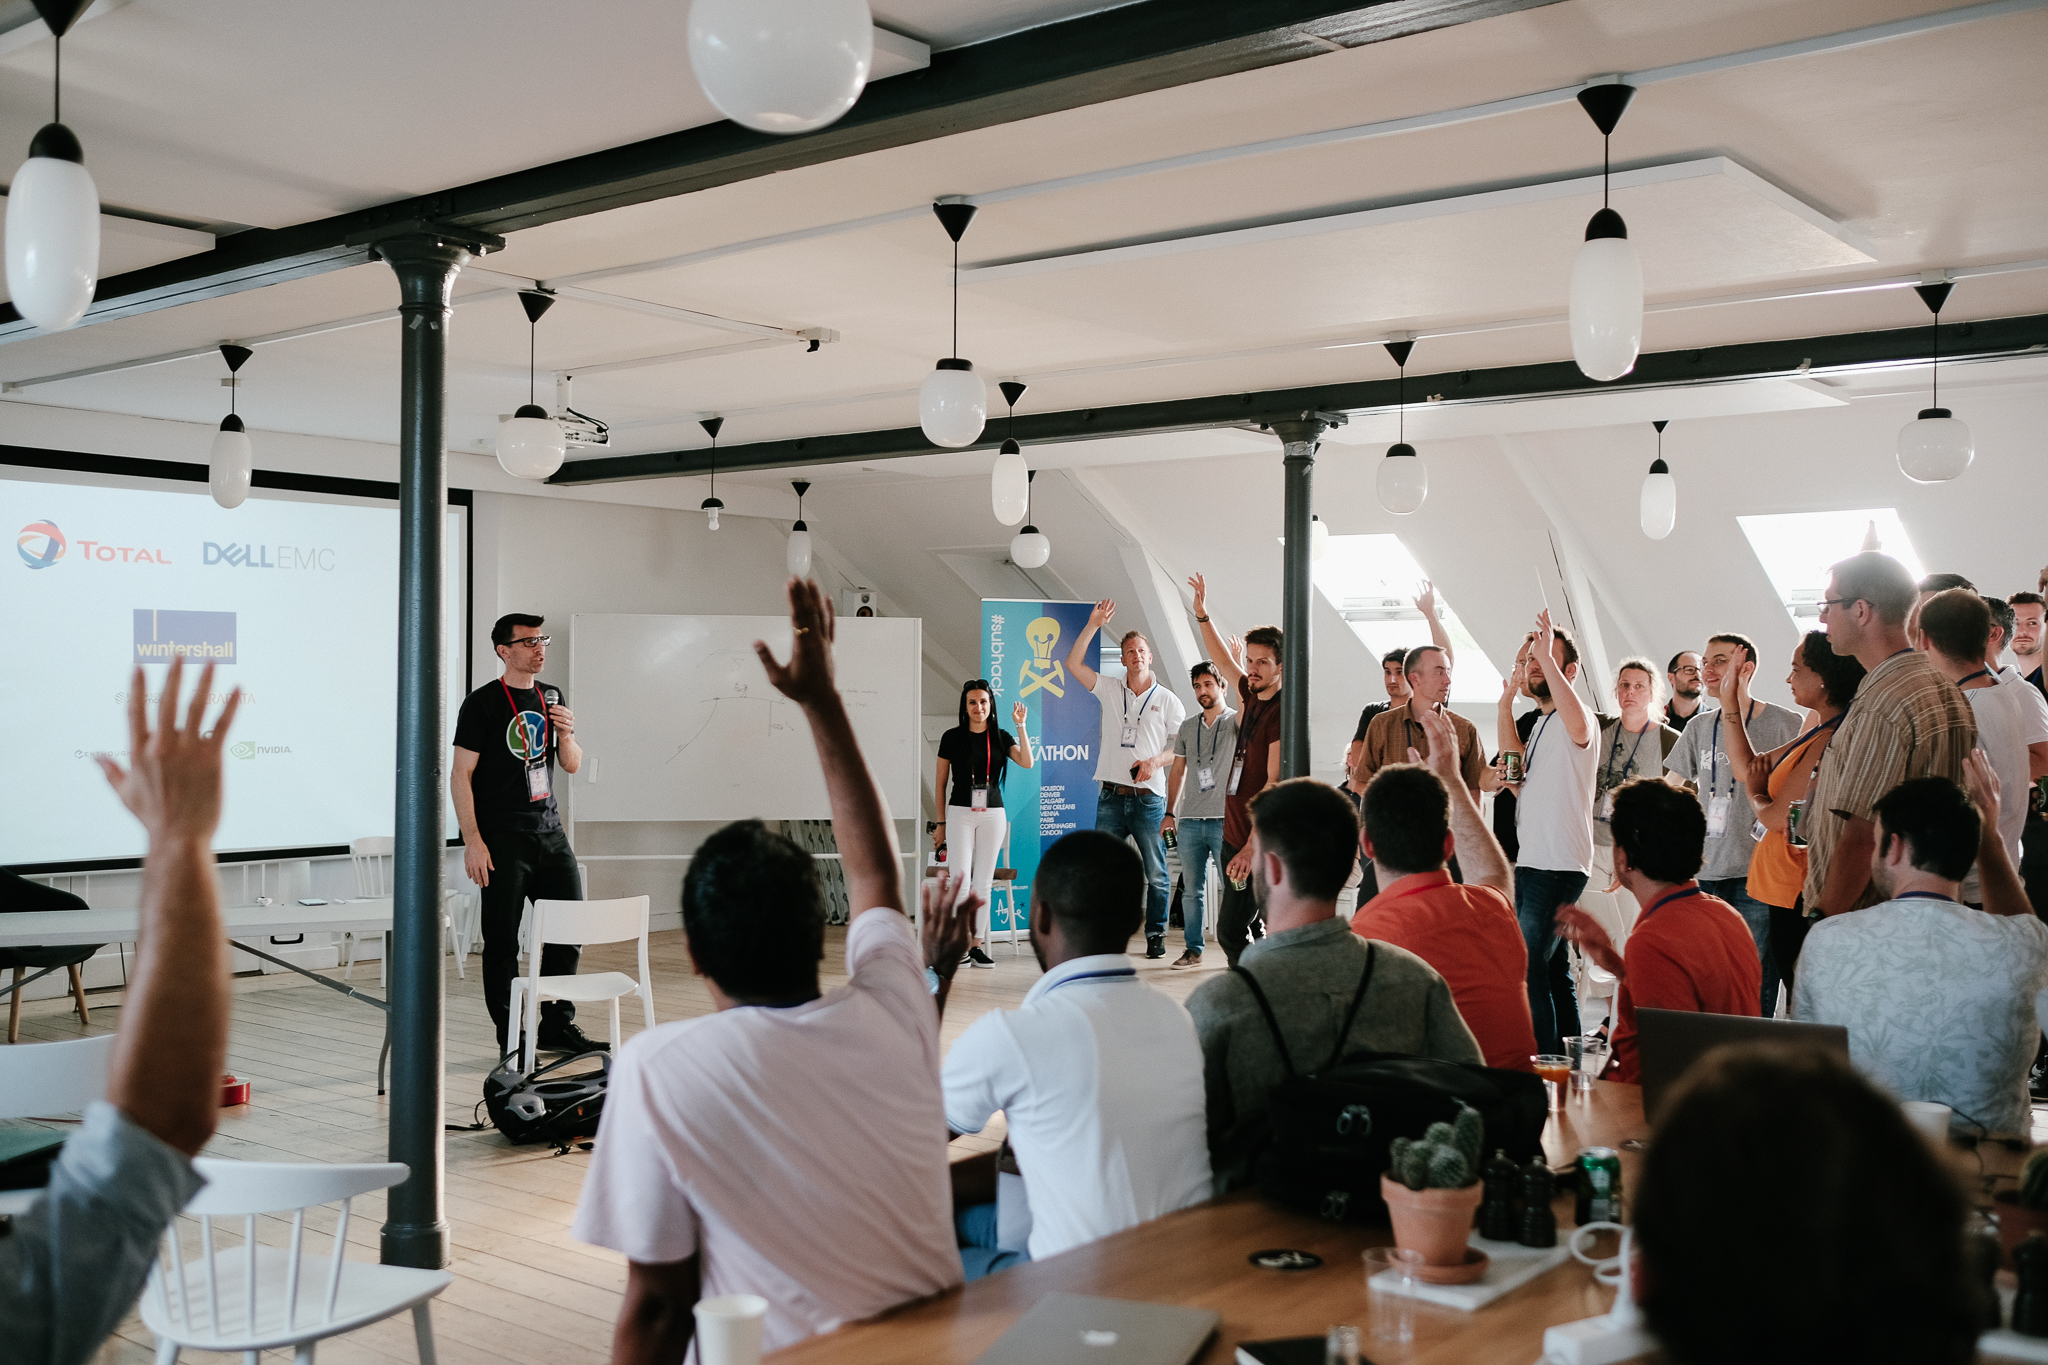
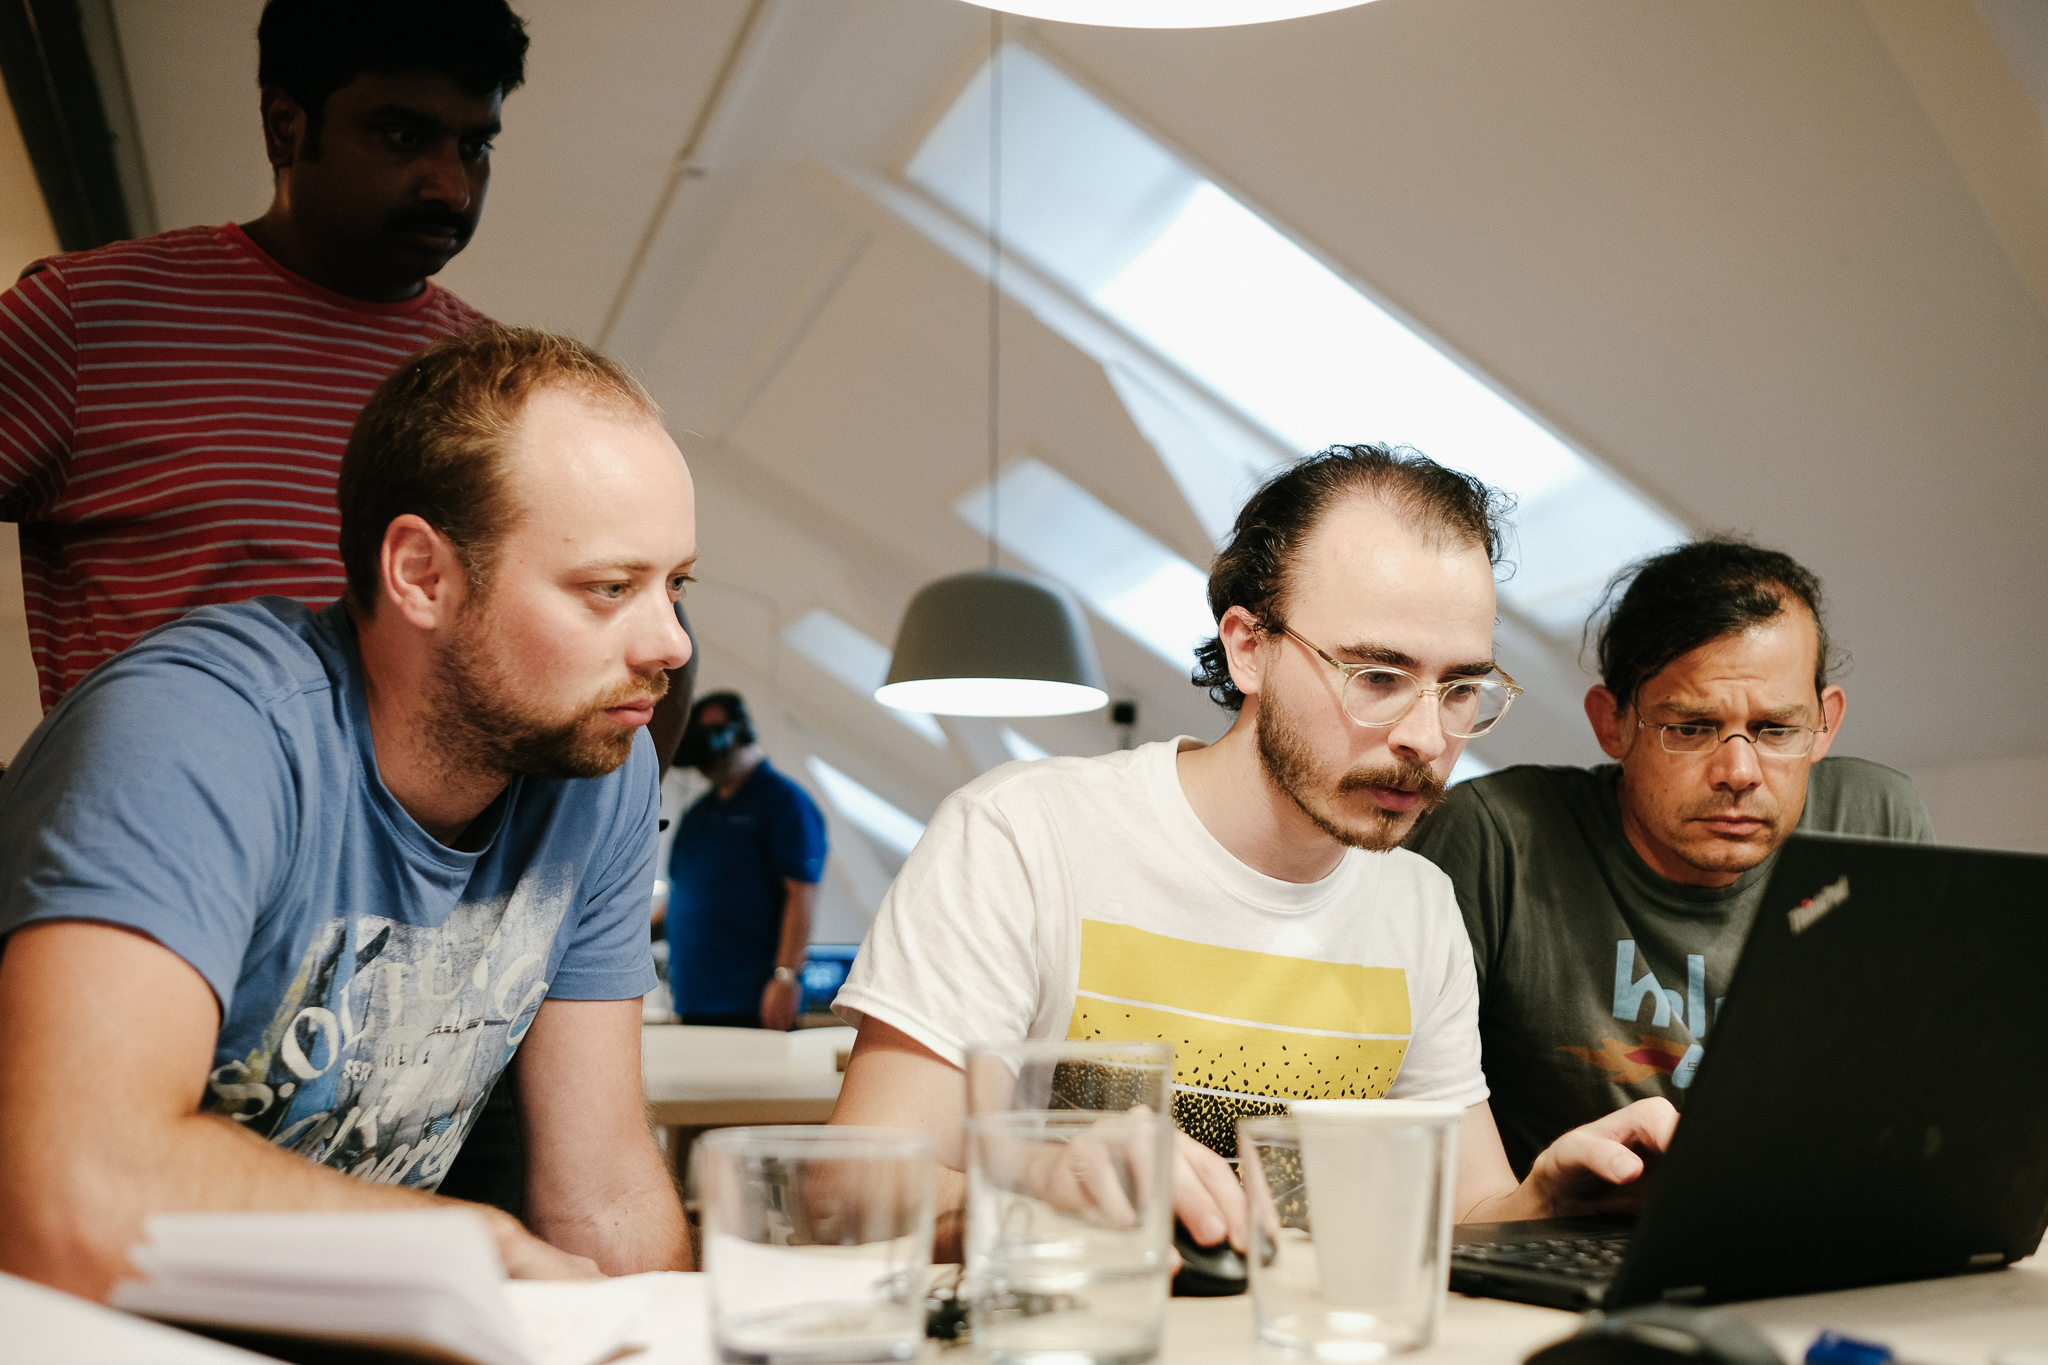
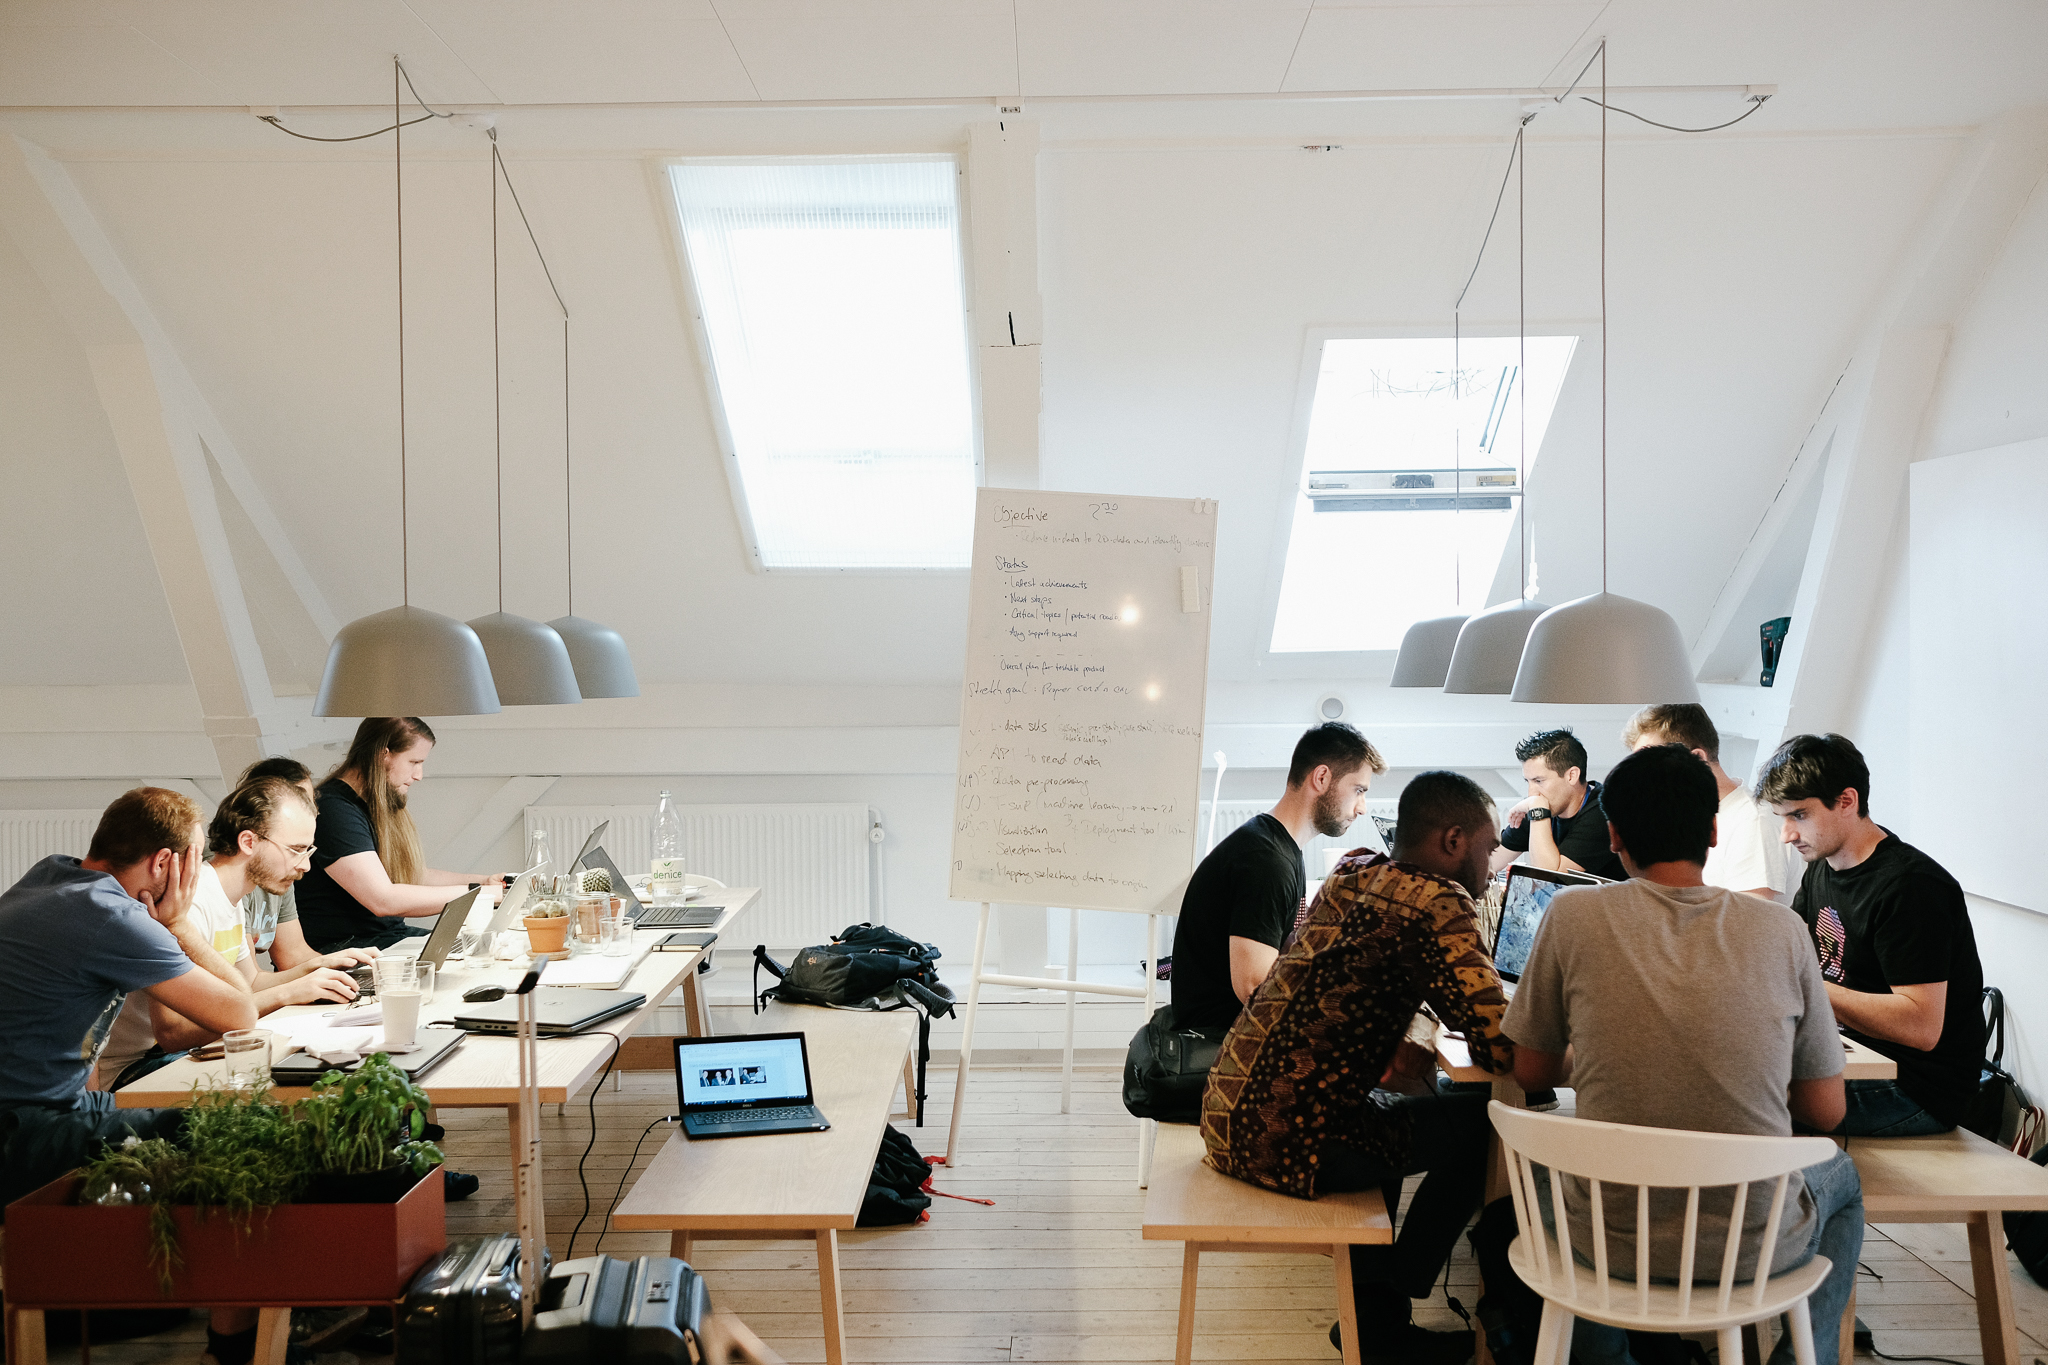
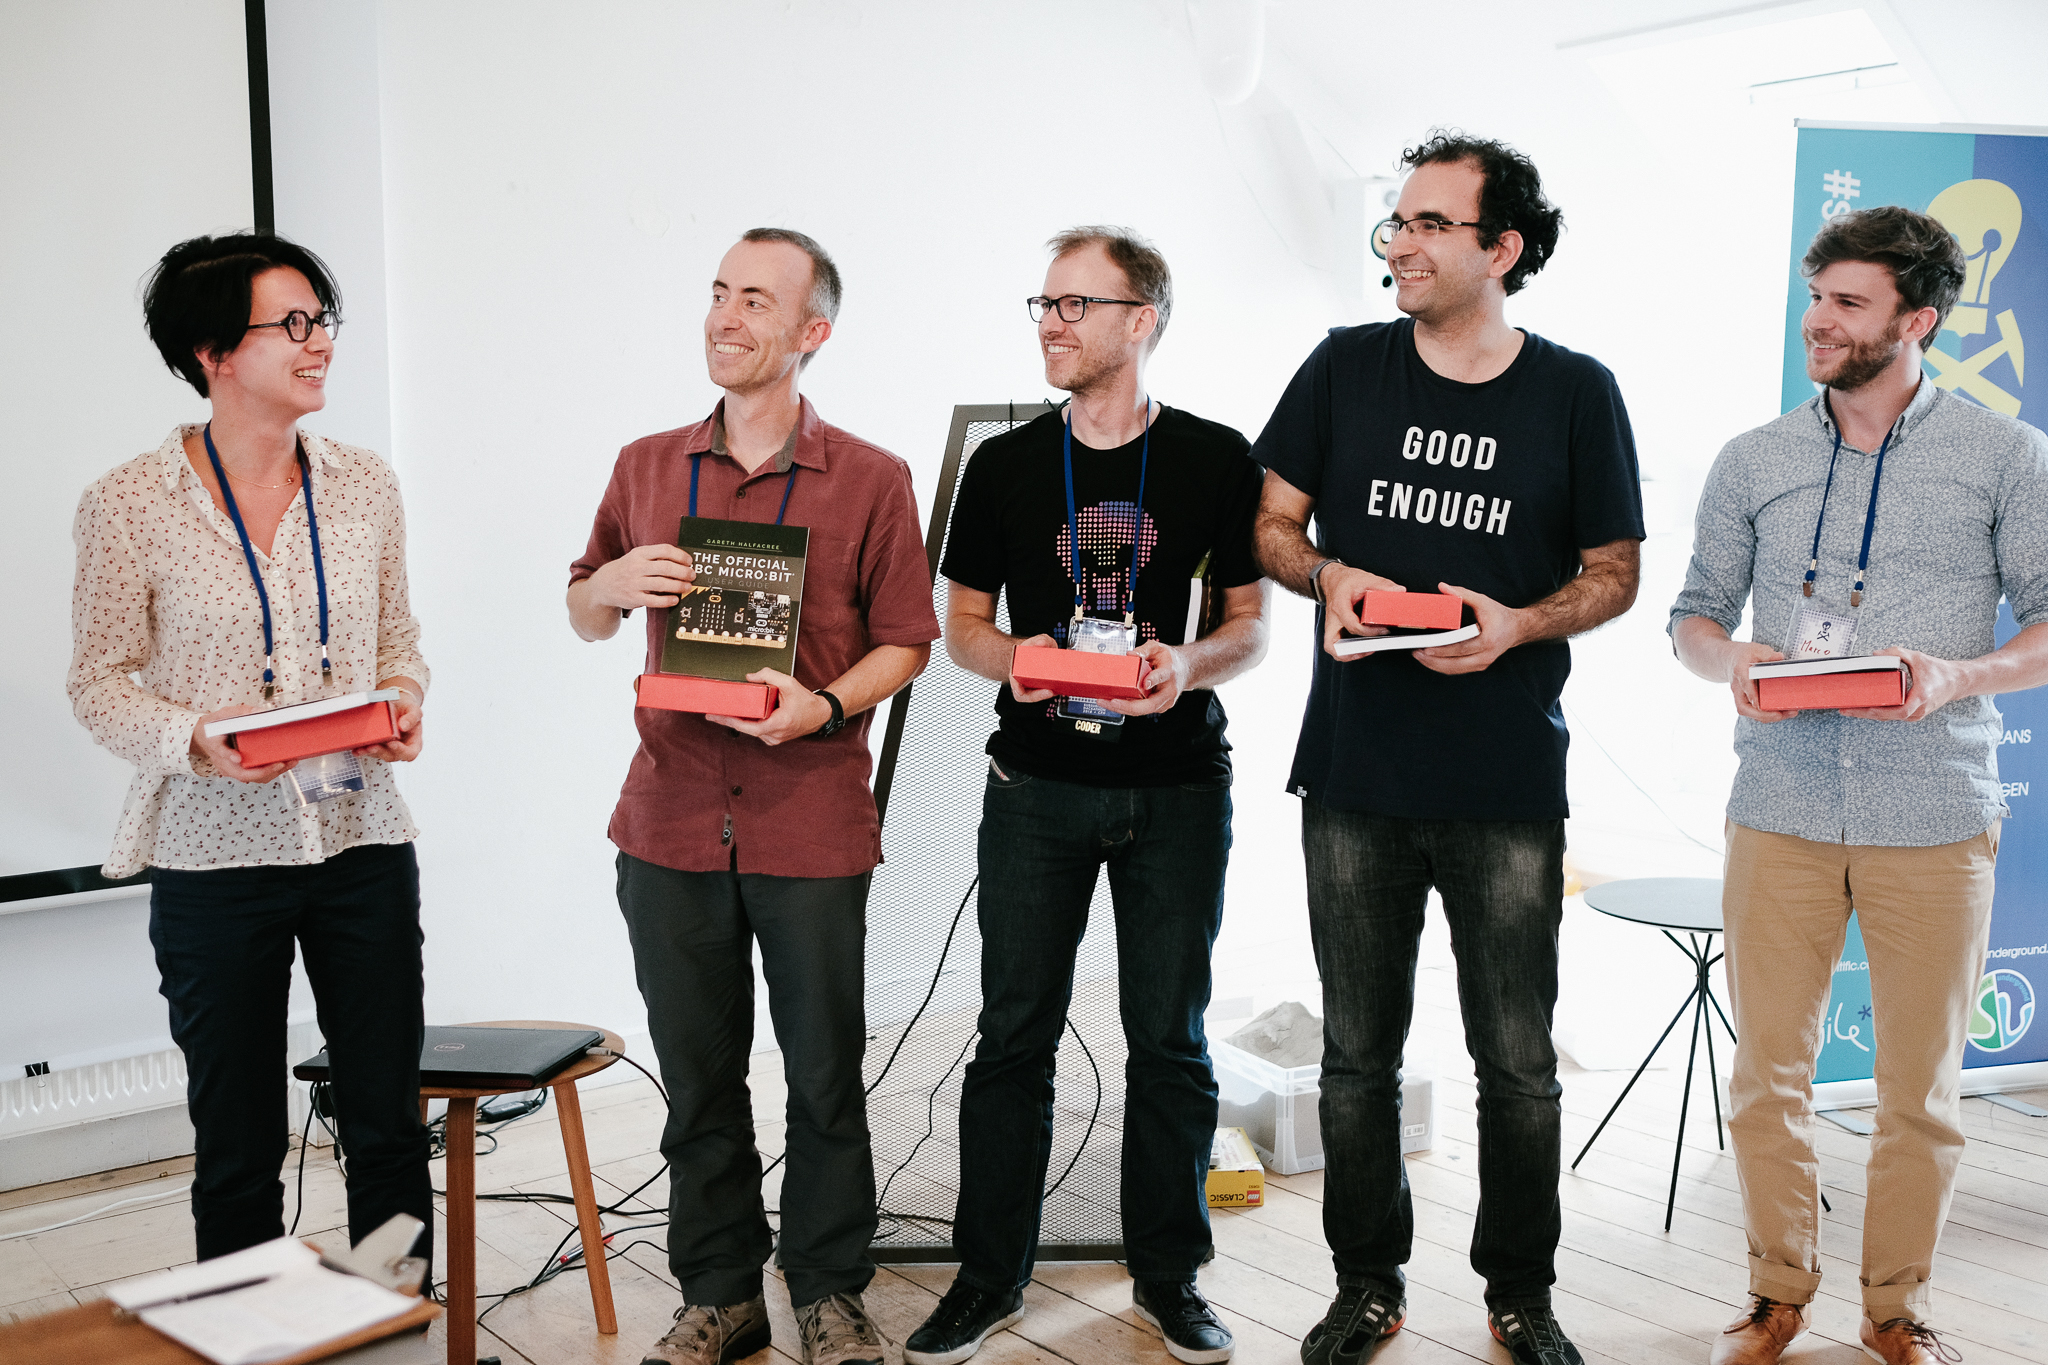
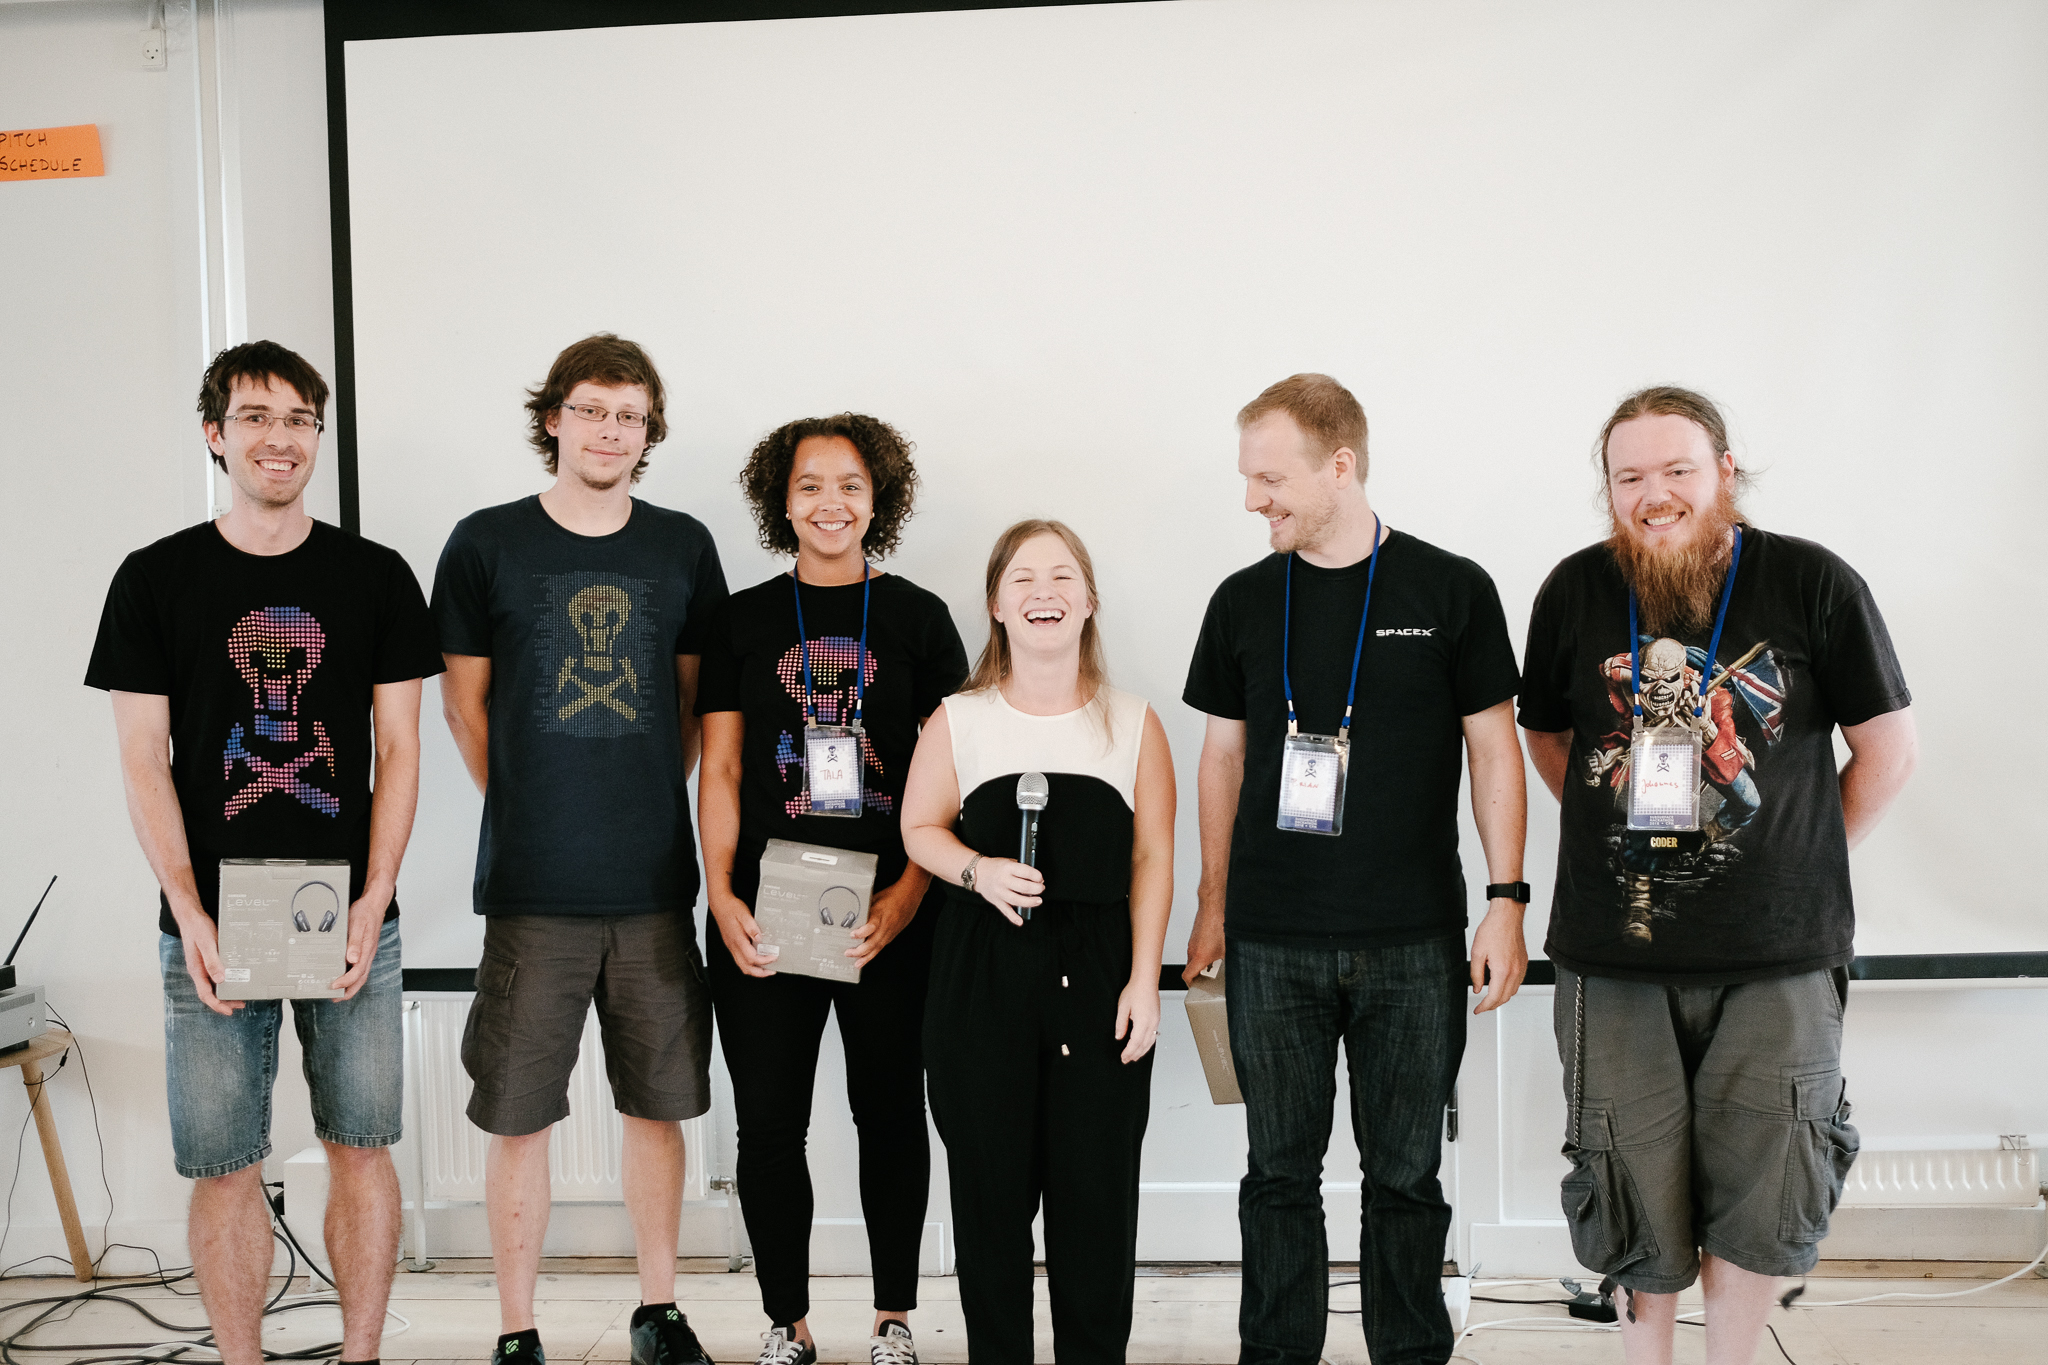
During th event, twelve teams dug into the theme of visualization and interaction. As in Houston last September, we started the event on Friday evening, after the Bootcamp (a full day of informal training). We have a bit of process to form the teams, and it usually takes a couple of hours. But with plenty of pizza and beer for fuel, the evening flew by. After that, it was two whole days of coding, followed by demos from all of the teams and a few prizes. Check out some of the pictures:

Thank you very much to everyone that helped make this event happen! Truly a cast of thousands:

  • David Holmes of Dell EMC for unparallelled awesomeness.
  • The whole Total team, but especially Frederic Broust, Sophie Segura, Yannick Pion, and Laurent Baduel...
  • ...and also Arnaud Rodde for helping with the judging.
  • The Wintershall team, especially Andreas Beha, who also acted as a judge.
  • Brendon Hall of Enthought for sponsoring the event.
  • Carlos Castro and Kim Saabye Pedersen of Amazon AWS.
  • Mathias Hummel and Mahendra Roopa of NVIDIA.
  • Eirik Larsen of Earth Science Analytics for sponsoring the event and helping with the judging.
  • Duncan Irving of Teradata for sponsoring, and sorting out the T-shirts.
  • Monica Beech of Ikon Science for participating in the judging.
  • Matthias Hartung of Target for acting as a judge again.
  • Oliver Ranneries, plus Nina and Eva of Rainmaking Loft.
  • Christopher Backholm for taking such great photographs.

Finally, some statistics from the event:

  • 63 participants, including 8 women (still way too few, but 100% better than 4 out of 63 in Paris)
  • 15 students plus a handful of post-docs.
  • 19 people from petroleum companies.
  • 20 people from service and technology companies, including 7 from GiGa-infosystems!
  • 1 no-show, which I think is a new record.

I will write a summary of all the projects in a couple of weeks when I've caught my breath. In the meantime, you can read a bit about them on our new events portal. We'll be steadily improving this new tool over the coming weeks and months.

That's it for another year... except we'll be back in Europe before the end of the year. There's the FORCE Hackathon in Stavanger in September, then in November we'll be in Aberdeen and London running some events with the Oil and Gas Authority. If you want some machine learning fun, or are looking for a new challenge, please come along!

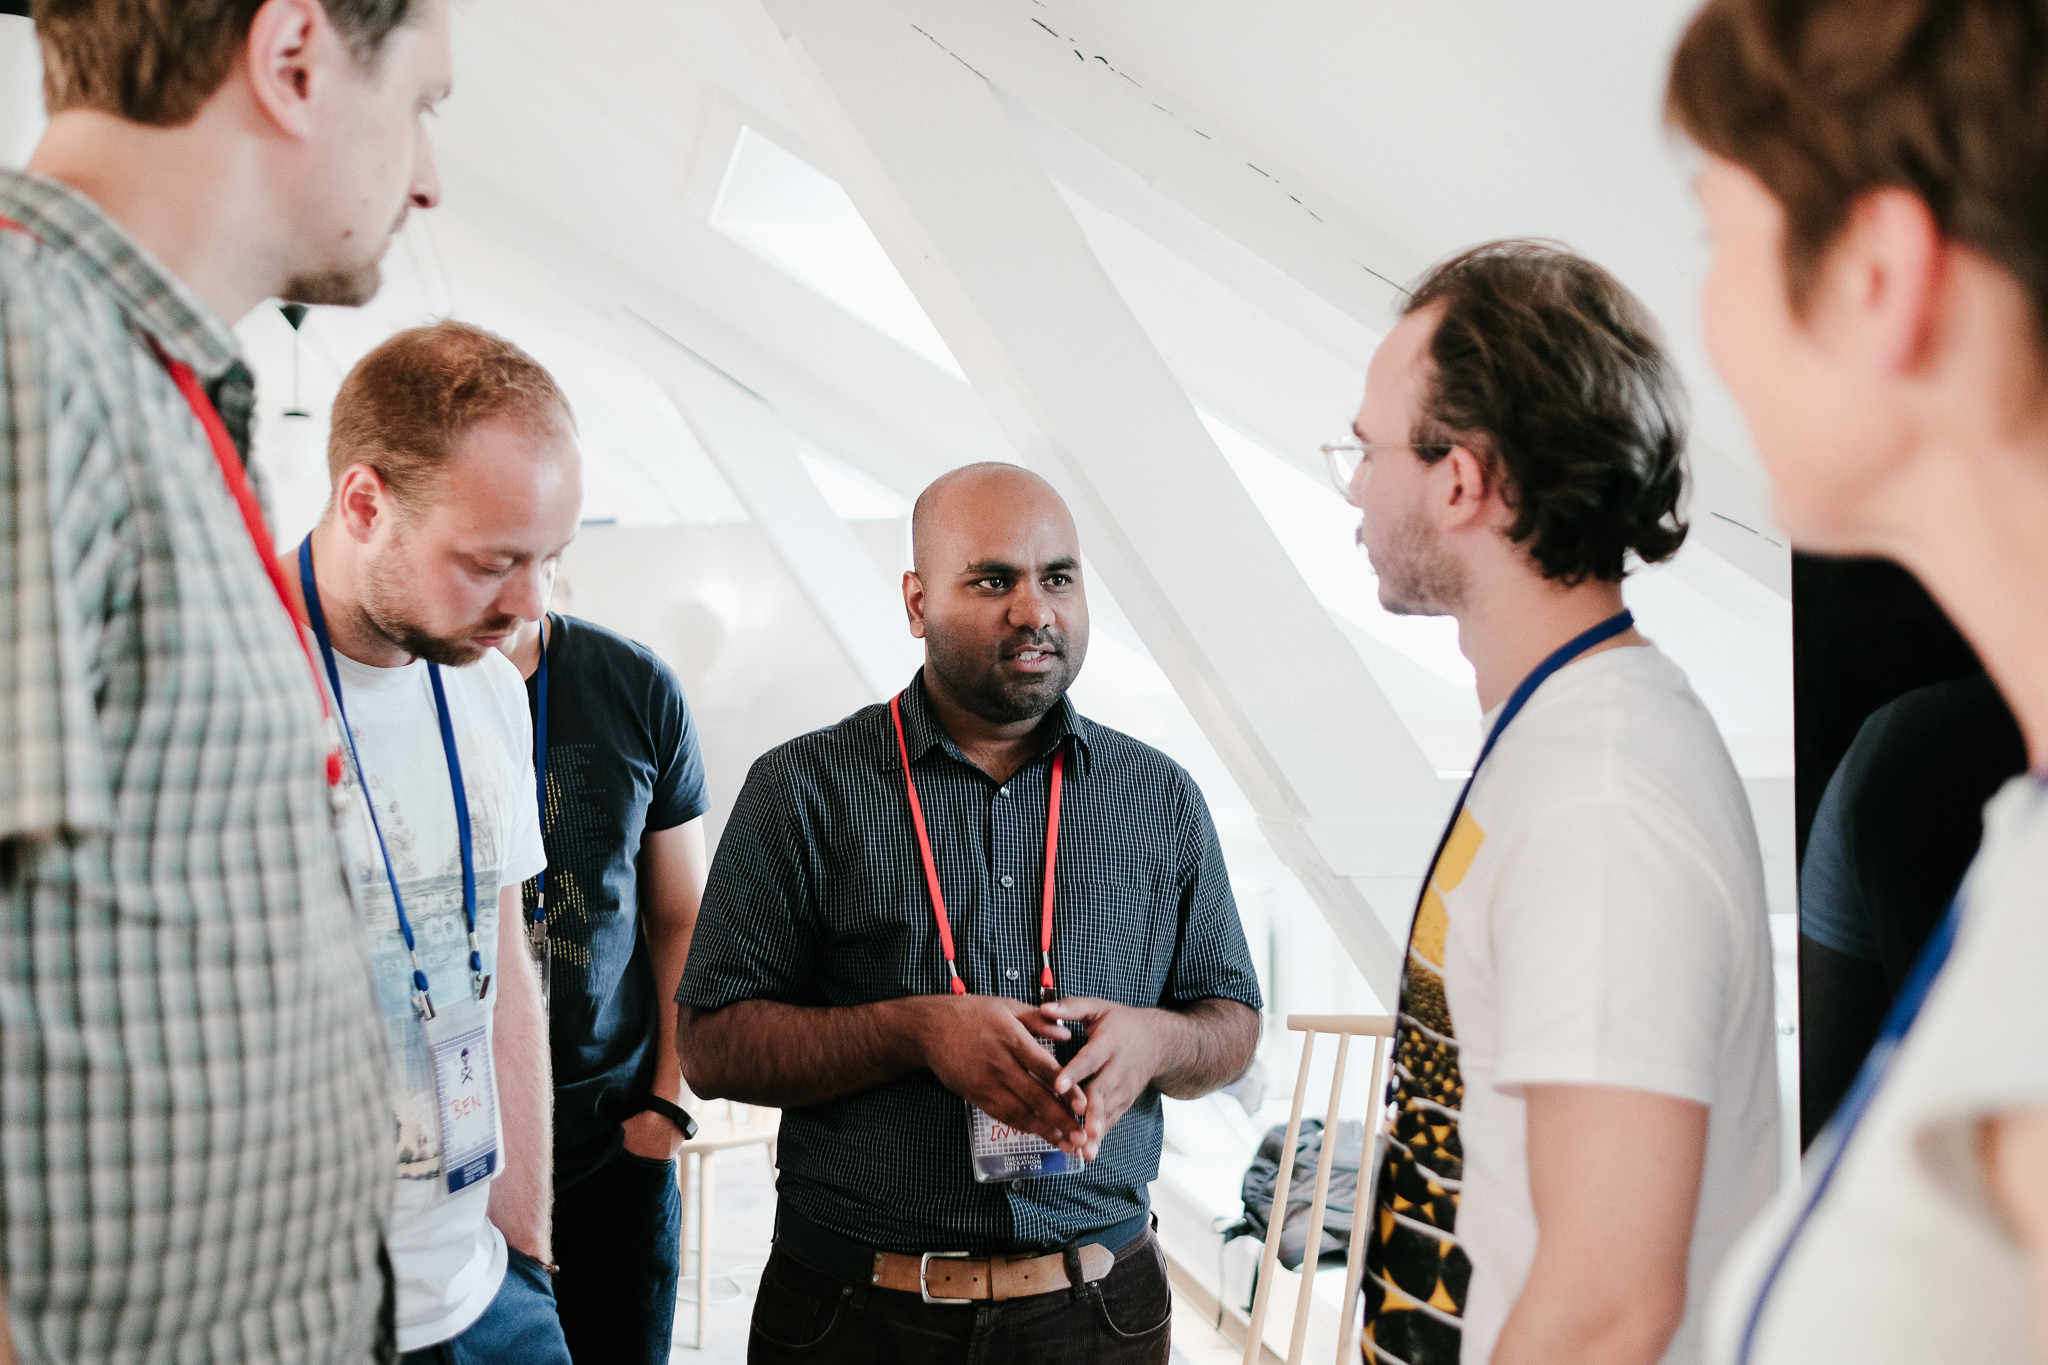
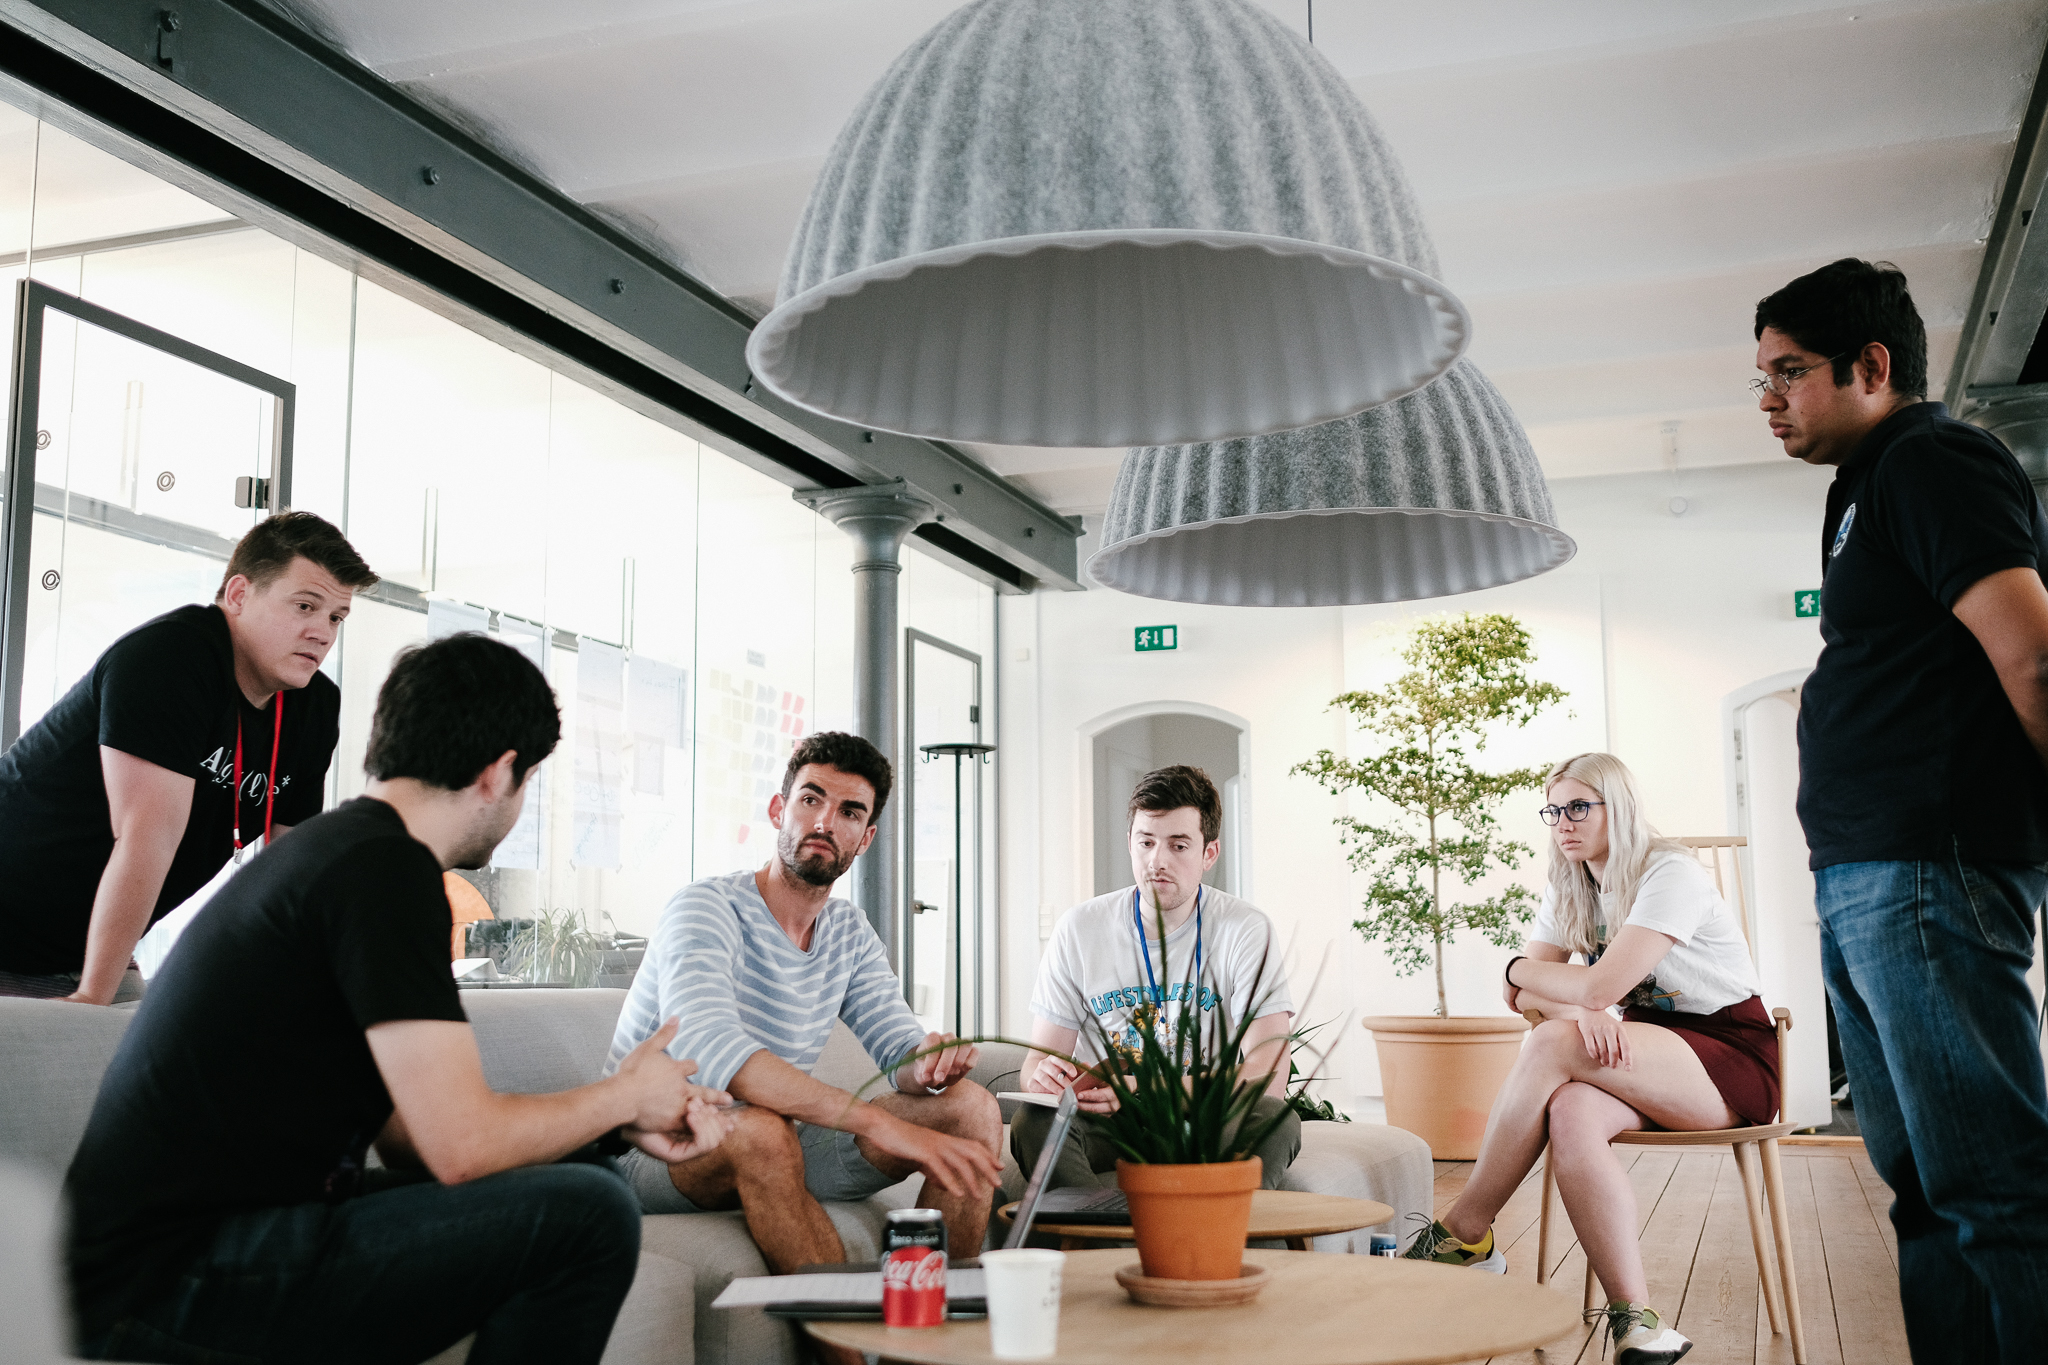
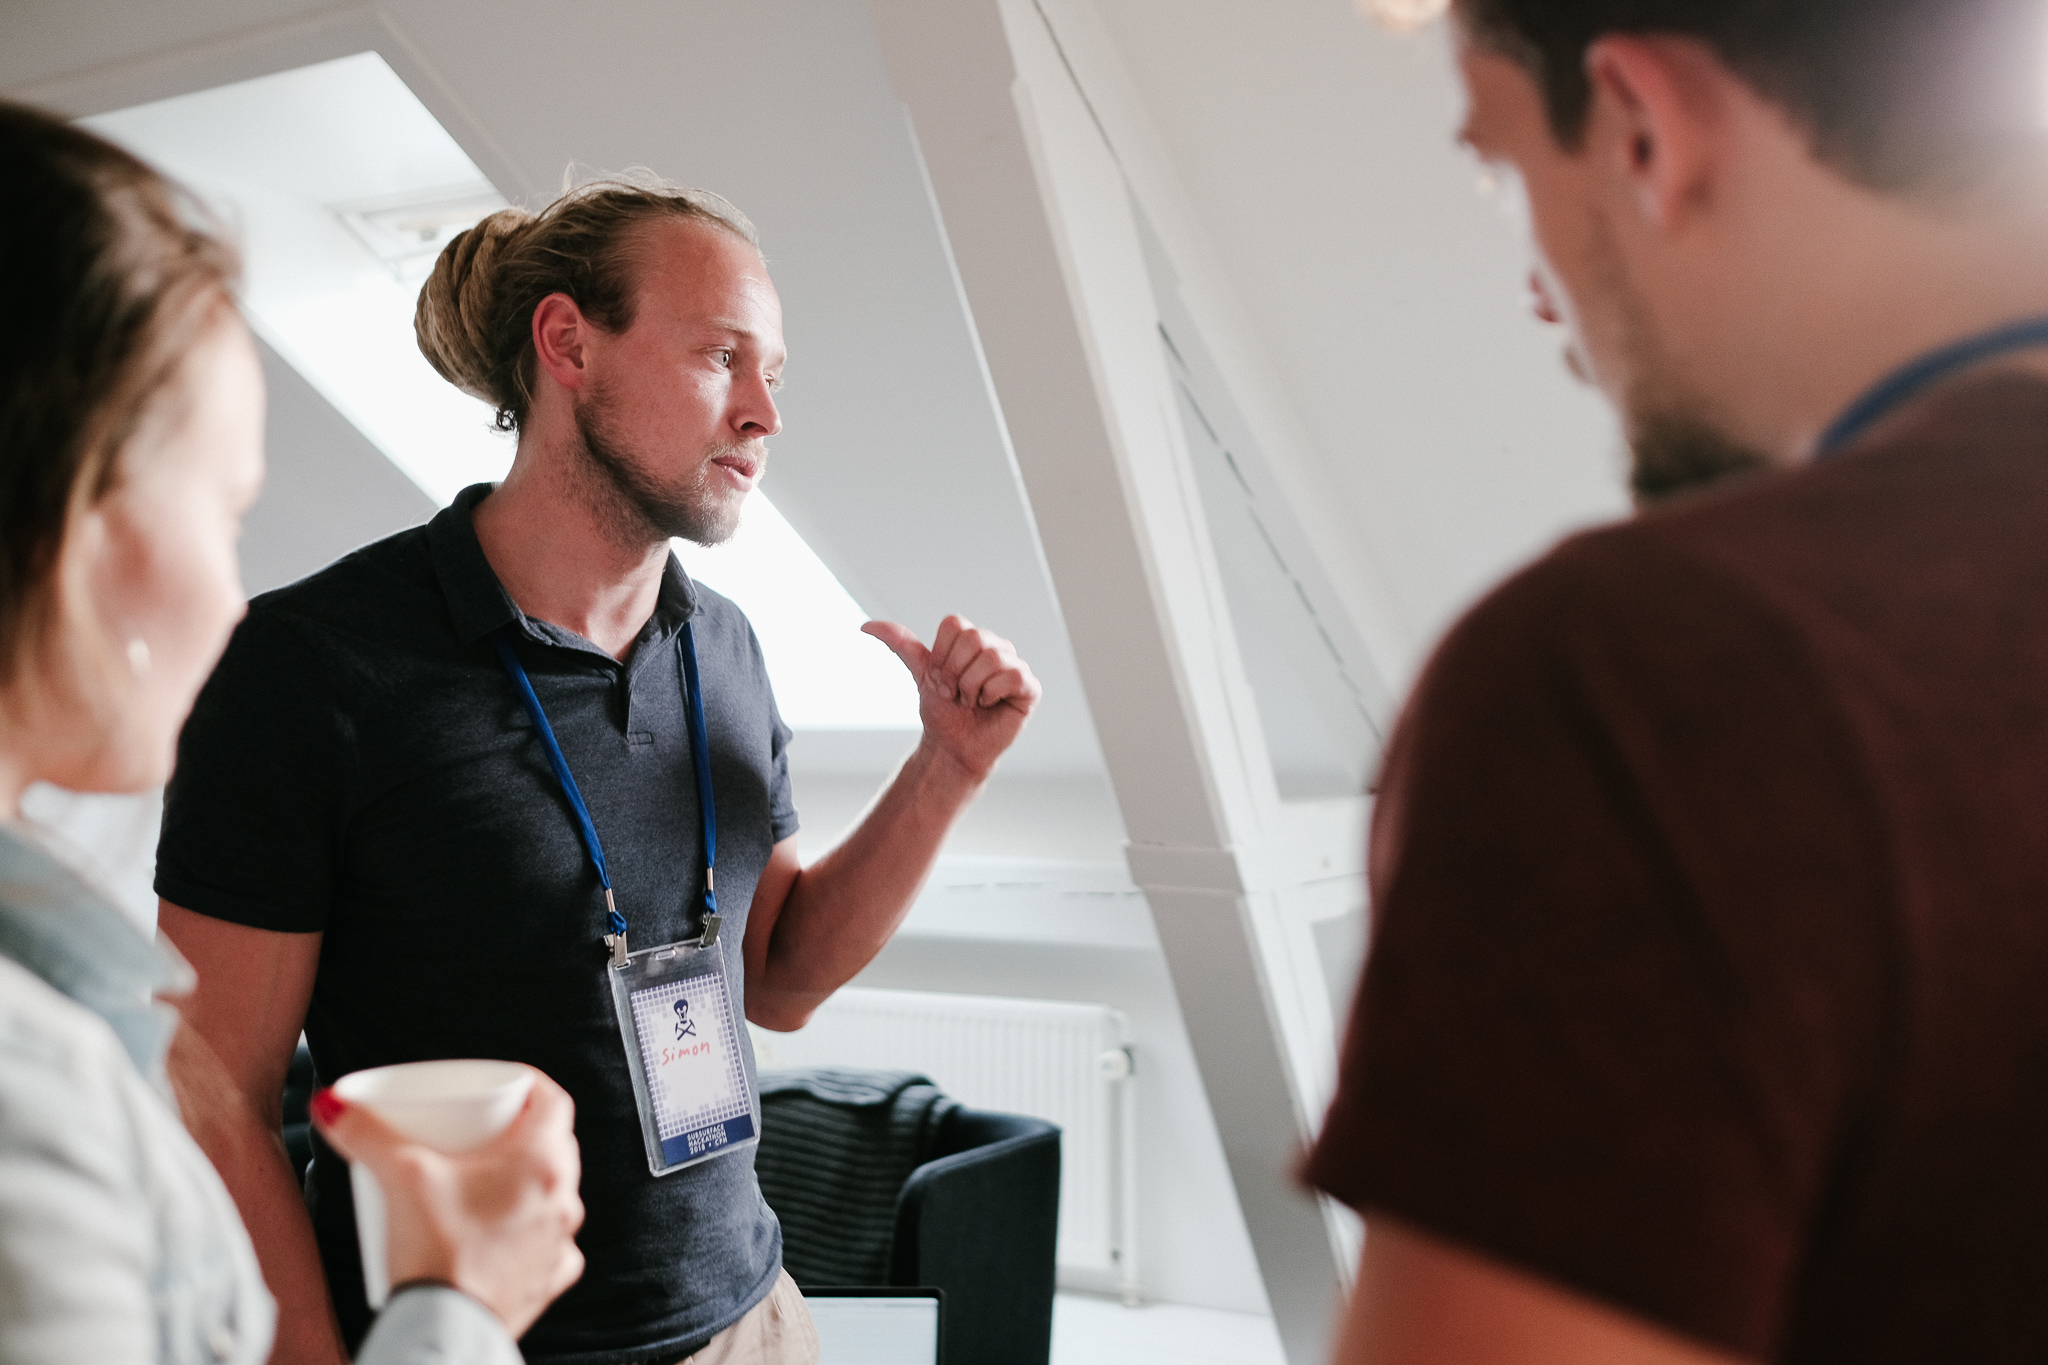
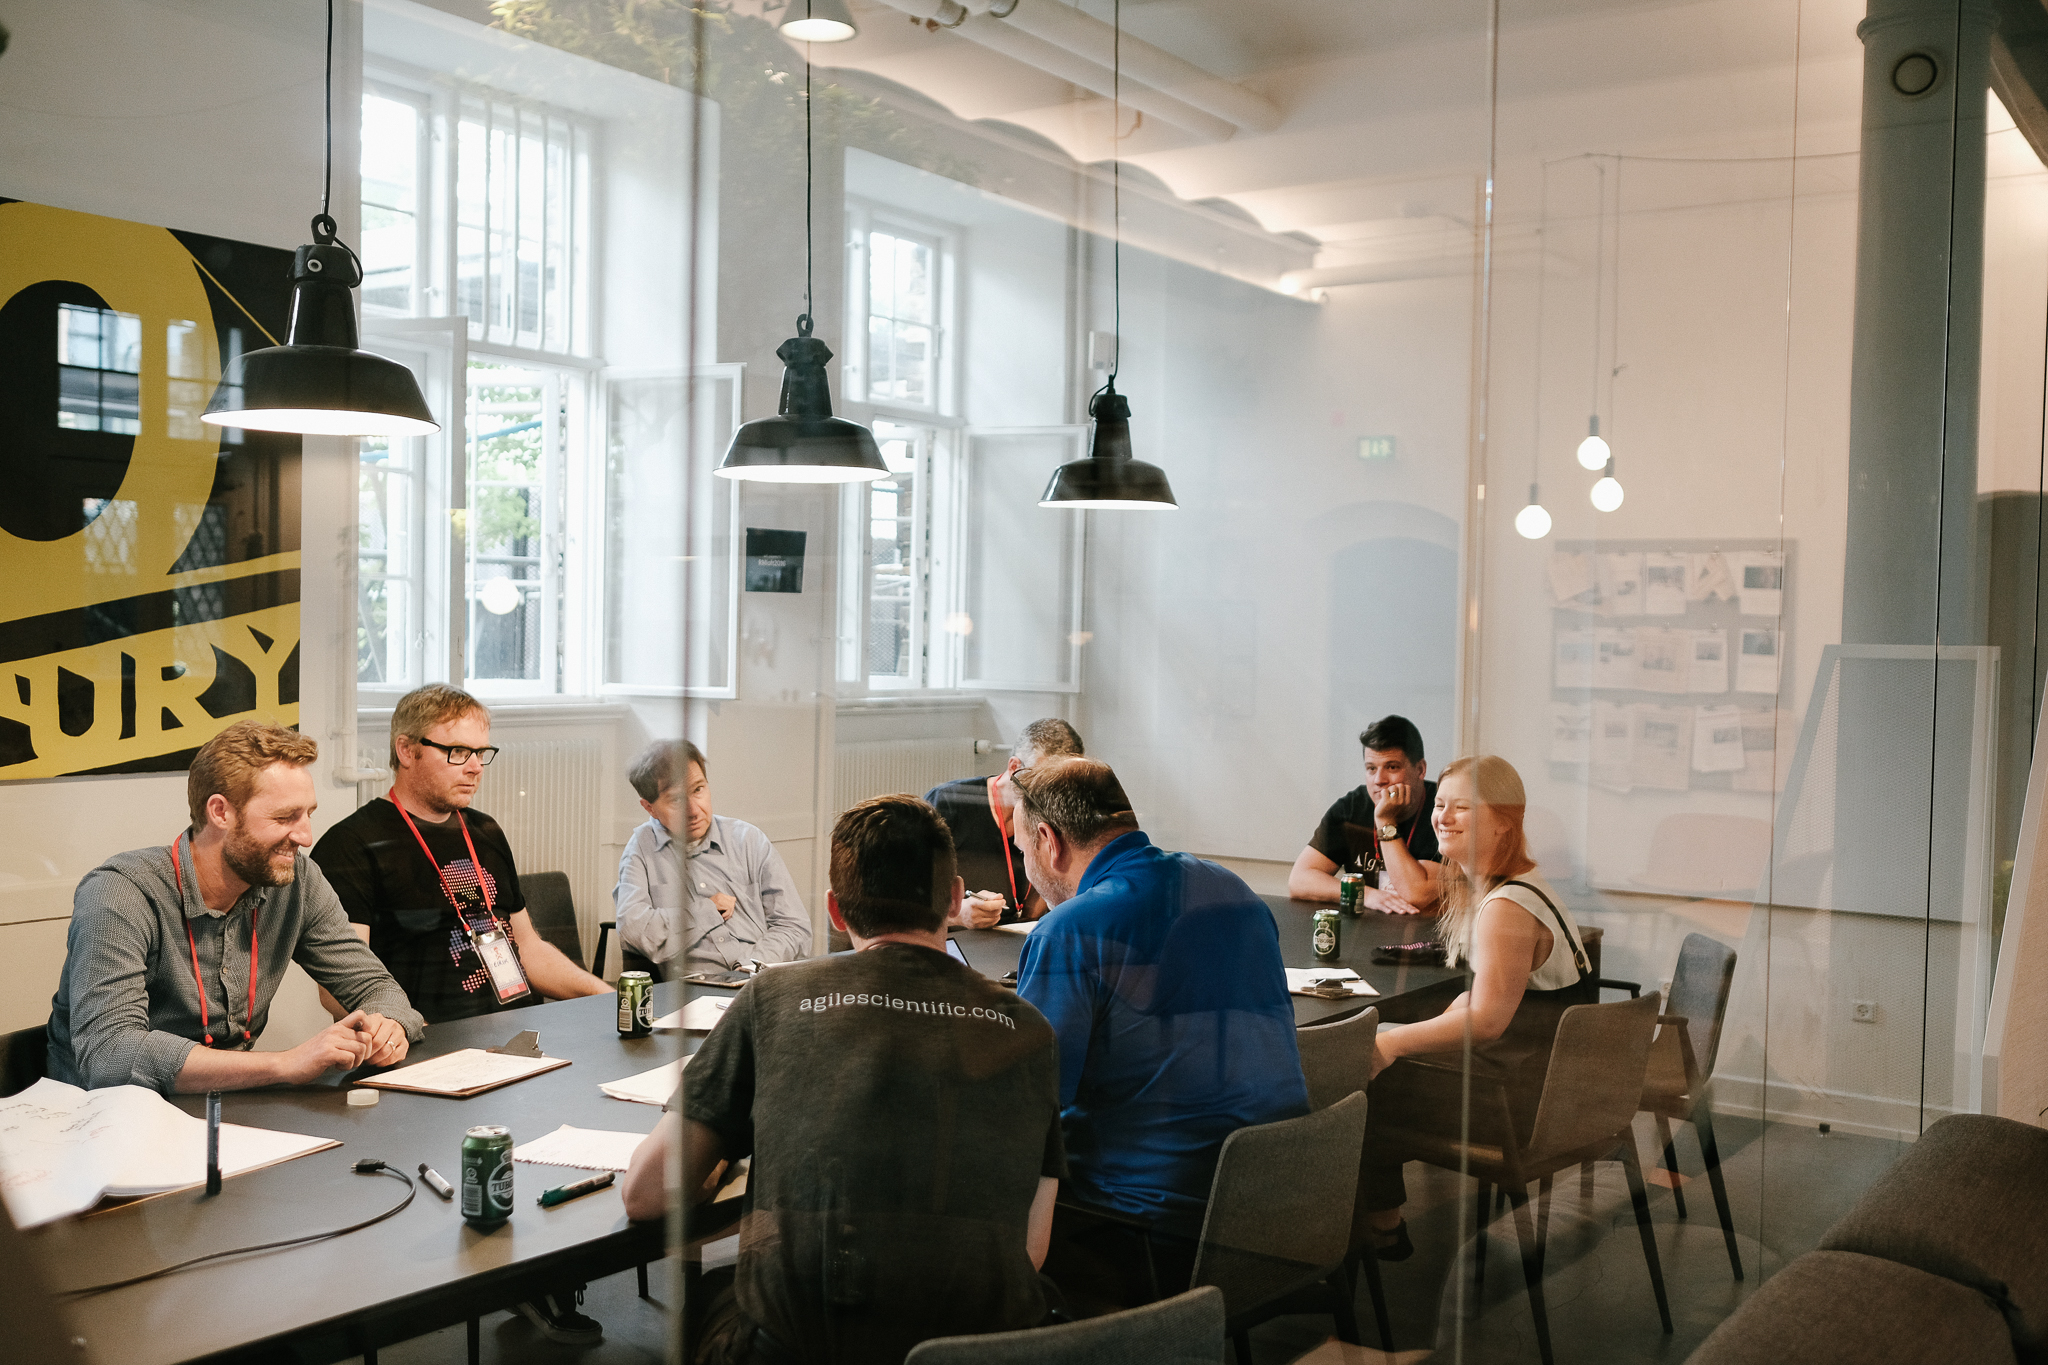
Simon Virgo (centre) and his colleagues in Aachen built an augmented reality sandbox, powered by their research group's software, Gempy. He brought it along and three teams attempted projects based on the technology. Above, some of the participants …

Simon Virgo (centre) and his colleagues in Aachen built an augmented reality sandbox, powered by their research group's software, Gempy. He brought it along and three teams attempted projects based on the technology. Above, some of the participants are having a scrum meeting to keep their project on track.


Looking forward to Copenhagen

We're in Copenhagen for the Subsurface Bootcamp and Hackathon, which start today, and the EAGE Annual Conference and Exhibition, which starts next week. Walking around the city yesterday, basking in warm sunshine and surrounded by sun-giddy Scandinavians, it became clear that Copenhagen is a pretty special place, where northern Europe and southern Europe seem to have equal influence.

The event this weekend promises to be the biggest hackathon yet. It's our 10th, so I think we have the format figured out. But it's only the third in Europe, the theme — Visualization and interaction — is new for us, and most of the participants are new to hackathons so there's still the thrill of the unknown! 

Many thanks to our sponsors for helping to make this latest event happen! Support these organizations: they know how to accelerate innovation in our industry.

sponsors.png

New events for UK

By the way, we just announced two new hackathons, one in London and one in Aberdeen, for the autumn. They are happening just before PETEX, the PESGB petroleum conference; find out more here. You can skill up for these events at some new courses, also just announced. The UK Oil and Gas Authority is offering our Intro to Geocomputing and Machine Learning class for free — apply here for a place. The courses are oversubscribed, so be sure to tell the OGA why you should get a place!

Code Show

There is a lot of other stuff happening at the EAGE exhibition this year — the HPC area, a new start-up area, and a digital transformation area which I hope is as bold as it sounds. Here's the complete schedule and some highlights:

There's lots of other stuff of course — EAGE has the most varied programme of any subsurface conference — but these are the sessions I'd be at if I had time to go to any sessions this year. But I won't because The hackathon is not all that's happening! Next week, starting on Tuesday, we're conducting a new experiment with the Code Show. In partnership with EAGE and Total, this is our attempt to bring some of the hackathon experience to everyone at EAGE. We'll be showing people the projects from the hackathon, talking to them about programming, and helping them get started on their own coding adventure. So if you're at EAGE, swing by Booth #1830 and say Hi.