Not picking parameters
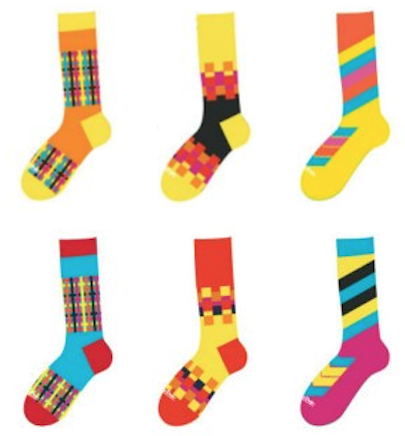
I like socks. Bright ones. I've liked bright socks since Grade 6. They were the only visible garment not governed by school uniform, or at least not enforced, and I think that was probably the start of it. The tough boys wore white socks, and I wore odd red and green socks. These days, my favourites are Cole & Parker, and the only problem is: how to choose?

Last Tuesday I wrote about choosing parameters for geophysical algorithms — window lengths, velocities, noise levels, and so on. Like choosing socks, it's subjective, and it's hard to find a pair for every occasion. The comments from Matteo, Toastar, and GuyM raised an interesting question: maybe the best way to pick parameters is to not pick them? I'm not talking about automatically optimizing parameters, because that's still choosing. I'm talking about not choosing at all.

How many ways can we think of to implement this non-choice? I can think of four approaches, but I'm not 100% sure they're all different, or if I can even describe them...

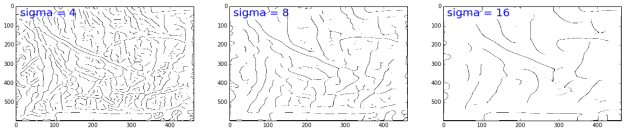
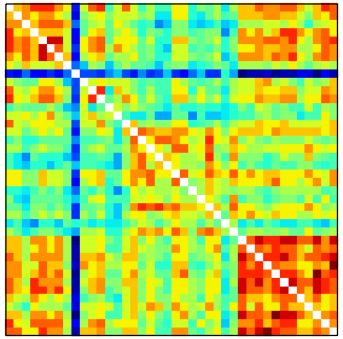
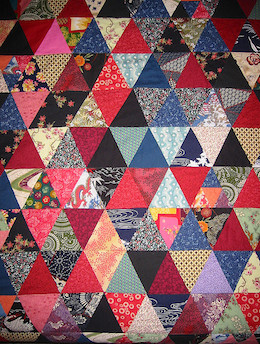
Is the result really optimal, or just a hard-to-interpret patchwork?

Adaptivity

Well, okay, we still choose, but we choose a different value everywhere depending on local conditions. A black pair for a formal function, white for tennis, green for work, and polka dots for special occasions. We can adapt to any property (rather like automatic optimization), along any dimension of our data: spatially, azimuthally,  temporally, or frequentially (there's a word you don't see every day).

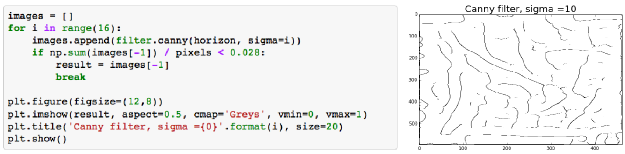
Imagine computing seismic continuity. At each sample, we might evaluate some local function — such as contrast — for a range of window sizes. Or, when smoothing, we might specifiy some minimum signal loss compared to the original. We end up using a different value everywhere, and expect an optimal result.

One problem is that we still have to choose a cost function. And to be at all useful, we would need to produce two new data products, besides the actual result: a map of the parameter's value, and a map of the residual cost, so to speak. In other words, we need a way to know what was chosen, and how satisfactory the choice was.

Stochastic shotgun

We could fall back on that geostatistical favourite and pick the parameter values stochastically, grabbing socks at random out of the drawer. This works, but I need a lot of socks to have a chance of getting even a local maximum. And we run into the old problem of really not knowing what to do with all the realizations. Common approaches are to take the P50, P10, and P90, or to average them. Both of these approaches make me want to ask: Why did I generate all those realizations?

Experimental design methods

The design of experiments is a big deal in the life sciences,  but for some reason rarely (never?) talked about in geoscience. Applying a cost function, or even just visual judgment, to a single parameter is perhaps trivial, but what if you have two variables? Three? What if they are non-linear and covariant? Then the optimization process amounts to a sticky inverse problem.

Fortunately, lots of clever people have thought about these problems. I've even seen them implemented in subsurface software. Cool-sounding combinatorial reduction techniques like Greco-Latin squares, or Latin hypercubes offer ways to intelligently sample the parameter space and organize the results. We could do the same with socks, evaluating pattern and toe colour separately...

The mixing board

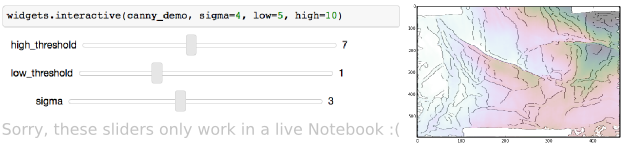
There is another option: the mixing board. Like a music producer, a film editor, or the Lytro camera, I can leave the raw data in place, and always work from the masters. Given the right tools, I can make myself just the right pair of socks whenever I like.

This way we can navigate the parameter space, applying views, processes, or other tools on the fly. Clearly this would mean changing everything about the way we work. We'd need a totally different approach not just to interpretation, but to the entire subsurface characterization workflow.

Are there other ways to avoid choosing? What are people using in other industries, or other sciences? I think we need to invite some experimental design and machine learning people to SEG...

Cole & Parker socks are awesomeThe quilt image is by missvancamp on Flickr and licensed CC-BY. The spools are by surfzone on Flickr, licensed CC-BY. Many thanks to Cole & Parker for permission to use the sock images, despite not knowing what on earth I was going to do with them. Buy their socks! They're Canadian and everything.

The hackathon is coming

The Geophysics Hackathon is one month away! Signing up is not mandatory — you can show up on the day if you like — but it does help with the planning. It's 100% free, and I guarantee you'll enjoy yourself. You'll also learn tons about geophysics and about building software. Deets: Thrive, Denver, 8 am, 25–26 October. Bring a laptop.

Need more? Here's all the info you could ask for. Even more? Ask by email or in the comments

Send your project ideas

The theme this year is RESOLUTION. Participants are encouraged to post projects to hackathon.io ahead of time — especially if you want to recruit others to help. And even if you're not coming to the event, we'd love to hear your project ideas. Here are some of the proto-ideas we have so far: 

  • Compute likely spatial and temporal resolution from some basic acquisition info: source, design, etc.
  • Do the same but from information from the stack: trace spacing, apparent bandwidth, etc.
  • Find and connect literature about seismic and log resolution using online bibliographic data.
  • What does the seismic spectrum look like, given STFT limitations, or Gabor uncertainty?

If you have a bright idea, get in touch by email or in the comments. We'd love to hear from you.

Thank you to our sponsors

Three forward-thinking companies have joined us in making the hackathon as much a geophysics party as well as a scientific workshop (a real workshop). I think this industry may have trained us to take event sponsorship for granted, but it's easy to throw $5000 at the Marriott for Yet Another Coffee Break. Handing over money to a random little company in Nova Scotia to buy coffee, tacos, and cool swag for hungry geophysicists and programmers takes real guts! 

Please take a minute to check out our sponsors and reward them for supporting innovation in our community. 

dGB GeoTeric OGS

Students: we are offering $250 bursaries to anyone looking for help with travel or accommodation. Just drop me a line with a project idea. If you know a student that might enjoy the event, please forwadrd this to them.

Picking parameters

One of the reasons I got interested in programming was to get smarter about broken workflows like this one from a generic seismic interpretation tool (I'm thinking of Poststack-PAL, but does that even exist any more?)...

  1. I want to make a coherence volume, which requires me to choose a window length.
  2. I use the default on a single line and see how it looks, then try some other values at random.
  3. I can't remember what I did so I get systematic: I try 8 ms, 16 ms, 32 ms, and 64 ms, saving each one as a result with _XXms appended so I can remember what I did
  4. I display them side by side but the windows are annoying to line up and resize, so instead I do it once, display them one at a time, grab screenshots, and import the images into PowerPoint because let's face it I'll need that slide eventually anyway
  5. I can't decide between 16 ms and 32 ms so I try 20 ms, 24 ms, and 28 ms as well, and do it all again, and gaaah I HATE THIS STUPID SOFTWARE

There has to be a better way.

Stumbling towards optimization

Regular readers will know that this is the time to break out the IPython Notebook. Fear not: I will focus on the outcomes here — for the real meat, go to the Notebook. Or click on these images to see larger versions, and code.

Let's run through using the Canny edge detector in scikit-image, a brilliant image processing Python library. The algo uses the derivative of a Gaussian to compute gradient, and I have to choose 3 parameters. First, we'll try to optimize 'sigma', the width of the Gaussian. Let's try the default value of 1:

Clearly, there is too much noise in the result. Let's try the interval method that drove me crazy in desktop software:

Well, I think something between 8 and 16 might work. I could compute the average intensity of each image, choose a value in between them, and then use the sigma that gives that result. OK, it's a horrible hack, but turns out to be 10:

But the whole point of scientific computing is the efficient application of informed human judgment. So let's try adding some interactivity — then we can explore the 3D parameter space in a near-parallel instead of purely serial way:

I finally feel like we're getting somewhere... But it still feels a bit arbitrary. I still don't know I'm getting the optimal result.

What can I try next? I could try to extend the 'goal seek' option, and come up with a more sophisticated cost function. If I could define something well enough — for edge detection, like coherence, I might be interested in contrast — then I could potentially just find the best answers, in much the same way that a digital camera autofocuses (indeed, many of them look for the highest contrast image). But goal seeking, if the cost function is too literal, in a way begs the question. I mean, you sort of have to know the answer — or something about the answer — before you find it.

Social machines

Social machines are the hot new thing in computing (Big Data is so 2013). Perhaps instead I can turn to other humans, in my social and professional networks. I could...

  • Ask my colleagues — perhaps my company has a knowledge sharing network I can go to.
  • Ask t'Internet — I could ask Twitter, or my friends on Facebook, or a seismic interpretation group in LinkedIn. Better yet, Earth Science Stack Exchange!
  • What if the software I was using just told me what other people had used for these parameters? Maybe this is only one step up from the programmer's default... especially if most people just use the programmer's default.
  • But what if people could rate the outcome of the algorithm? What if their colleagues or managers could rate the outcome? Then I could weight the results with these ratings.
  • What if there was a game that involved optimizing images (OK, maybe a bit of a stretch... maybe more like a Mechanical Turk). Then we might have a vast crowd of people all interested in really pushing the edge of what is intuitively reasonable, and maybe exploring the part of the parameter space I'm most interested in.

What if I could combine the best of all these approaches? Interactive exploration, with guided optimization, constrained by some cost function or other expectation. That could be interesting, but unfortunately I have absolutely no idea how that would work. I do think the optimization workflow of the future will contain all of these elements.

What do you think? Do you have an awesome way to optimize the parameters of seismic attributes? Do you have a vision for how it could be better? It occurs to me this could be a great topic for a future hackathon...

ipynb_icon.png
Click here for an IPython Notebook version of this blog post. If you don't have it, IPython is easy to install. The easiest way is to install all of scientific Python, or use Canopy or Anaconda.

The road to Modelr: my EuroSciPy poster

At EuroSciPy recently, I gave a poster-ized version of the talk I did at SciPy. Unlike most of the other presentations at EuroSciPy, my poster didn't cover a lot of the science (which is well understood), or the code (which is esoteric).

Instead it focused on the advantages of spreading software via web applications, rather than only via source code, and on the challenges that we overcame — well, that we're still overcoming — to get our Modelr tool out there. I wanted other programmer-scientists to think about running some of their code as a web app for others to enjoy, but to be aware of the effort involved in doing this.

I've written before about my dislike of posters, though I'm told they are an important component at, say, the AGU Fall Meeting. I admit I do quite like the process of making them, and — on advice from Colin Purrington's useful page — I left a space on the poster for people to write comments or leave sticky notes. As a result, I heard about Docker, a lead I'll certainly follow up,

What's new in modelr

This wasn't part of the poster, but I might as well take the chance to let you know what we've updated recently:

  • You can now add noise to models by specifying the signal:noise.
  • Instead of automatic scaling, you can choose your own gain.
  • The app now returns the elastic moduli of the rocks in the model.
  • You can choose a spatial cross-section view or a space–offset–frequency view.

All of these features are now available to subscribers for only $9/month. Amazing value :)

Figshare

I've stored my poster on Figshare, a data storage site and part of Macmillan's Digital Science effort. What I love about Figshare, apart from the convenience of cloud-based storage and easy access for others, is that every item gets a digital object identifier or DOI. You've probably seen these on journal articles. They're a bit like other persistent and unique IDs for publications, such as ISBNs for books, but the idea is to provide more interactivity by making it easily linkable: you can get to any object with a DOI by prepending it with "http://dx.doi.org/".

Reference

Hall, M (2014). The road to modelr: building a commercial web app on an open source foundation. EuroSciPy, Cambridge, UK, August 29–30, 2014. Poster presentation. DOI:10.6084/m9.figshare.1151653

Julia in a nutshell

Julia is the most talked-about language in the scientific Python community. Well, OK, maybe second to Python... but only just. I noticed this at SciPy in July, and again at EuroSciPy last weekend.

As promised, here's my attempt to explain why scientists are so excited about it.

Why is everyone so interested in Julia?

At some high level, Julia seems to solve what Steven Johnson (MIT) described at EuroSciPy on Friday as 'the two-language problem'. It's also known as Outerhout's dichotomy. Basically, there are system languages (hard to use, fast), and scripting languages (easy to use, slow). Attempts to get the best of boths worlds have tended to result in a bit of a mess. Until Julia.

Really though, why?

Cheap speed. Computer scientists adore C because it's rigorous and fast. Scientists and web developers worship Python because it's forgiving and usually fast enough. But the trade-off has led to various cunning ploys to get the best of both worlds, e.g. PyPy and Cython. Julia is perhaps the cunningest ploy of all, achieving speeds that compare with C, but with readable code, dynamic typing, garbage collection, multiple dispatch, and some really cool tricks like Unicode variable names that you enter in pure LaTeX. And check out this function definition shorthand:

Why is Julia so fast?

Machines don't understand programming languages — the code written by humans has to be translated into machine language in a process called 'compiling'. There are three approaches:

Compiling makes languages fast, because the executed code is tuned to the task (e.g. in terms of the types of variables it handles), and to the hardware it's running on. Indeed, it's only by building special code for, say, integers, that compiled languages achieve the speeds they do.

Julia is compiled, like C or Fortran, so it's fast. However, unlike C and Fortran, which are compiled before execution, Julia is compiled at runtime ('just in time' for execution). So it looks a little like an interpreted language: you can write a script, hit 'run' and it just works, just like you can with Python.

You can even see what the generated machine code looks like:

Don't worry, I can't read it either.

But how is it still dynamically typed?

Because the compiler can only build machine code for specific types — integers, floats, and so on — most compiled languages have static typing. The upshot of this is that the programmer has to declare the type of each variable, making the code rather brittle. Compared to dynamically typed languages like Python, in which any variable can be any type at any time, this makes coding a bit... tricky. (A computer scientist might say it's supposed to be tricky — you should know the type of everything — but we're just trying to get some science done.)

So how does Julia cope with dynamic typing and still compile everything before execution? This is the clever bit: Julia scans the instructions and compiles for the types it finds — a process called type inference — then makes the bytecode, and caches it. If you then call the same instructions but with a different type, Julia recompiles for that type, and caches the new bytecode in another location. Subsequent runs use the appropriate bytecode, with recompilation.

Metaprogramming

It gets better. By employing metaprogramming — on-the-fly code generation for special tasks — it's possible for Julia to be even faster than highly optimized Fortran code (right), in which metaprogramming is unpleasantly difficult. So, for example, in Fortran one might tolerate a relatively slow loop that can only be avoided with code generation tricks; in Julia the faster route is much easier. Here's Steven's example.

Interoperability and parallelism

It gets even better. Julia has been built with interoperability in mind, so calling C — or Python — from inside Julia is easy. Projects like Jupyter will only push this further, and I expect Julia to soon be the friendiest way to speed up that stubborn inner NumPy loop. And I'm told a lot of thoughtful design has gone into Julia's parallel processing libraries... I have never found an easy way into that world, so I hope it's true.


I'm not even close to being able to describe all the other cool things Julia, which is still a young language, can do. Much of it will only be of interest to 'real' programmers. In many ways, Julia seems to be 'Python for C programmers'.

If you're really interested, read Steven's slides and especially his notebooks. Better yet, just install Julia and IJulia, and play around. Here's another tutorial and a cheatsheet to get you started.

Highlights from EuroSciPy

In July, Agile reported from SciPy in Austin, Texas, one of several annual conferences for people writing scientific software in the Python programming language. I liked it so much I was hungry for more, so at the end of my recent trip to Europe I traveled to the city of Cambridge, UK, to participate in EuroSciPy.

The conference was quite a bit smaller than its US parent, but still offered 2 days of tutorials, 2 days of tech talks, and a day of sprints. It all took place in the impressive William Gates Building, just west of the beautiful late Medieval city centre, and just east of Schlumberger's cool-looking research centre. What follows are my highlights...

Okay you win, Julia

Steven Johnson, an applied mathematician at MIT, gave the keynote on the first morning. His focus was Julia, the current darling of the scientific computing community, and part of a new ecosystem of languages that seek to cooperate, not compete. I'd been sort of ignoring Julia, in the hope that it might go away and let me focus on Python, the world's most useful language, and JavaScript, the world's most useful pidgin... but I don't think scientists can ignore Julia much longer.

I started writing about what makes Julia so interesting, but it turned into another post — up next. Spoiler: it's speed. [Edit: Here is that post! Julia in a nutshell.]

Learning from astrophysics

The Astropy project is a truly inspiring community — in just 2 years it has synthesized a dozen or so disparate astronomy libraries into an increasingly coherent and robust toolbox for astronomers and atrophysicists. What does this mean?

  • The software is well-tested and reliable.
  • Datatypes and coordinate systems are rich and consistent.
  • Documentation is useful and evenly distributed.
  • There is a tangible project to rally developers and coordinate funding.

Geophysicists might even be interested in some of the components of Astropy and the related SunPy project, for example:

  • astropy.units, just part of the ever-growing astropy library, as a unit conversion and quantity handler to compare with pint.
  • sunpy datatypes map and spectra for types of data that need special methods.
  • asv is a code-agnostic benchmarking library, a bit like freebench.

Speed dating for scientists

Much of my work is about connecting geoscientists in meaningful collaboration. There are several ways to achieve this, other than through project work: unsessions, wikis, hackathons, and so on. Now there's another way: speed dating.

Okay, it doesn't quite get to the collaboration stage, but Vaggi and his co-authors shared an ingenious way to connect people and give their professional relationship the best chance of success (an amazing insight, a new algorithm, or some software). They asked everyone at a small 40-person conference to complete a questionnaire that asked, among other things, what they knew about, who they knew, and, crucially, what they wanted to know about. Then they applied graph theory to find the most desired new connections (the matrix shows the degree of similarity of interests, red is high), and gave the scientists five 10-minute 'dates' with scientists whose interests overlapped with theirs, and five more with scientists who knew about fields that were new to them. Brilliant! We have to try this at SEG.

Vaggi, F, T Schiavinotto, A Csikasz-Nagy, and R Carazo-Salas (2014). Mixing scientists at conferences using speed dating. Poster presentation at EuroSciPy, Cambridge, UK, August 2014. Code on GitHub.

Vaggi, F, T Schiavinotto, J Lawson, A Chessel, J Dodgson, M Geymonat, M Sato, R Carazo Salas, A Csikasz Nagy (2014). A network approach to mixing delegates at meetings. eLife, 3. DOI: 10.7554/eLife.02273

Other highlights

  • sumatra to generate and keep track of simulations.
  • vispy, an OpenGL-based visualization library, now has higher-level, more Pythonic components.
  • Ian Osvald's IPython add-on for RAM usage.
  • imageio for lightweight I/O of image files.
  • nbagg backend for matplotlib version 1.4, bringin native (non-JS) interactivity.
  • An on-the-fly kernel chooser in upcoming IPython 3 (currently in dev).

All in all, the technical program was a great couple of days, filled with the usual note-taking and hand-shaking. I had some good conversations around my poster on modelr. I got a quick tour of the University of Cambridge geophysics department (thanks to @lizzieday), which made me a little nostalgic for British academic institutions. A fun week!