x lines of Python: Stereonets

Difficulty rating: Intermediate

A few years back I needed to plot some fracture data without specialist software, so I created an Excel spreadsheet with a polar plot and interactive widgets. But thanks to Joe Kington and his awesome mplstereonet library those days are over. Today I want to share with you how to plot two fracture sets on an equal area Schmidt plot with mplstereonet.

Here's what we're going to do — and in only 10 lines of Python:

  1. Load the data from a CSV file.
  2. Create a stereonet with grid lines.
  3. Loop over fracture sets and plot each in a different colour.
  4. Add some statistics for each set.

For data we'll use Irene Wallis's fantastic open-source project fractoolbox repo, which includes some data — as well as some notebooks that go beyond what we will do here.

This results in the plot shown here, where each fracture is plotted as a point representing the pole of the fracture plane.

We see that not counting the imports, we can make this simple plot with as a few as 10 lines of code while still retaining some flexibility to refactor this code. The accompanying notebook also shows how to use ipywidgets to make the plot interactive.

stereonet_example.jpg

That’s it! There’s more in the Notebook — check out the links below. If you get some beautiful plots out of your data, share them in the Software Underground or on Twitter. Have fun!

GitHub    See the Notebook on GitHub

Binder    Run the Notebook in MyBinder

In search of the Kennetcook Thrust

Behind every geologic map, is a much more complex geologic truth. Most of the time it's hidden under soil and vegetation, forcing geologists into a detective game in order to fill gaps between hopelessly sparse spatterings of evidence.

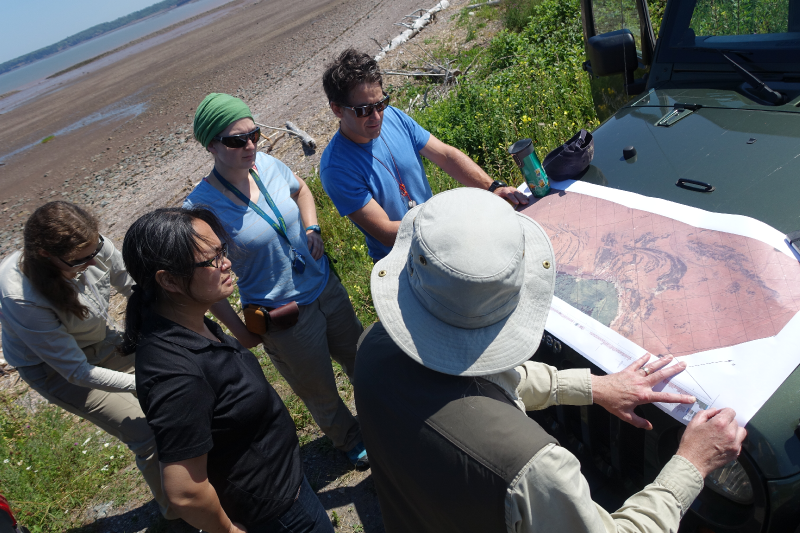
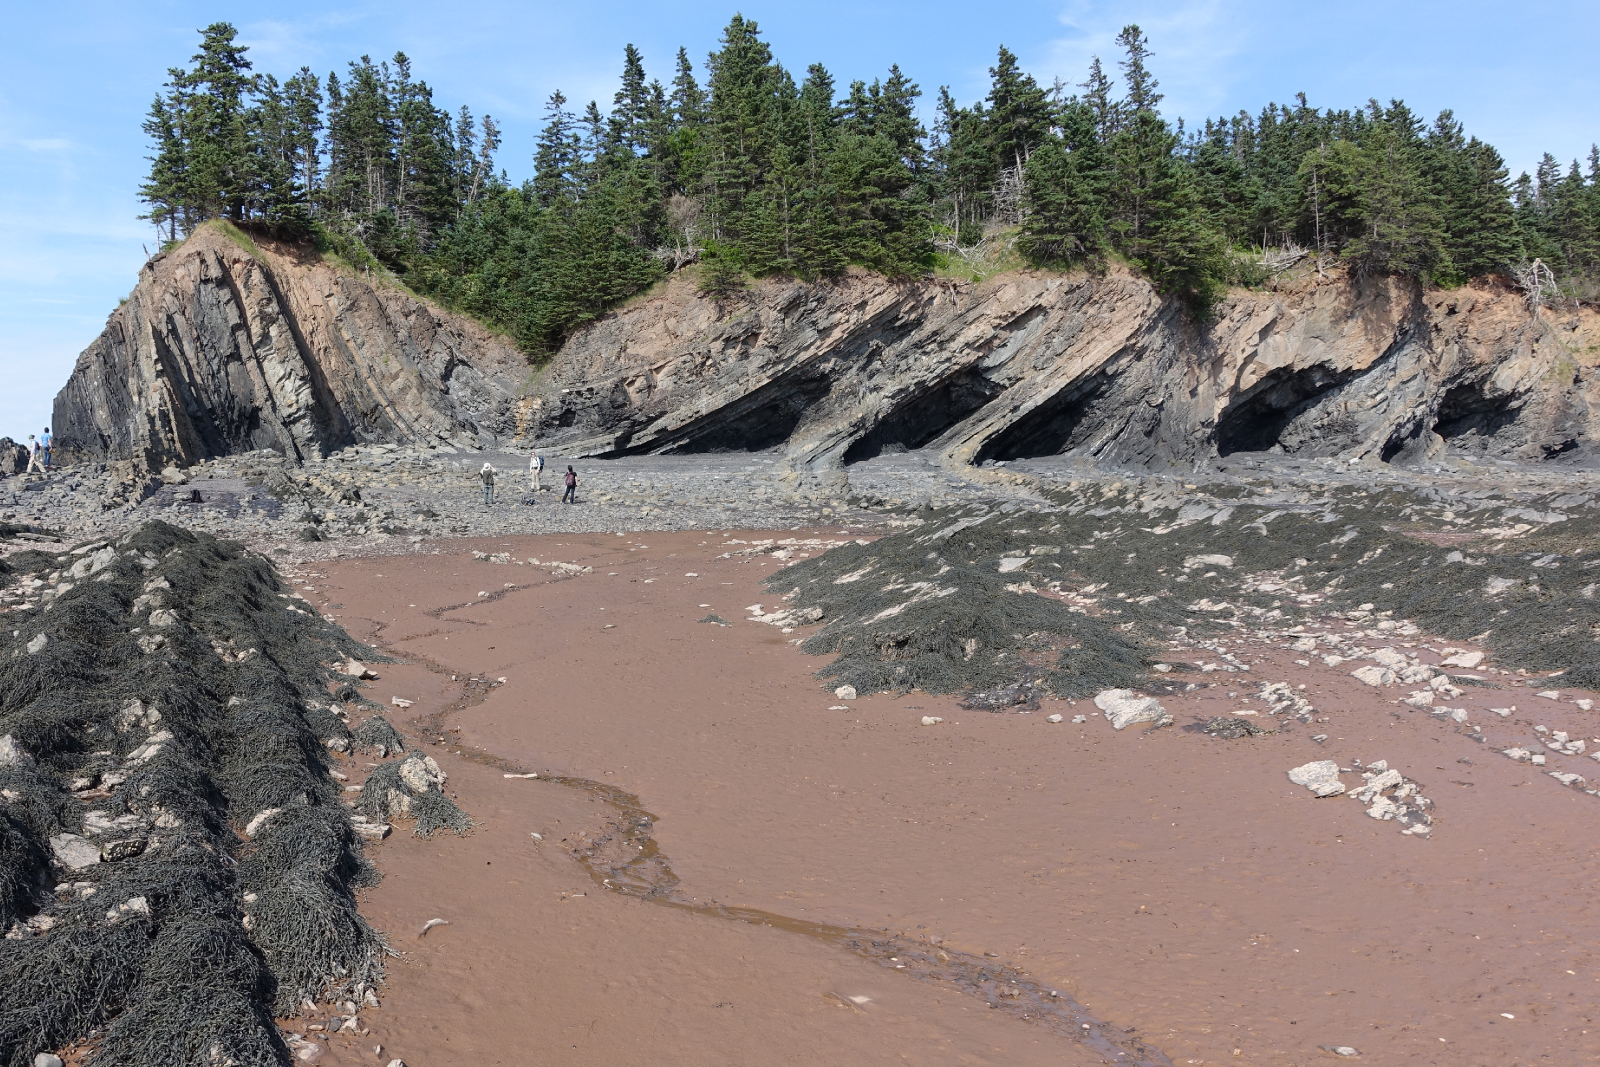
Two weeks ago, I joined up with an assortment of geologists on the side of the highway an hour north of Halifax for John Waldron to guide us along some spectacular stratigraphy exposed in the coastline cliffs on the southern side of the Minas Basin (below). John has visited these sites repeatedly over his career, and he's supervised more than a handful of graduate students probing a variety of geologic processes on display here. He's published numerous papers teasing out the complex evolution of the Windsor-Kennetcook Basin: one of three small basins onshore Nova Scotia with the potential to contain economic quantities of hydrocarbons.

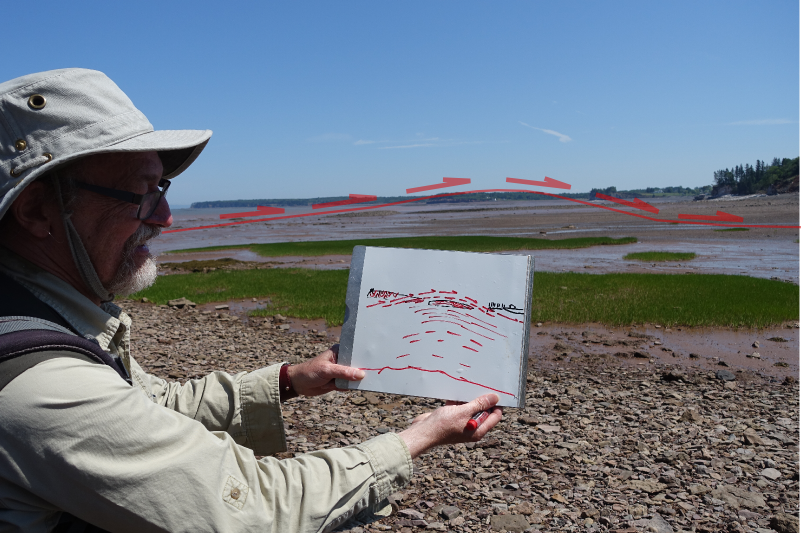
John retold the history of mappers past and present riddled by the massively deformed, often duplicated Carboniferous evaporites in the Windsor Group which are underlain by sub-horizontal seismic reflectors at depth. Local geologists agree that this relationship reflects thrusting of the near-surface package, but there is disagreement on where this thrust is located, and whether and where it intersects the surface. On this field trip, John showed us symptoms of this Kennetcook thrust system, at three sites. We started in the footwall. The second and third sites were long stretches spectacularly deformed exposures in the hangingwall.  

Footwall: Cheverie Point

SEE GALLERY BELOW FOR ENLARGEMENT

SEE GALLERY BELOW FOR ENLARGEMENT

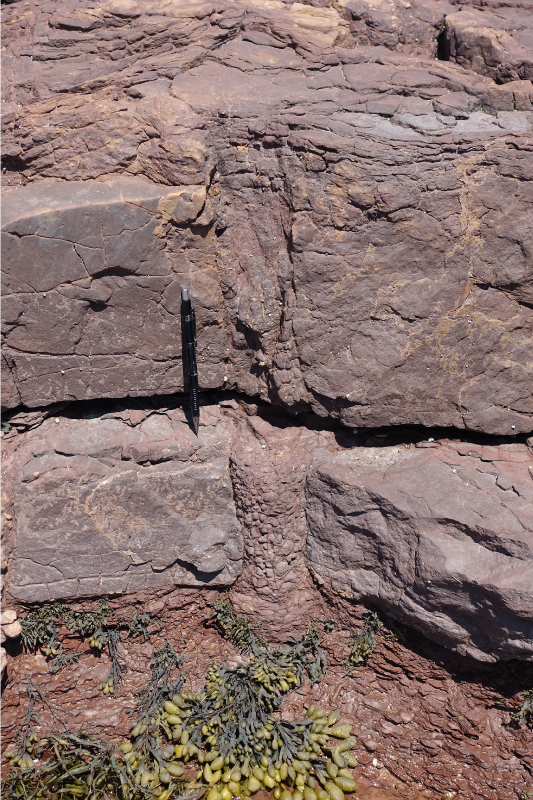
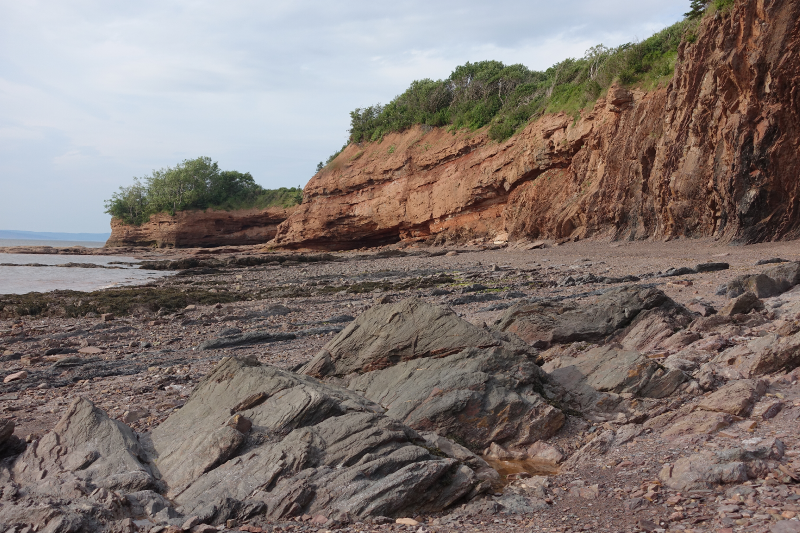
The first stop was Cheverie Point and is interpreted to be well in the footwall of the Kennetcook thrust. Small thrust faults (right) cut through the type section of the Macumber Formation and match the general direction of the main thrust system. The Macumber Formation is a shallow marine microbial limestone that would have fooled anyone as a mudstone, except it fizzed violently under a drop of HCl. Just to the right of this photo, we stood on the unconformity between the petroliferous and prospective Horton Group and the overlying Windsor Group. It's a pick that turns out to be one of the most reliably mappable seismic events on seismic sections so it was neat to stand on that interface.

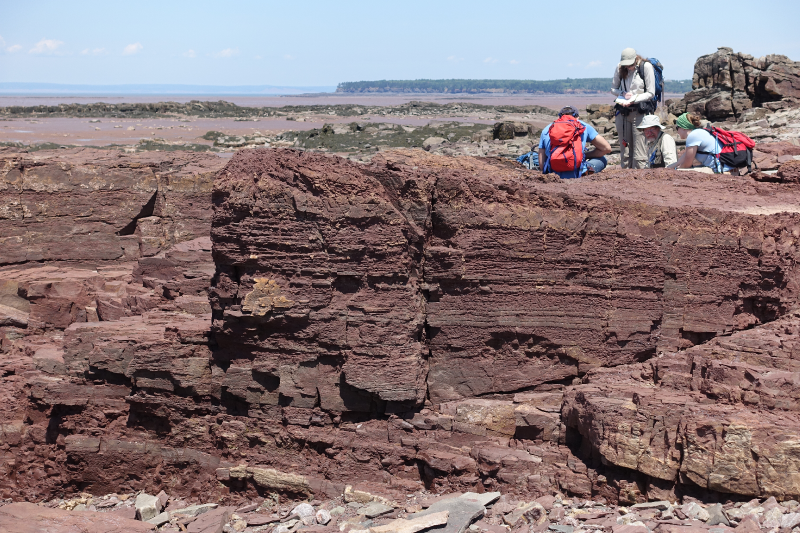
Further down section we studied the Mississippian Cheverie Formation: stacked cycles of point-bar deposits ranging from accretionary lag conglomerates to caliche paleosols with upright tree trunks. Trees more than a metre or more in diameter were around from the mid Devonian, but Cheverie forests are still early and good examples of trees within point-bars and levees.  

Hangingwall: Red Head / Johnson Beach / Split Rock

SEE GALLERY BELOW FOR ENLARGEMENT

SEE GALLERY BELOW FOR ENLARGEMENT

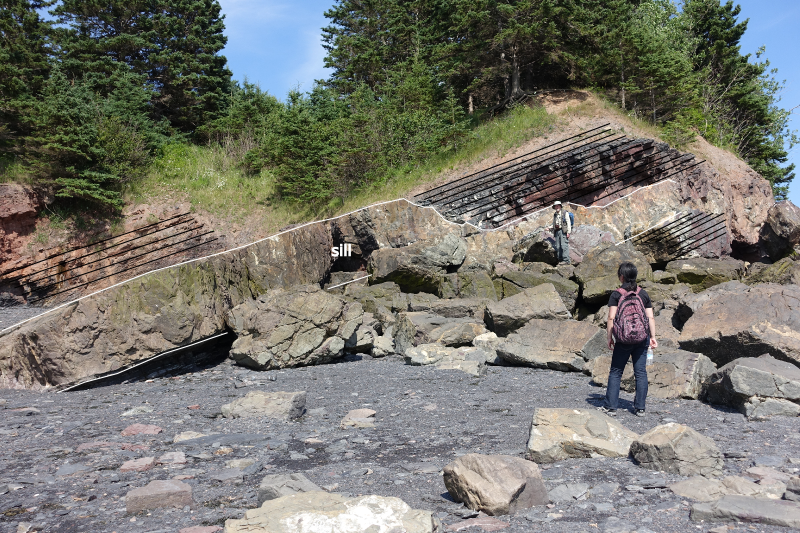
The second site featured some spectacularly folded black shales from the Horton Bluff Formation, as well as protruding sills up to two metres thick that occasionally jumped across bedding (right). We were clumsily contemplating the curious occurrence of these intrusions for quite some time until hard-rock guru Trevor McHattie halted the chatter, struck off a clean piece rock with a few blows of his hammer, wetted it with a slobbering lick, and inspected it with his hand lens. We all watched him in silence and waited for his description. I felt a little schooled. He could have said anything. It was my favourite part of the day.

Hangingwall continued: Rainy Cove

The patterns in the rocks at Rainy Cove are a wonderland for any structural geologist. It's a popular site for geology labs from Atlantic Universities, but it would be an absolute nightmare to try to actually measure the section here. 

SEE GALLERY BELOW FOR ENLARGEMENT

SEE GALLERY BELOW FOR ENLARGEMENT

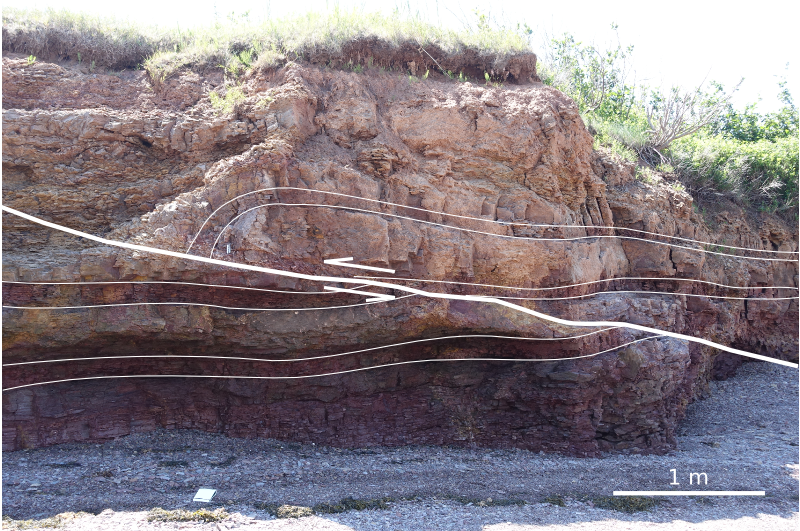
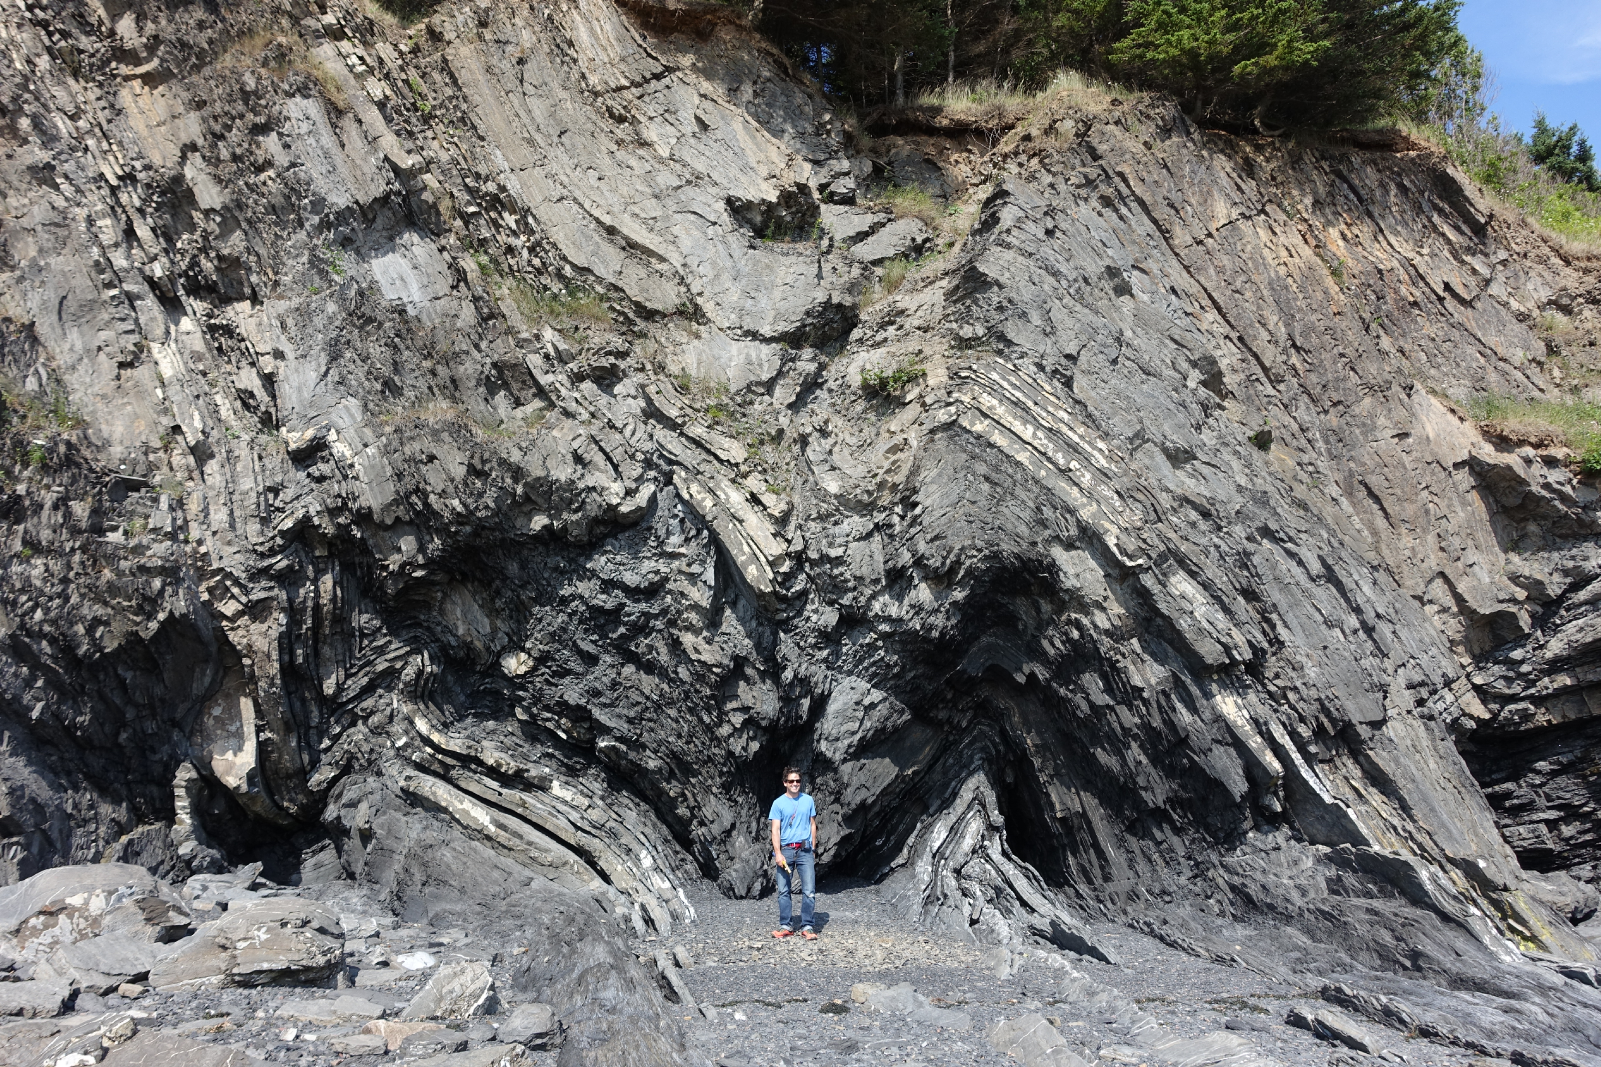
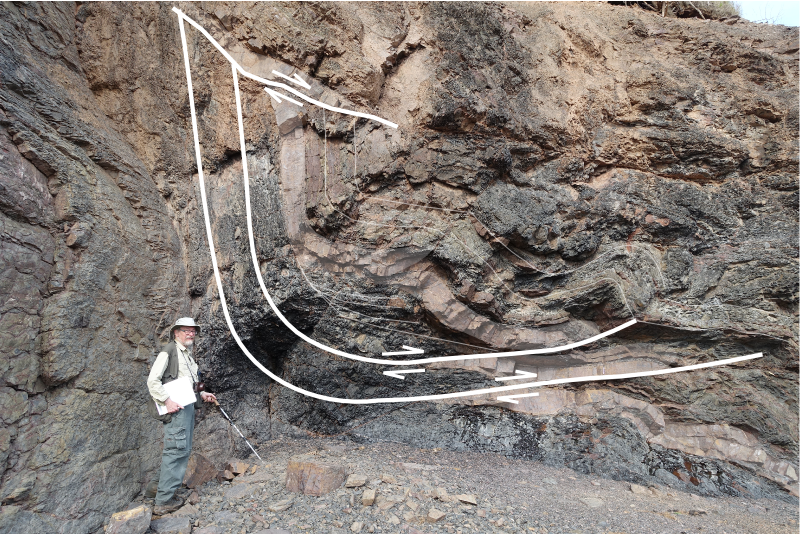
John stands next to a small system of duplicated thrusts in the main hangingwall that have been subsequently folded (left). I tried tracing out the fault planes by following the offsets in the red sandstone bed amidst black shales whose fabric has been deformed into an accordion effect. Your picks might very well be different from mine.

A short distance away we were pointed to an upside-down view of load structures in folded beds. "This antiform is a syncline", John paused while we processed. "This synform over here is an anticline". Features telling of such intense deformation are hard to fathom. Especially in plain sight.

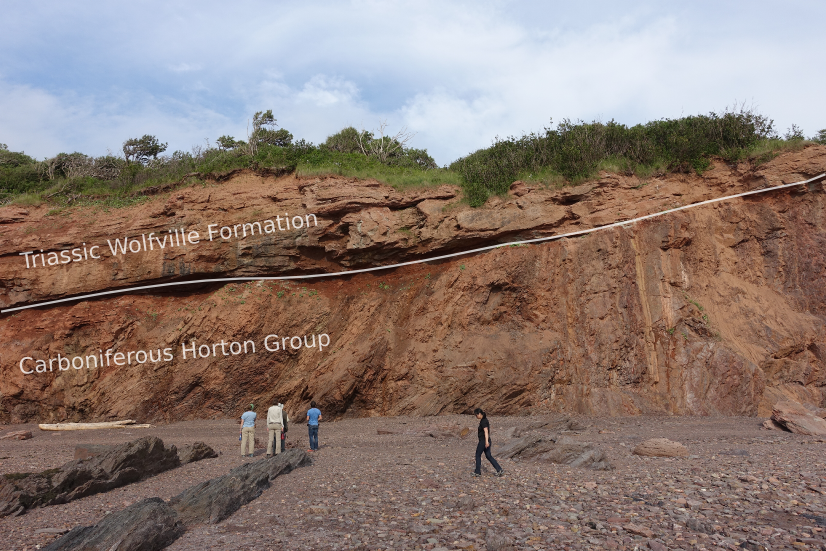
The rock lessons ended in the early evening at the far end of Rainy Cove where the Triassic Wolfville formation sits unconformably on top of ridiculously folded, sometimes doubly overturned Carboniferous Horton Rocks. John said it has to be one of the most spectacularly exposed unconformities in the world. 

I often take for granted the vast stretches of geology hiding beneath soil and vegetation, and the preciousness of finding quality outcrop. Check out the gallery below for pictures from our day.  

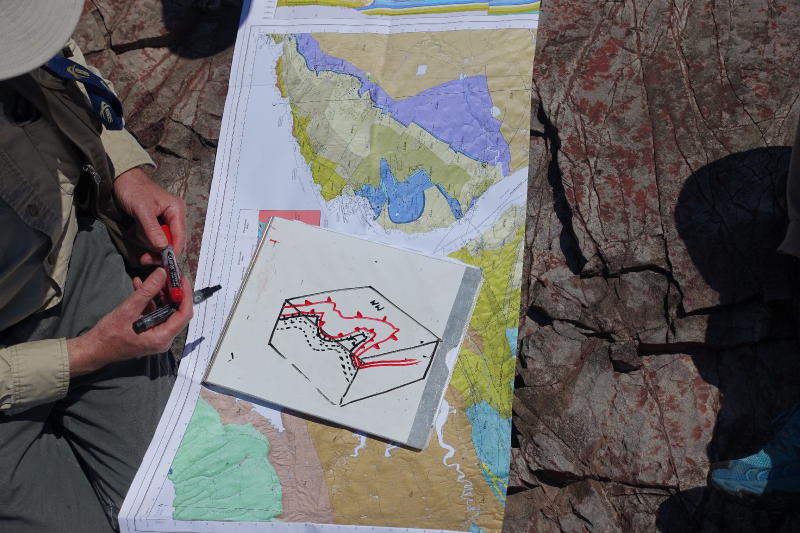
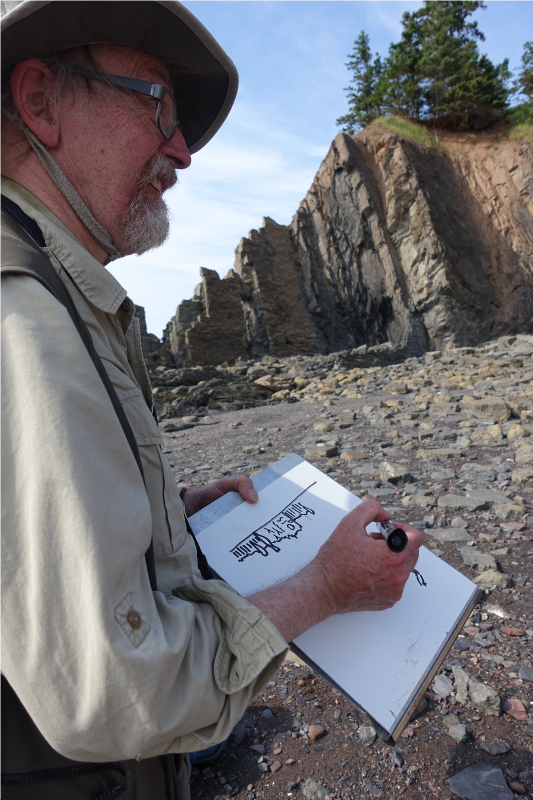
I was quite enamoured with John's format. His field trip technologies. The maps and sections: canvases for communication and works in progress. His white boarding, his map-folding techniques: a practised impresario.

What are some of the key elements from the best field trips you've been on? Let us know in the comments.

Unstable at any scale

Rights reserved, Adrian Park, University of New Brunswick

Studying outcrops can be so valuable for deducing geologic processes in the subsurface. Sometimes there is a disconnect between outcrop work and geophysical work, but a talk I saw a few weeks ago communicated nicely to both.

At the 37th Annual Colloquium of the Atlantic Geological Society, held at the Fredericton Inn, Fredericton, New Brunswick, Canada, February 11-12, 2011, Adrian Park gave a talk entitled: 

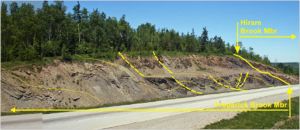
Adrian Park, Paul Wilson, and David Keighley: Unstable at any scale: slumps, debris flows, and landslides during deposition of the Albert Formation, Tournaisian, southern New Brunswick.

He has granted me permission to summarize his presentation here, which was one of my favorites talks of the conference.

Read More