Tuning geology

It's summer! We will be blogging a little less often over July and August, but have lots of great posts lined up so check back often, or subscribe by email to be sure not to miss anything. Our regular news feature will be a little less regular too, until the industry gets going again in September. But for today... here's the motivation behind our latest app for Android devices, Tune*.

Geophysicists like wedges. But why? I can think of only a few geological settings with a triangular shape; a stratigraphic pinchout or an angular unconformity. Is there more behind the ubiquitous geophysicist's wedge than first appears?

Seismic interpretation is partly the craft of interpreting artifacts, and a wedge model illustrates several examples of artifacts found in seismic data. In Widess' famous paper, How thin is a thin bed? he set out a formula for vertical seismic resolution, and constructed the wedge as an aid for quantitative seismic interpretation. Taken literally, a synthetic seismic wedge has only a few real-world equivalents. But as a purely quantitative model, it can be used to calibrate seismic waveforms and interpret data in any geological environment. In particular, seismic wedge models allow us to study how the seismic response changes as a function of layer thickness. For fans of simplicity, most of the important information from a wedge model can be represented by a single function called a tuning curve.
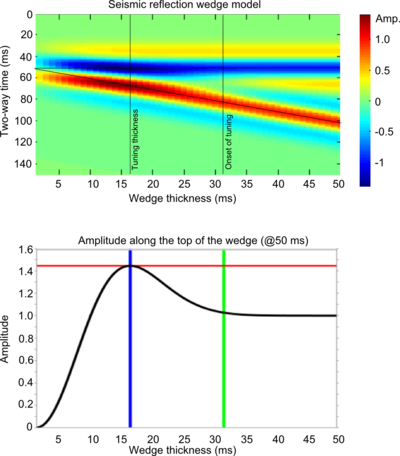
In this figure, a seismic wedge model is shown for a 25 Hz Ricker wavelet. The effects of tuning (or interference) are clearly seen as variations in shape, amplitude, and travel time along the top and base of the wedge. The tuning curve shows the amplitude along the top of the wedge (thin black lines). Interestingly, the apex of the wedge straddles the top and base reflections, an apparent mis-timing of the boundaries.

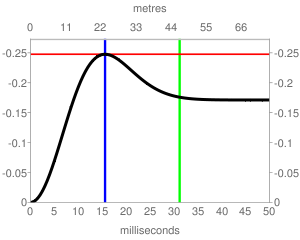
On a tuning curve there are (at least) two values worth noting; the onset of tuning, and the tuning thickness. The onset of tuning (marked by the green line) is the thickness at which the bottom of the wedge begins to interfere with the top of the wedge, perturbing the amplitude of the reflections, and the tuning thickness (blue line) is the thickness at which amplitude interference is a maximum.

For a Ricker wavelet the amplitude along the top of the wedge is given by:

where R is the reflection coefficient at the boundary, f is the dominant frequency and t is the wedge thickness (in seconds). Building the seismic expression of the wedge helps to verify this analytic solution.

Wedge artifacts

The synthetic seismogram and the tuning curve reveal some important artifacts that the seismic interpreter needs to know about, because they could be pitfalls, or they could provide geological information:

Bright (and dim) spots: A bed thickness equal to the tuning thickness (in this case 15.6 ms) has considerably more reflective power than any other thickness, even though the acoustic properties are constant along the wedge. Below the tuning thickness, the amplitude is approximately proportional to thickness.

Mis-timed events: Below 15 ms the apparent wedge top changes elevation: for a bed below the tuning thickness, and with this wavelet, the apparent elevation of the top of the wedge is actually higher by about 7 ms. If you picked the blue event as the top of the structure, you'd be picking it erroneously too high at the thinnest part of the wedge. Tuning can make it challenging to account for amplitude changes and time shifts simultaneously when picking seismic horizons.

Limit of resolution: For a bed thinner than about 10 ms, the travel time between the absolute reflection maxima—where you would pick the bed boundaries—is not proportional to bed thickness. The bed appears thicker than it actually is.

Bottom line: if you interpret seismic data, and you are mapping beds around 10–20 ms thick, you should take time to study the effects of thin beds. We want to help! On Monday, I'll write about our new app for Android mobile devices, Tune*. 

Reference

Widess, M (1973). How thin is a thin bed? Geophysics, 38, 1176–1180. 

News of the week

Happy Canada Day! Here is the news.

Scotian basin revivial?

Geologist–reporter Susan Eaton has a nice piece in the AAPG Explorer this month, explaining why some operators still see promise in the Scotian Basin, on Canada's Atlantic margin. The recent play fairway analysis mentioned in the report, however, is long overdue and still not forthcoming. When it is, we hope the CNSOPB and government promoters fully embrace openess and get more data into the public domain.

Yet another social network!

In the wake of LinkedIn's IPO, in which the first day of trading was over 500 times its net earnings in 2010, many other social networks are starting to pop up. Last month we mentioned SEG's new Communities. Finding Petroleum is a new social network, supported by the publishers of the Digital Energy Journal, aimed at oil and gas professionals. These sites are an anti-trust anomaly, since they almost have to be monopolies to succeed, and with so much momemtum carried by LinkedIn and Facebook, new entrants will struggle for attention. Most of the Commmunities in SEG seem to be essentially committee-based and closed, and LinkedIn micro-networks are getting chaotic, so maybe there's a gap here. Our guess is that there isn't.

The oil & gas blogosphere

Companies are increasingly turning to blogging and social media tools to expand their reach and promote their pursuits. Here are a couple of industry blogs that have caught our eye recently. If you are looking to read more about what's happening in subsurface oil and gas technology, these blogs are a good place to start.

If you use a microblogging service like Yammer, you may not know that you can also follow Twitter feeds. For example, here's a Twitter list of various companies in oil & gas.

Job security in geoscience

Historically, the oil and gas industry follows hot and cold (or, if you prefer, boom and bust) cycles, but the US Bureau of Labor Statistics predicts geoscience jobs will be increasingly in demand. A recent article from The Street reports on these statistics suggesting that the earth science sector is shaping up to be genuinely recession proof. If there is such a thing.

Agile* apps update

We're happy to report that all of Agile's apps have been updated in the last week, and we have a brand new app in the Android Market! The newest app, called Tune*, is a simple calculator for wedge modeling and estimating the amplitude tuning response of thin-beds, as shown here.

In our other apps, the biggest new feature is the ability to save cases or scenarios to a database on the device, so you can pull them up later.

Read more on our Apps page.

This regular news feature is for information only. Apart from Agile*, obviously, we aren't connected with any of these organizations, and don't necessarily endorse their products or services.

Can you do science on a phone?

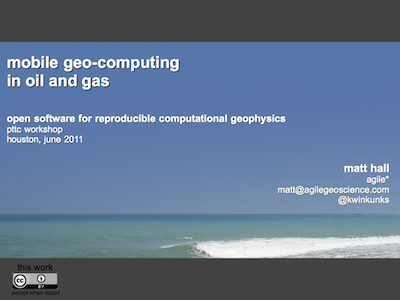
Mobile geo-computing presentationClick the image to download the PDF (3.5M) in a new window. The PDF includes slides and notes.Yes! Perhaps the real question should be: Would you want to? Isn't the very idea just an extension of the curse of mobility, never being away from your email, work, commitments? That's the glass half-empty view; it takes discipline to use your cellphone on your own terms, picking it up when it's convenient. And there's no doubt that sometimes it is convenient, like when your car breaks down, or you're out shopping for groceries and you can't remember if it was Winnie-the-Pooh or Disney Princess toothpaste you were supposed to get.

So smartphones are convenient. And everywhere. And most people seem to have a data plan or ready access to WiFi. And these devices are getting very powerful. So there's every reason to embrace the fact that these little computers will be around the office and lab, and get on with putting some handy, maybe even fun, geoscience on them. 

My talk, the last one of the meeting I blogged about last week, was a bit of an anomaly in the hardcore computational geophysics agenda. But maybe it was a nice digestif. You can read something resembling the talk by clicking on the image (above), or if you like, you can listen to me in this 13-minute video version:

So get involved, learn to program, or simply help and inspire a developer to build something awesome. Perhaps the next killer app for geologists, whatever that might be. What can you imagine...?

Just one small note to geoscience developers out there: we don't need any more seismographs or compass-clinometers!

What is commercial?

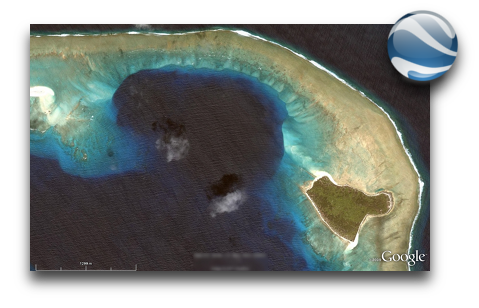
Just another beautiful geomorphological locality in Google's virtual globe software, a powerful teaching aid and just downright fun to play withAt one of my past jobs, we were not allowed to use Google Earth: 'unlicensed business use is not permitted'. So to use it we had to get permission from a manager, then buy the $400 Professional license. This came about because an early End-User License Agreement (EULA) had stipulated 'not for business use'. However, by the time the company had figured out how to enforce this stipulation with an auto-delete from PCs every Tuesday, the EULA had changed. The free version was allowed to be used in a business context (my interpretation: for casual use, learning, or illustration), but not for direct commercial gain (like selling a service). Too late: it was verboten. A game-changing geoscience tool was neutered, all because of greyness around what commercial means. 

Last week I was chastised for posting a note on a LinkedIn discussion about our AVO* mobile app. I posted it to an existing discussion in a highly relevant technical group, Rock Physics. Now, this app costs $2, in recognition of the fact that it is useful and worth something. It will not be profitable, simply because the total market is probably well under 500 people. The discussion was moved to Promotions, where it will likely never be seen. I can see that people don't want blatant commeriality in technical discussion groups. But maybe we need to apply some common sense occasionally: a $2 mobile app is different from a $20k software package being sold for real profit. Maybe that's too complicated and 'commercial means commercial'. What do you think?

But then again, really? Is everyone in applied science not ultimately acting for commercial gain? Is that not the whole point of applied science? Applied to real problems... more often than not for commercial gain, at some point and by somebody. It's hopelessly idealistic, or naïve, to think otherwise. Come to think of it, who of us can really say that what we do is pure academy? Even universities make substantial profits—from their students, licensing patents, or spinning off businesses. Certainly most research in our field (hydrocarbons and energy) is paid for by commercial interests in some way.

I'm not saying that the reason we do our work is for commercial gain. Most of us are lucky enough to love what we do. But more often than not, it's the reason we are gainfully employed to do them. It's when we try to draw that line dividing commercial from non-commercial that I, for one, only see greyness.

News of the week

This week has been fairly quiet for geoscience and technology news, so we're hijacking our own post to highlight a couple of Agile* changes you might have missed. The first one is this very feature—our News of the week post. More or less every Friday we round up some geoscience news with an oil & gas or technology angle. If you spot something you think we should include, please scribble a quick note to hello at agilegeoscience dot com!

Another new feature on our site is subscription by email. Every blog post comes right to your email inbox, so you won't miss any Agile* goodness. Go to the SUBSCRIBE box on the right (under the tag cloud), enter your email address and hit Subscribe. It's that easy! No password to remember, 100% spam free, and you can unsubscribe any time. Powered by Google.

If you're a regular reader then you know all about our new mobile apps. At the moment, for completely practical reasons, they are only available for Android™ devices. We just upgraded our first app, Volume*, a prospect volumetrics tool—now you can save and recall prospects! In the next couple of days we will launch our first über-app, AVO*. Visit the wiki for a sneak peak.

The wiki? Yes, last month we launched AgileWiki, an experiment in sharing knowledge about the subsurface. We know that much of what we know and do as industrial, applied scientists is proprietary—that's what in-house corporate wikis and knowledge bases are for. But some of it at least is basic, foundational, and generic in nature. And that's what AgileWiki is for. Join in, share what you know!

Agile's YouTube channelYou might have noticed we've started dabbling a bit with video, and have a nascent YouTube channel. Today, the focus is on our mobile apps, but we are planning features on seismic interpretation workflows and other fun things. And we're open to feedback and suggestions on this effort, please let us know what you think!

Agile Geoscience brochure imageWe work hard to be interesting and relevant, not self-promoting and commercial. But occasionally people ask us what we actually do. So we made a one-pager setting out our stall. If you need some help doing something weird and wonderful, or just tricky and time-consuming, keep us in mind! We love helping people.

This ends the public service announcement. Back to our regular news feature next week!

More geophysics apps

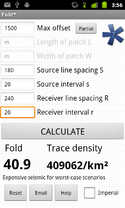
Please welcome our latest app, Fold*, into the world. It is now available for free in the Android Market. This one is aimed at geophysicists planning land 3D seismic surveys. You provide some basic data about the geometry, and the tool computes fold in natural bins, and trace density per unit area. It also provides a qualitative description of what such a geometry might be good for (simple structure only, say, or high S:N or reflectivity areas). Read all about it in the wiki.

We have also put together a new page on this website, gathering news & info all our geoscience apps in one place. You will find it in the title bar above. Please share it with anyone you see using an Android™ phone or tablet!

 If you have a wish for an app, leave a comment or drop us a line!

Volumetrics on the back of a digital envelope

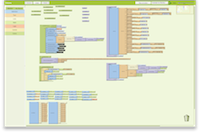
A few weeks ago we launched our first mobile app, Volume*, now available in the Android Market (you can jump right to it with the barcode on the right). If you have an Android phone or tablet, please check it out! Today, I thought I'd write a bit more about I built the app, show you some of the gory details, and tell you about the latest update.

Read More

Geophysics apps FTW

Google Nexus SI have used an Apple iPhone for several years. It's probably the loveliest technology I've ever owned. But now it's gone, it's over between us, and it will never come back. Because now I've found Android

Last Wednesday I got a Google Nexus S, chosen for its relative purity: built by Samsung, it's a Google-branded phone, so it has less of the carrier's fingerprints on it, and it gets OS updates faster. But it's not the phone I love—it doesn't have the industrial beauty of the iPhone®. It's not even Google's Android™ operating system that I'm besotted with—though it is pretty fantastic. The thing I love is App Inventor. 

If you've never tried programming a computer, you really should give it a try. For me, learning to program transforms a computer from a mere tool into a workshop. Or if you prefer, from an instrument into an orchestra—sounds a bit less utilitarian that way. And I tentatively assert that you will never look at a problem, at least a technical one, in the same way again.

Google App Inventor™ is a programming environment for your phone. You do the programming in a web browser, but the thing you build runs on your phone, or anyone else's phone (as long as it's running Android, natch). Everything is free. And it's easy. Not 'quite easy'. Really easy. If this doesn't sound pretty amazing, you should probably stop reading now. 

Agile Volume app screenshotSince last Friday, I have built four applications, three of which are geoscientiferous:

  • Fold* computes fold and trace density, given a seismic acquisition geometry
  • Elastic* finds all of the elastic parameters, given VP, VS, and density
  • Volume* calculates oil in place, given some reservoir properties (shown)

I had each app working, in a basic way, inside an hour. The only slightly tricky thing is setting up the logic to handle blank fields, weird oilfield units, and that sort of thing. Aesthetics can also be fiddly, especially if you are making custom graphics. But if you skip looks and error handling, perhaps because you don't intend to give the app to anyone else, then you can be done in under an hour. 

Evan and I have barely started to explore the tools available. The language inside App Inventor is based on MIT Scratch, the building-block visual interface with a long history at MIT. The vocabulary is very rich: there are math processes, logical constructs, text handlers. You can access the phone, email, the GPS, and even the accelerometer (for instance, in our apps you can shake the phone to clear the parameters and start over). You can draw interactive graphics, scan barcodes, or build a persistent database.

The only problem we've run into so far is the final hurdle: you cannot (yet—App Inventor is still in beta) easily publish your finished app to the Android Market, so that others can download it. There are non-easy ways, and we hope to have our apps up soon. They will be free, though we may experiment with freemium

Next week I'll write a bit about Volume* and show you how the inside of it looks. In the meantime, give it a try... or if you prefer, let us know if there's a killer geoscience app you'd love to have on your phone. I'm on a roll!

Find out more

The Wikipedia articles on Android and App Inventor are very nice summaries. 

iPhone is a registered trademark of Apple, Inc. Android and App Inventor are trademarks of Google Inc. Agile is not connected in any way with any of these marks or companies.