Visual explanations of mathematics

It is thought that Euclid wrote Elements in about 300 BC, but Oliver Byrne turned it into one of the true gems of visualization — and made it about 100 times more readable. By seamlessly combining typeset text (Caslon, if you’re interested) with minimalist geometric drawings in primary colours, he didn’t just reproduce the text; he explained it in a new way.

annotated_byrne_euclid.png

If you like the look of it, it’s even cooler in Nicholas Rougeur’s beautiful interactive version.

This is a classic example of what Edward Tufte, the modern saint of visualization, calls a visual explanation (he wrote a whole book about the subject). We’ve written about the subject before (for example, see Evan’s 2014 post, Graphics that repay careful study). Figures and charts should do more than merely illustrate, they should elucidate.

Too often, equations — for example the myriad equations in any volume of GEOPHYSICS — do not elucidate. Indeed, they barely even illustrate. In some cases, it’s worse: they obfuscate. You might think mathematics is too dry, or too steeped in convention, for it to be any other way. Equations just are. But Byrne showed us that we can do better.

A few years ago, in an attempt to broaden my geophysical knowledge, I bought a copy of Daniel Fleisch’s book on Maxwell’s equations. It’s excellent, and the others in the series are good too. I especially liked the annotated equations; I’ve lightened the annotations in this version, to put them on a separate visual ‘layer’:

annotated_maxwell_by_fleisch.jpeg

In 2010, Randall Munroe of xkcd applied a similar strategy to label The Flake Equation, his parody of the Drake equation:

annotated_flake_equation.png

There are still other examples out there.

Later, I came across some lovely colourized equations by Stuart Riffle, a game developer. There was a bit of buzz about them on social media. Most people loved them, but a few pointed out that they suffer from the ‘legend lookup’ problem, and the colours he chose might not be great for colourblind people. Still, I like the concept — here’s the Fourier transform:

annotated_Fourier_Transform.png

Direct annotation, something Tufte always advocates, avoids the legend lookup problem. In his 2016 Geophysics Tutorial on finite volume methods, Rowan Cockett showed that colour and labels can work together:

annotated_equation_by_rowan_cockett.jpeg

And in his Observable post on the predator–prey interaction, modern visualization legend Mike Bostock avoids the problem entirely with the use of pictograms: direct representation of what the symbols represent:

annotated_predator_prey.png

Observable is interesting because the documents are runnable code. And this reminds us that mathematics — equations, data structures, and so on — has another expression: code. While symbolic representation speaks directly to some people, code speaks to others, probably more. Look at Randall Munroe’s annotation of a Wolfram Alpha equation (similar to an Excel formula) from his (wonderful) book, What If:

annotated_golf_xkcd.png

What I love about this is the direct path to exploring the function yourself. It would take me an hour to implement Fleisch’s electric field integral in code, even with the annotations. Typing in this — admittedly less useful — rocket golf equation will take me two minutes. Expressing mathematics in code is the ultimate explicit and practical expression of an idea.

We have lots of tools to write better mathematics: LaTeX, markdown, Jupyter Notebooks, and so on. But it feels like nothing has really converged yet. Technology that seamlessly mixes symbolic equations, illustrative-and-explicative annotation, and runnable code is, I am sure, not far off. Until then, we do the best we can with the tools we have.


Have you seen nice examples of annotated equations? I’d love to hear about them; let me know in the comments!


Don’t miss the follow-up post from 2021: Illuminated equations.


The work by Byrne is out of copyright. Those by Munroe and Cockett are openly licensed under Creative Commons. The work of Fleisch and Bostock are used in accordance with Fair Use doctrine.

Are these the heroes we need?

First rule of criticism: balance it with something positive.

Technical societies — AAPG, SEG, SPE, EAGE, and the many others — do important work in our discipline. They publish some quality content, they organize a lot of meetings, and they help attract talent to work in subsurface science and engineering.

The door is wide open for them to play a central role in the change that’s coming to our lives as subsurface professionals.

Second rule of criticism: stick to the facts.

In spite of their central role in many scientists’ professional lives, and the magnitude of the changes that are underway, technical societies have struggled to maintain relevance and therefore members. It’s hard to know the extent of the problem, as AAPG doesn’t report how many members it has (it’s been “approximately 30,000” for years) and SEG stopped reporting numbers in 2017. Make of that what you will.

Anecdotally, many of my friends have let their memberships lapse. I have too.

Third rule of criticism: avoid negative language.

AAPG came up with a couple of cool superheroes. They commissioned some artwork: two fit, handsome geologists, ready for anything. Their names? Trap Mitchell and Alluvia Hunt.

AAPG_Trap_and_Alluvia.jpg

The laudable appearance of a woman — a non-white woman! — in this context rightly prompted praise:

How appalling is it that a geoscientist had to wait 23 years to see a female geoscientist take centre stage like this? I’m embarrassed by that. Kudos to AAPG for that decision.

Kudos which we have to partially revoke, unfortunately. Because the decision, if it was a decision, to change Alluvia’s skin colour in different situations is… well, it doesn’t look good. At best, it’s weird.

Fourth rule of criticism: be honest.

When I saw this dynamic duo, I rolled my eyes. Of course I did: I’m predisposed to criticize the technical societies and I’m a well-known marketing whiner. And as a scientist in Software Underground pointed out, it’s not targeted at me; she also found it uplifting. (Obvious in hindsight, but the whole point of my various privileges is that everything seems to be about me — it’s good to be reminded of our blindspots.)

But I’m trying to be positive here. I rolled my eyes because I think AAPG and the other societies can have a far-reaching and positive impact on our community, and on society. There is hard work to be done finding enough energy and raw materials for people to prosper.


The door is wide open

If AAPG wants to be part of the future, they have to figure out what ‘relevant’ means. Being relevant does not mean:

  • Promoting oil & gas exploration with dysmorphic Barbie & Ken super-hero cartoon characters.

  • Paywalled everything, especially journals and conference papers.

  • Awards named after men and given to mostly men. And don’t get me started on ‘Distinguished’ people.

  • Doing all the other things you’ve always done which have led you to feel ‘not relevant’ today.

I would urge AAPG and all technical societies to consider becoming more relevant in some new ways:

  • Understand that oil & gas, while certainly important to society today, needs to end. The sooner the better.

  • Realize that subsurface professionals can contribute to society, and industry, in hundreds of other ways.

  • See that this change is going to require a massive educational effort, both for us, and for society.

  • Believe that we need to massively broaden our community if we are to have the impact we can have.

  • Remove barriers to knowledge by committing to open access content and open data.

  • Remove barriers to participation by welcoming and representing everyone with equity and compassion.

The days of the hero explorer — tanned and lean, chiselled and serious, whacking stuff with hammers — are gone. Really, they never existed, or at least they were accompanied by a masculine monoculture and a total neglect for the environment.

The future can be different. Ms Hunt and Trap can be part of it. I believe we all can. But it’s going to require hard work, uncomfortable decisions, and abrupt, profound change. The door is wide open for AAPG, SEG, EAGE, and the other technical societies, if they would only notice.


What do you think? Are Trap & Alluvia just a bit of fun that might attract a new generation? Or do our technical societies need a lot more than cartoon heros and heroines? Let us know in the comments.

The hacks are back

We ran the first geoscience hackathon over 7 years ago in Houston. Since then we’ve hosted another 26 subsurface hackathons — that’s 175 projects, and over 900 hackers. Last year, 10 of the 11 hackathons that Agile* facilitated were in-house.

This is exciting. It means that grass-roots, creative, high-speed collaboration and technology development is possible inside large corporations. But it came at the cost of reducing our public events… and we want to bring the hackathon experience to everyone!

So this year, as well as helping execute a dozen or so in-house hackathons, we’ll be running and supporting more public hackathons too. So if you’ve been waiting for a chance to learn to code or try a social coding event, or just hang out with a lot of nerdy geoscientists and engineers — here’s your chance!


May: Geothermal Hackathon

The first event of the year is a new one for us. We’ll be at the World Geothermal Congress in Reykjavik, Iceland, in the last week of April. The second weekend, 2 and 3 May, we’ll be running a hackathon on machine learning for geothermal subsurface applications. Iceland is only a short flight from the rest of Europe and many places in North America, so if you fancy something completely different, this is for you! Find out more and sign up.

[An earlier version of this post had the event on the previous weekend.]


June: Subsurface Hackathon (USA)

We’re back in Houston in June! The AAPG ACE is there — clashing with EAGE unfortunately — and we’ll be holding a (completely unrelated) hackathon on the weekend before: 5 to 7 June. Enthought is hosting the event in their beautiful new Houston digs, and Dell EMC is there too as a major sponsor. The theme is Tools… It’s going to be a big one! Find out more and sign up.

We are running two public Python classes before this event. Check them out.

houston-2020-sponsors.png
 

June: Amstel Hack (Europe)

The brilliant Filippo Broggini (ETHZ) is running a European hackathon again this year, again right before EAGE — and therefore the same weekend as the Houston event: 6 and 7 June. The event is being hosted at Shell’s Technology Centre in Amsterdam, and is guaranteed to be awesome. If you’re going to EAGE, it’s a no-brainer. Find out more and sign up.

We are also running a public Python class before this event. Check it out.

amstel-2020-sponsors.png
 

That’s it for now… I hope you can come to one of these events. If you’re just starting out on your technology journey, have no fear — these events are friendly and welcoming. If you can’t make any of them, don’t worry: there will be more in the autumn, so stay tuned. Or, if you want help making one happen at your company, get in touch.

Learn to code in 2020

Happy New Year! I hope 2020 is going well so far and that you have audacious plans for the new decade.

Perhaps among your plans is learning to code — or improving your skills, if you’re already on the way. As I wrote in 2011, programming is more than just writing code: it’s about learning a new way to think, not just about data but about problems. It’s also a great way to quickly raise your digital literacy — something most employers value more each year. And it’s fun.

We have three public courses planned for 2020. We’re also planning some public hackathons, which I’ll write about in the next week or three. Meanwhile, here’s the lowdown on the courses:

Lausanne in March

Rob Leckenby will be teaming up with Valentin Metraux of Geo2X to teach this 3-day class in Lausanne, Switzerland. We call it Intro to Geocomputing and it’s 100% suitable for beginners and people with less than a year or so of experience in Python. By the end, you’ll be able to read and write Python, write functions, read files, and run Jupyter Notebooks. More info here.

Amsterdam in June

If you can’t make it to Lausanne, we’ll be repeating the Intro to Geocomputing class in Amsterdam, right before the Software Underground’s Amstel Hack hackathon event (and then the EAGE meeting the following week). Check out the Software Underground Slack — look for the #amstel-hack-2020 channel — to find out more about the hackathon. More info here.

Houston in June

There’s also a chance to take the class in the US. The week before AAPG (which clashes with EAGE this year, which is very weird), we’ll be teaching not one but two classes: Intro to Geocomputing, and Intro to Machine Learning. You can take either one, or both — but be aware that the machine learning class assumes you know the basics of Python and NumPy. More info here.

In-house options

We still teach in-house courses (last year we taught 37 of them!). If you have more than about 5 people to train, then in-house is probably the way to go; we’d be delighted to work with you to figure out the best curriculum for your team.

Most of our classes fall into one of the following categories:

  • Beginner classes like the ones described above, usually 3 days.

  • Machine learning classes, like the Houston class above, usually 2 or 3 days.

  • Other more advanced classes built around engineering skills (object-oriented programming, testing, packaging, and so on), usually 3 days.

  • High-level digital literacy classes for middle to upper management, usually 1 day.

We also run hackathons and design sprints for teams that are trying to solve tricky problems in the digital subsurface, but those are another story…

Get in touch if you want more info about any of these.


Whatever you want to learn in 2020, give it everything you have. Schedule time for it. The discipline will pay off. If we can help or support you somehow, please let us know — above all, we want you to succeed.

This post is the key to the presents

It’s that time when we celebrate the end of the old year and the beginning of a new one with delicious edibles and the exchange of gifts. So here we are again with what to get the most significant geologist (or geologist-to-be) in your life for Christmas. (It’s the 10th edition! Amazing. And I’m going to keep it up until someone gets the hint about the Triceratops skull.)

Rock chips and dip

Want to get a compass but don’t know where to turn? I did some research for you and learned something in the process: compasses can be super-expensive. So decide on your budget, then try these on for size:

The famous COCLA compass from Breithaupt.

The famous COCLA compass from Breithaupt.

  • The Breithaupt Stratum compass, aka COCLA (right), is the compass sans pareil… but it costs USD1500. Breithaupt make lots of other awesome geological toys, including several other compasses.

  • The Brunton Axis Pocket Transit is a classic compass and tries to make it easier to measure dip and azimuth. It’s up there in price though: over USD 700.

  • A couple of German companies make more affordable units: Krantz makes all sorts of stuff for geologists, including the Geologists Compass, and Kasper & Richter make the Meridian Pro, a USD 180 compass.

  • The Chinese manufacturer Harbin makes a very good compass, the DQL-8, which you should find under USD 100.

  • The Silva Expedition S and Suunto MC-2 NH both feature a clinometer and cost under USD 100.

Cool stuff

A Burmeister block, a Groove bag, a Scott Huebner burl wood sculpture, and some awesome field boots.

A Burmeister block, a Groove bag, a Scott Huebner burl wood sculpture, and some awesome field boots.

Games

It’s the time of year for board games. But you don’t want to be stuck with yet another game of Monopoly or Trivial Pursuit. Get some geological games instead! Sticking with the structural geology theme, let’s start with the eartquake-related games. They all focus on the Bay Area of California. In 1906 San Francisco and Aftershock (due out any day now), you must rebuild the great city, hampered by cashflow and… aftershocks! There’s also an Age of Steam expansion board for the San Andreas Fault, if you’re into that.

earthquake_games.png

If volcanos are more your thing, there are lots more to choose from… On the theme of volcanos you have Fuji, which looks beautifully designed, as well as Taluva, Haleakala, and Triassic Terror, which also involves dinosaurs, so...

volcano_games.png

Books

All these new-in-2019 books have lots of pictures, which is my main prerequisite for a book.

books_for_2019.png

That’s all I have. Best of luck finding something for that special rockologist. Don’t panic — geologists are actually really easy to please. Most of them will be happy with a pair of dry socks, some coloured pencils, a new bobble hat, or a cold bottle of beer. If you find anything extra-special while you’re out shopping, please share it in the comments!


Unlike most images on agilescientific.com, the ones in this post are not my property and are not open access. They are the copyright of their respective owners, and I’m using them here in accordance with typical Fair Use terms. If owners object, please let me know.

FORCE ML 2019: project round-up

The FORCE Machine Learning Hackathon and Symposium were a great success again this year (read all about last year). Kudos to Peter Bormann of ConocoPhillips Norge, who put the programme together — held over 3 days at the NPD in Stavanger, Norway, together. Here’s a round-up of the projects.

A visualization of how human-generated rock descriptions were distributed with respect to porosity measured from the core plug.

A visualization of how human-generated rock descriptions were distributed with respect to porosity measured from the core plug.

from.cr.dscrptn.to.clssfctn

The team took up Peter’s challenge of translating abbreviated core descriptions (hence the strange team name) into something useful. Overall, the pipeline was clean > translate > classify. Cleaning was required to deal with a lot of ‘as above’ and other expediencies. As a first pass for translation, they tried simply substituting complete words for abbreviations: sandstone for ss, limestone for ls, and so on, but had more success with a bidirectional LSTM.

Find it clean it analyse it

Given a pile of undifferentiated well files containing over 40,000 curves including LAS and DLIS, the team wanted to find and analyse image log data, especially FMIs. They successfully read the data they wanted with the new dlisio library from Equinor, then threw some texture analysis at it after interpolating across the data gaps and resampling to 360 bins. They then applied a k-means clustering with 6 clusters, to find some key textures in the data. GitHub repo.

Just Surf

Using a synthetic dataset, the team (mostly coders from Emerson) set out to use convolutional deep neural networks to check if the structural model seems sensible, quantify the uncertainty, and validate the gridding algorithm used. The team brought 100 realizations for each map, and tried various combinations of single realizations and statistics from the cohort. They found that transfer learning on ResNet-50 did better than training from scratch. They said they looked forward to building on the work to produce tools for quality assurance, and they hope to use seismic data next time.

Screenshot from 2019-10-11 14-40-39.png

Siamese seismic

The team applied a Siamese network, normally used on human faces, to the problem of classifying 3D seismic facies. The method is semi-supervised: the network is trained on the entire dataset, with some labeled subimages. This establises a latent space (a 3D latent space of the F3 seismic data is shown to the right) with semantically meaningful norms (i.e. distance between points means something useful), in which clusters can be found. Classification on unseen subimages is done in the latent space. The team almost had an app working, and also produced the start of a new open dataset of labels for the F3 seismic volume. The team was rewarded with a prize for innovation. GitHub repo.

Lost Frequencies

This team formed spontaneously at the Tuesday meetup when it looked like there might not be any seismic projects! They set out to estimate attenuation using neural networks. This involved learning to pick maximum frequency from the peak frequency plus the seismic trace. They found that a 1D CNN did best out of all the methods they tried, and that including well logs somehow would likely improve the result quite a bit.

Rock Pandas

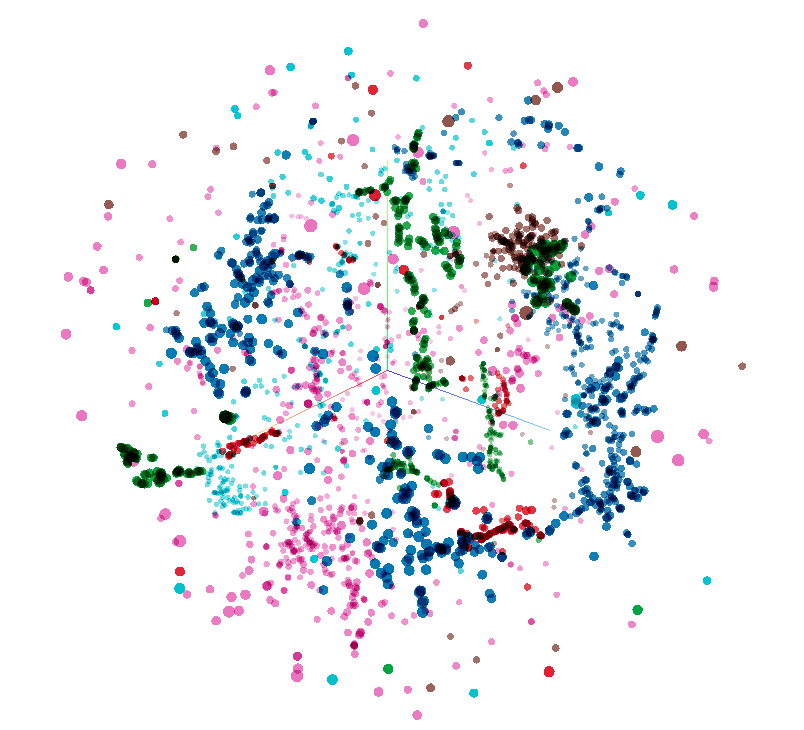
A creenshot from the app the team built. Each circle is a collection of documents that can be filtered dynamically.

A creenshot from the app the team built. Each circle is a collection of documents that can be filtered dynamically.

Geolocalizing documents is a much-needed task in any pile of PDF files. This team got lots of documents from Peter, with the goal to put them on a map. The characteristically diverse team extracted keywords from an NPD corpus, with preprocessing and regular expressions for well names and so on. They built a nice-looking slippy map app allowing a user to click on a well or field entity, and see the documents associated with the location. Documents hitting multiple keywords were tagged on many entities. The Rock Pandas team won the coveted People's Choice Award, for making a great start on a hard problem, and producing a working app in limited time. GitHub repo.

Core team

In a reprise of a project last year, the team set out to get grain size from core photos. But then they thought: why not cut out the middle man and go straight for reservoir parameters? So they tried to get permeability from core photos. Using simple models, they got an accuracy of 60% with linear regression, and 69% with a neural network. Although they had some glitches in their approach (using porosity and not using depth, for example), they built a first pipeline for an interesting problem.

Some Unsupervised team members clustering around a problem.

Some Unsupervised team members clustering around a problem.

Somehow Unsupervised

Unsupervised learning has been a theme in a coupe of previous hackathons (Copenhagen and FORCE 2018), and it was good to see another iteration of these exciting ideas. The team used the very nice Geolink dataset. After filtering out poor quality data (based on caliper and local statistics), the team applied dimensionality reduction methods like UMAP and t-SNE (these are conceptually like PCA, but much more effective) to reduce the dataset to just 2 dimensions — allowing them to make lots of crossplots. Coloring points by lithology, sand type, GR, or fluid type allowed them to look at all sorts of trends and patterns. The team won a prize for the amount of ground they covered and the attractive plots. GitHub repo.

Rock Stars

The Rock Stars took on Peter’s Make me that rock project. He wants an app which provides plausible rock properties and uncertainty for any location, depth, and formation on the Norwegian shelf. This gigantic team (12 of them!) decided to cluster the data first, then build a model for each cluster. They built an app which could indeed provide porosity and permeability given a location and depth. That such a huge team managed to converge on anything was an achievement, and they won a prize for taking on a tough project and getting a good way into it.


That’s it for this year! Thanks to all the participants for a fun week, and thank you to the sponsors (below) for supporting the event. Hope to see you in 2020.

FORCE_2019_sponsors.png

More pictures from the event. Thanks to Alex Schaaf and the others that took photos.

Superpowers for striplogs

In between recent courses and hackathons, I’ve been chipping away at some new features in striplog. An open-source Python package, striplog handles irregularly sampled data, like lithologic intervals, chronostratigraphic zones, or anything that isn’t regularly sampled like, say, a well log. Instead of defining what is present at every depth location, you define intervals with a top and a base. The interval can contain whatever you like: names of rocks, images, or special core analyses, or anything at all.

You can read about all of the newer features in the changelog, but let’s look at a couple of the more interesting ones…

Binary morphology filters

Sometimes we’d like to simplify a striplog a bit, for example by ‘weeding out’ the thin beds. The tool has long had a method prune to systematically remove all intervals (e.g. beds) thinner than some cutoff; one can then optionally anneal the gaps, and merge the resulting striplog to combine similar neighbours. The result of this sequence of operations (prune, anneal, merge, or ‘PAM’) is shown below on the left.

striplog_binary_ops.png

If the intervals of a striplog have at least one property of a binary nature — with only two states, like sand and shale, or pay and non-pay — one can also use binary morphological operations. This well-known image processing technique aims to simplify data by eliminating small things. The result of opening vs closing operations is shown above.

Markov chains

I wrote about Markov chains earlier this year; they offer a way to identify bias in the order of units in a stratigraphic column. I’ve now put all the code into striplog — albeit not in a very fancy way. You can import the Markov_chain class from striplog.markov, then use it in exactly the same way as in the notebook I shared in that Markov chain post:

I started with some pseudorandom data (top) representing a known succession of Mudstone (M), Siltstone (S), Fine Sandstone (F) and coarse sandstone (C). Then I generate a Markov chain model of the succession. The chi-squared test indicates that the succession is highly unlikely to be unordered. We can look at the normalized difference matrix, generate a synthetic sequence of lithologies, or plot the difference matrix as a heatmap or a directed graph. The graph illustrates the order we originally imposed: M-S-F-C.

There is one additional feature compared to the original implementation: multi-step Markov chains. Previously, I was only looking at immediately adjacent intervals (beds or whatever). Now you can look at actual vs expected transition frequencies for next-but-one interval, or next-but-two. Don’t ask me how to interpret that information though…

Other new things

  • New ways to anneal. Now the user can choose whether the gaps in the log are filled in by flooding upwards (that is, by extending the interval below the gap upwards), flooding downwards (extending the upper interval), or flooding symmetrically into the middle from both above and below, meeting in the middle. (Note, you can also fill gaps with another component, using the fill() method.)

  • New merging strategies. Now you can merge overlapping intervals by precedence, rather than by blending the contents of the intervals. Precedence is defined however you like; for example, you can choose to keep the thickest interval in all overlaps, or if intervals have a date, you could keep the latest interval.

  • Improved bar charts. The histogram is easier to use, and there is a new bar chart summary of intervals. The bars can be sorted by any property you like.

Try it out and help add new stuff

You can install the latest version of striplog using pip. It’s as easy as:

pip install striplog

Start by checking out the tutorial notebooks in the repo, especially Striplog_basics.ipynb. Let me know how you get on, or jump on the Software Underground Slack to ask for help.

Here are some things I’d like striplog to support in the future:

  • Stratigraphic prediction.

  • Well-to-well correlation.

  • More interactions with well logs.

What ideas do you have? Or maybe you can help define how these things should work? Either way, do get in touch or check out the Striplog repository on GitHub.

x lines of Python: Loading images

Difficulty rating: Beginner

We'd often like to load images into Python. Once loaded, we might want to treat them as images, for example cropping them, saving in another format, or adjusting brightness and contrast. Or we might want to treat a greyscale image as a two-dimensional NumPy array, perhaps so that we can apply a custom filter, or because the image is actually seismic data.

This image-or-array duality is entirely semantic — there is really no difference between images and arrays. An image is a regular array of numbers, or, in the case of multi-channel rasters like full-colour images, a regular array of several numbers: one for each channel. So each pixel location in an RGB image contains 3 numbers:

raster_with_RGB_triples.png

In general, you can go one of two ways with images:

  1. Load the image using a library that 'knows about' (i.e. uses language related to) images. The preeminent tool here is pillow (which is a fork of the grandparent of all Python imaging solutions, PIL).
  2. Load the image using a library that knows about arrays, like matplotlib or scipy. These wrap PIL, making it a bit easier to use, but potentially losing some options on the way.

The Jupyter Notebook accompanying this post shows you how to do both of these things. I recommend learning to use some of PIL's power, but knowing about the easier options too.

Here's the way I generally load an image:

 
from PIL import Image
im = Image.open("my_image.png")

(One strange thing about pillow is that, while you install it with pip install pillow, you still actually import and use PIL in your code.) This im is an instance of PIL's Image class, which is a data structure especially for images. It has some handy methods, like im.crop(), im.rotate(), im.resize(), im.filter(), im.quantize(), and lots more. Doing some of these operations with NumPy arrays is fiddly — hence PIL's popularity.

But if you just want your image as a NumPy array:

 
import numpy as np
arr = np.array(im)

Note that arr is a 3-dimensional array, the dimensions being row, column, channel. You can go off with arr and do whatever you need, then cast back to an Image with Image.fromarray(arr).

All this stuff is demonstrated in the Notebook accompanying this post, or you can use one of these links to run it right now in your browser:

Binder   Run the accompanying notebook in MyBinder


Advice for a new hacker

So you’ve signed up for a hackathon — or maybe you’ve seen an event and you’re still thinking about it.

First thing: I can almost guarantee that you will not regret it, so if you haven’t committed yet, I challenge you to go and sign up now.

But even once you’ve chosen to go, maybe you feel nervous about your skills, or are worried about spending two days with strangers, or aren’t sure about the idea of competitive coding. Someone asked me recently how to prepare — technically and mentally — for the event.

I should say that I’ve only participated in a couple of hackathons, so I definitely don’t know everything there is to know. But I have organized more than 20 hackathons, and helped people skill up for them and (I hope!) enjoy them. Here are the top 10-ish things you can to do to get the most out of the event:

  1. Brush up on your coding. Before the event, find out a bit about what kinds of projects are in the offing. If it’s a machine learning theme, brush up on your data science. Maybe image processing or text processing will be needed. Data management skills and database manipulation are always appreciated. Familiarty with a cloud environment, e.g. AWS, will help.

  2. Find a friend. Either take someone with you, or find a friendly face when you get there. It’s 100% possible to navigate the experience on your own, but much more fun with a partner.

  3. Dive in. You get out of the event what you put in. It’s like most learning experiences. You need an open mind, an enthusiastic demeanour, and a can-do attitude.

  4. Contribute. There’s never enough time, so you are a much-needed part of your team, but unless there’s a strong effort to coordinate the project, it’ll be a bit unstructured. You’ll have to take the initiative on things.

  5. Use a kanban. To help team members see the big picture and select tasks for themselves, put them on stickies on a nearby board. Make 3 areas: ‘to do’, ‘in progress’ and ‘done’. The goal is to move them from left to right.

  6. Ask for help. Every event Agile runs has non-hackers around to help out with stuff — anything from dietary needs to datasets to coding advice. Don’t get stuck on something, find someone to help you.

  7. Take breaks. You and your team should go for a short walk every 90 minutes or so. Relax a bit, but also get caught up: get progress reports from everyone, re-evaluate the goals, identify issues. You will find more clarity away from your keyboards.

  8. Work backwards from the demo. A good strategy is to outline what would make a killer demo of the project you have selected. Include at least one “Wow” feature if at all possible. Then work out what you need to either fake or build to make that demo. Build what you can, fake the rest.

  9. Check in with the other teams. This might not fly at highly competitive events, but at more casual affairs or if everyone is working on different projects, try chatting to some other teams, especially during breaks.

  10. Label your equipment. Hackathons are pretty chaotic, and although 99.9% of hackers are awesome, it’s still a roomful of strangers, so label the gear you care about. And of course keep your phone and computer locked.

  11. Reciprocate. Almost all these bits of advice have corollaries: be friendly and welcoming, accept contributions from others, give help if asked, and so on. Hackathons are social events as much as technical ones — enjoy meeting and collaborating with others.

If you have signed up for an event — I hope you love it! Do let us know how you get along. Or, if you’ve already been to a hackathon and have some advice to share — leave a comment below.


If you’re looking for an event to go to and you’re in western Europe — here’s one! It’s the FORCE Machine Learning Hackathon in Stavanger, Norway. I recently wrote about it — check it out.

If you’re looking for subsurface or geoscience project ideas, then I have a lot of reading for you. Check out the long list of hackathons reports on this blog. You can also dive into the Software Underground Slack to discuss project ideas there.

x lines of Python: Physical units

Difficulty rating: Intermediate

Have you ever wished you could carry units around with your quantities — and have the computer figure out the best units and multipliers to use?

pint is a nice, compact library for doing just this, handling all your dimensional analysis needs. It can also detect units from strings. We can define our own units, it knows about multipliers (kilo, mega, etc), and it even works with numpy and pandas.

To use it in its typical mode, we import the library then instantiate a UnitRegistry object. The registry contains lots of physical units:

 
import pint
units = pint.UnitRegistry()
thickness = 68 * units.m

Now thickness is a Quantity object with the value <Quantity(68, 'meter')>, but in Jupyter we see a nice 68 meter (as far as I know, you're stuck with US spelling).

Let's make another quantity and multiply the two:

 
area = 60 * units.km**2
volume = thickness * area

This results in volume having the value <Quantity(4080, 'kilometer ** 2 * meter')>, which pint can convert to any units you like, as long as they are compatible:

 
>>> volume.to('pint')
8622575788969.967 pint

More conveniently still, you can ask for 'compact' units. For example, volume.to_compact('pint') returns 8.622575788969966 terapint. (I guess that's why we don't use pints for field volumes!)

There are lots and lots of other things you can do with pint; some of them — dealing with specialist units, NumPy arrays, and Pandas dataframes — are demonstrated in the Notebook accompanying this post. You can use one of these links to run this right now in your browser if you like:

Binder   Run the accompanying notebook in MyBinder

Open In Colab   Run the notebook in Google Colaboratory (note the install cell at the beginning)

That's it for pint. I hope you enjoy using it in your scientific computing projects. If you have your own tips for handling units in Python, let us know in the comments!


There are some other options for handling units in Python:

  • quantities, which handles uncertainties without also needing the uncertainties package.
  • astropy.units, part of the large astropy project, is popular among physicists.