x lines of Python: Ternary diagrams

Difficulty rating: beginner-friendly

(I just realized that calling the more approachable tutorials ‘easy’ is perhaps not the most sympathetic way to put it. But I think this one is fairly approachable.)

If you’re new to Python, plotting is a great way to get used to data structures, and even syntax, because you get immediate visual feedback. Plots are just fun.

Data loading

The first thing is to load the data, which is contained in a Google Sheets spreadsheet. If you make a sheet public, it’s easy to make a URL that provides a CSV. Happily, the Python data management library pandas can read URLs directly, so loading the data is quite easy — the only slightly ugly thing is the long URL:

    import pandas as pd
    uid = "1r7AYOFEw9RgU0QaagxkHuECvfoegQWp9spQtMV8XJGI"
    url = f"https://docs.google.com/spreadsheets/d/{uid}/export?format=csv"
    df = pd.read_csv(url) 

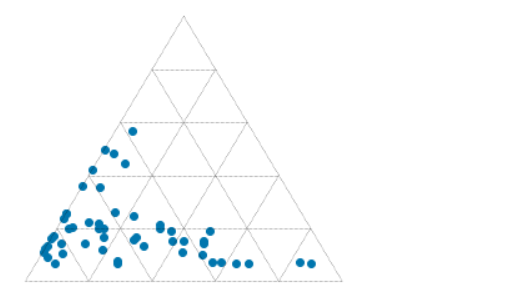
This dataset contains results from point-counting 51 shallow marine sandstones from the Eocene Sobrarbe Formation. We’re going to plot normalized volume percentages of quartz grains, detrital carbonate grains, and undifferentiated matrix. Three parameters? Two degrees of freedom? Let’s make a ternary plot!

Data exploration

Once you have the data in pandas, and before getting to the triangular stuff, we should have a look at it. Seaborn, a popular statistical plotting library, has a nifty ‘pairplot’ which plots the numerical parameters against each other to help reveal patterns in the data. On the diagonal, it shows kernel density estimations to reveal the distribution of each property:

    import seaborn as sns
    vars = ['Matrix', 'Quartz', 'Carbonate', 'Bioclasts', 'Authigenic']
    sns.pairplot(df, vars=vars, hue='Facies Association')
ternary_data_pairplot.png

Normalization is fairly straightforward. For each column, e.g. df['Carbonate'], we make a new column, e.g. df['C'], which is normalized to the sum of the three components, given by df[cols].sum(axis=1):

cols = ['Carbonate', 'Quartz', 'Matrix']
for col in cols:
    df[col[0]] = df[col] * 100 / df[cols].sum(axis=1)

The ternary plot

For the ternary plot itself I’m using the python-ternary library, which is pretty hands-on in that most plots take quite a bit of code. But the upside of this is that you can do almost anything you want. (Theres one other option for Python, the ever-reliable plotly, and there’s a solid-looking package for R too in ggtern.)

We just need a few lines of plotting code (left) to pull a ternary diagram (right) together.

    fig, tax = ternary.figure(scale=100)
    fig.set_size_inches(5, 4.5)

    tax.scatter(df[['M', 'Q', 'C']].values)
    tax.gridlines(multiple=20)
    tax.get_axes().axis('off')
ternary_tiny.png

But here you see what I mean about this being quite a low-level library: each element of the plot has to be added explicitly. So if we want axis labels, titles, and other annotations, we need more code… all of which is laid out in the accompanying notebook. You can download this from GitHub, or run it right now, right in your browser, with these links:

Binder   Run the accompanying notebook in MyBinder

Open In Colab   Run the notebook in Google Colaboratory (note you need to install python-ternary)

Give it a go, and have fun making your own ternary plots in Python! Share them on LinkedIn or Twitter.

Quartz, carbonate and matrix quantities (normalized to 100%) for 51 calcareous sandstones from the Eocene Sobrarbe Formation. The ternary plot was made with python-ternary library for Python and matplotlib.

Quartz, carbonate and matrix quantities (normalized to 100%) for 51 calcareous sandstones from the Eocene Sobrarbe Formation. The ternary plot was made with python-ternary library for Python and matplotlib.

Closing the analytics–domain gap

I recently figured out where Agile lives. Or at least where we strive to live. We live on the isthmus — the thin sliver of land — between the world of data science and the domain of the subsurface.

We’re not alone. A growing number of others live there with us. There’s an encampment; I wrote about it earlier this week.

Backman’s Island, one of my favourite kayaking destinations, is a passable metaphor for the relationship between machine learning and our scientific domain.

Backman’s Island, one of my favourite kayaking destinations, is a passable metaphor for the relationship between machine learning and our scientific domain.

Closing the gap in your organization

In some organizations, there is barely a connection. Maybe a few rocks at low tide, so you can hop from one to the other. But when we look more closely we find that the mysterious and/or glamorous data science team, and the stories that come out of it, seem distinctly at odds with the daily reality of the subsurface professionals. The VP talks about a data-driven business, deep learning, and 98% accuracy (whatever that means), while the geoscientists and engineers battle with raster logs, giant spreadsheets, and trying to get their data from Petrel into ArcGIS (or, help us all, PowerPoint) so they can just get on with their day.

We’re not going to learn anything from those organizations, except maybe marketing skills.

We can learn, however, from the handful of organizations, or parts of them, that are serious about not only closing the gap, but building new paths, and infrastructure, and new communities out there in the middle. If you’re in a big company, they almost certainly exist somewhere in the building — probably keeping their heads down because they are so productive and don’t want anyone messing with what they’ve achieved.

Here are some of the things they are doing:

  • Blending data science teams into asset teams, sitting machine learning specialists with subsurface scientists and engineers. Don’t make the same mistake with machine learning that our industry made with innovation — giving it to a VP and trying to bottle it. Instead, treat it like Marmite: spread it very thinly on everything.*

  • Treating software like knowledge sharing. Code is, hands down, the best way to share knowledge: it’s unambiguous, tested (we hope anyway), and — above all — you can actually use it. Best practice documents are I’m afraid, not worth the paper they would be printed on if anyone even knew how to find them.

  • Learning to code. OK, I’m biased because we train people… but it seriously works. When you have 300 geoscientists in your organization that embrace computational thinking, that can write a function in Python, that know what a support vector machine is for — that changes things. It changes every conversation.

  • Providing infrastructure for digital science. Once you have people with skills, you need people with powers. The power to install software, instantiate a virtual machine, or recruit a coder. You need people with tools, like version control, continuous integration, and communities of practice.

  • Realizing that they need to look in new places. Those much-hyped conversations everyone is having with Google or Amazon are, admittedly, pretty cool to see in the extractive industries (though if you really want to live on the cutting edge of geospatial analytics, you should probably be talking to Uber). You will find more hope and joy in Kaggle, Stack Overflow, and any given hackathon than you will in any of the places you’ve been looking for ‘innovation’ for the last 20 years.

This machine learning bandwagon we’re on is not about being cool, or giving keynotes, or saying ‘deep learning’ and ‘we’re working with Google’ all the time. It’s about equipping subsurface professionals to make better and safer scientific, industrial, and business decisions with more evidence and more certainty.

And that means getting serious about closing that gap.


I thought about this gap, and Agile’s place in it — along with the several hundred other digital subsurface scientists in the world — after drawing an attempt at drawing the ‘big picture’ of data science on one of our courses recently. Here’s a rendering of that drawing, without further comment. It didn’t quite fit with my ‘sliver of land’ analogy somehow…

On the left, the world of ‘advanced analytics’, on the right, how the disciplines of data science and earth science overlap on and intersect the computational world. We live in the green belt. (yes, we could argue for hours about these terms, but le…

On the left, the world of ‘advanced analytics’, on the right, how the disciplines of data science and earth science overlap on and intersect the computational world. We live in the green belt. (yes, we could argue for hours about these terms, but let’s not.)


* If you don’t know what Marmite is, it’s not too late to catch up.

The digital subsurface water-cooler

swung_round_orange.png

Back in August 2016 I told you about the Software Underground, an informal, grass-roots community of people who are into rocks and computers. At its heart is a public Slack group (Slack is a bit like Yammer or Skype but much more awesome). At the time, the Underground had 130 members. This morning, we hit ten times that number: there are now 1300 enthusiasts in the Underground!

If you’re one of them, you already know that it’s easily the best place there is to find and chat to people who are involved in researching and applying machine learning in the subsurface — in geoscience, reservoir engineering, and enything else to do with the hard parts of the earth. And it’s not just about AI… it’s about data management, visualization, Python, and web applications. Here are some things that have been shared in the last 7 days:

  • News about the upcoming Software Underground hackathon in London.

  • A new Udacity course on TensorFlow.

  • Questions to ask when reviewing machine learning projects.

  • A Dockerfile to make installing Seismic Unix a snap.

  • Mark Zoback’s new geomechanics course.

It gets better. One of the most interesting conversations recently has been about starting a new online-only, open-access journal for the geeky side of geo. Look for the #journal channel.

Another emerging feature is the ‘real life’ meetup. Several social+science gatherings have happened recently in Aberdeen, Houston, and Calgary… and more are planned, check #meetups for details. If you’d like to organize a meetup where you live, Software Underground will support it financially.

softwareunderground_merch.png

We’ve also gained a website, softwareunderground.org, where you’ll find a link to sign-up in the Slack group, some recommended reading, and fantastic Software Underground T-shirts and mugs! There are also other ways to support the community with a subscription or sponsorship.

If you’ve been looking for the geeks, data-heads, coders and makers in geoscience and engineering, you’ve found them. It’s free to sign up — I hope we see you in there soon!


Slack has nice desktop, web and mobile clients. Check out all the channels — they are listed on the left:

swung_convo.png

x lines of Python: Gridding map data

Difficulty rating: moderate.

Welcome to the latest in the X lines of Python series. You probably thought it had died, gawn to ‘eaven, was an x-series. Well, it’s back!

Today we’re going to fit a regularly sampled surface — a grid — to an irregular set of points in (x, y) space. The points represent porosity, measured in volume percent.

Here’s what we’re going to do; it all comes to only 9 lines of code!

  1. Load the data from a text file (needs 1 line of code).

  2. Compute the extents and then the coordinates of the new grid (2 lines).

  3. Make a radial basis function interpolator using SciPy (1 line).

  4. Perform the interpolation (1 line).

  5. Make a plot (4 lines).

As usual, there’s a Jupyter Notebook accompanying this blog post, and you can run it right now without installing anything.


Binder Run the accompanying notebook in MyBinder

Open In Colab Run the notebook in Google Colaboratory

Just the juicy bits

The notebook goes over the workflow in a bit more detail — with more plots and a few different ways of doing the interpolation. For example, we try out triangulation and demonstrate using scikit-learn’s Gaussian process model to show how we might use kriging (turns out kriging was machine learning all along!).

If you don’t have time for all that, and just want the meat of the notebook, here it is:

 
import numpy as np
import pandas as pd
import matplotlib.pyplot as plt
from scipy.interpolate import Rbf

# Load the data.
df = pd.read_csv('../data/ZoneA.dat',
                 sep=' ',
                 header=9,
                 usecols=[0, 1, 2, 3],
                 names=['x', 'y', 'thick', 'por']
                )

# Build a regular grid with 500-metre cells.
extent = x_min, x_max, y_min, y_max = [df.x.min()-1000, df.x.max()+1000,
                                       df.y.min()-1000, df.y.max()+1000]
grid_x, grid_y = np.mgrid[x_min:x_max:500, y_min:y_max:500]

# Make the interpolator and do the interpolation.
rbfi = Rbf(df.x, df.y, df.por)
di = rbfi(grid_x, grid_y)

# Make the plot.
plt.figure(figsize=(15, 15))
plt.imshow(di.T, origin="lower", extent=extent)
cb = plt.scatter(df.x, df.y, s=60, c=df.por, edgecolor='#ffffff66')
plt.colorbar(cb, shrink=0.67)
plt.show()

This results in the following plot, in which the points are the original data, plotted with the same colourmap as the surface itself (so they should be the same colour, more or less, as their background).

rbf_interpolation.png

The venue for TRANSFORM

Last time I told you a bit about what to expect at the TRANSFORM unconference we’re hosting in May. But I haven’t really told you about the venue yet, and it’s one of the best bits.

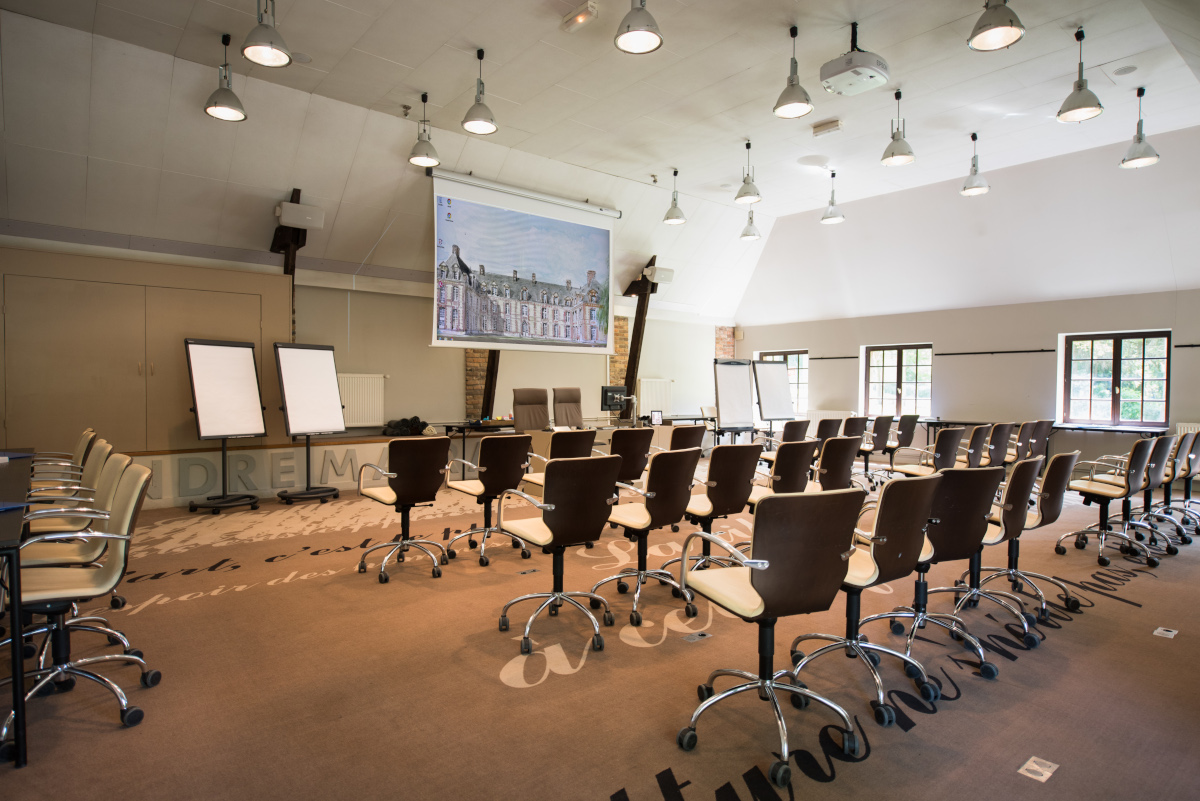
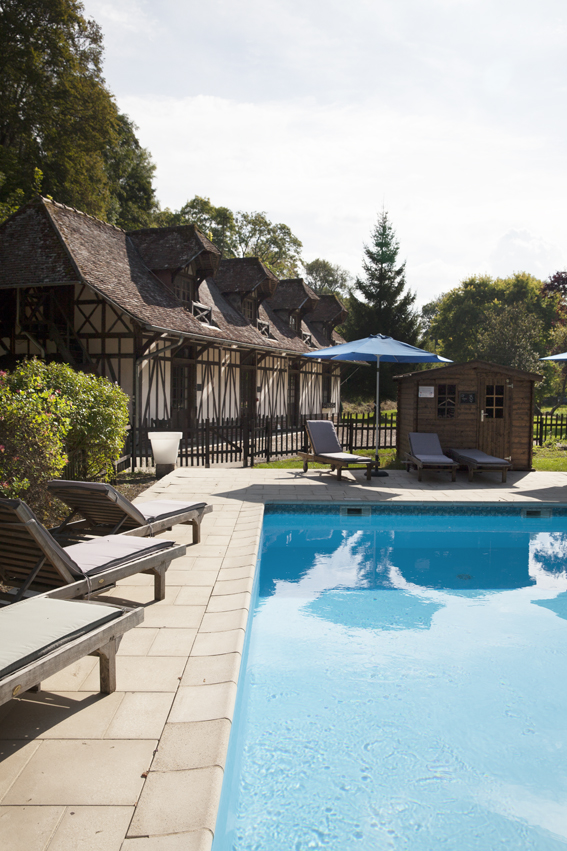
We’re hosting the event at the Château de Rosay, near Rouen in France. This is a large house in a small village. It is completely self-contained: we can sleep there, eat there, work there, relax there. There’s room for about 45 people or so. The place looks spectacular:

A few people have said to me that they don’t feel like they could contribute much to a conversation about open source subsurface software… but this unconference is absolutely for anyone. If you are doing science or engineering underground, and if you are interested in the technology we use to do this, you can contribute.

Some of the things we’ll be talking about:

  • Which open tools exist, and can any of them be rescued from disuse?

  • Who is developing these tools and what kind of support do they need?

  • How can we make it easier for anybody to contribute to these projects?

  • What can we do right now that will improve the open stack the most?

All the place needs is a few subsurface scientists and engineers with latops, then it’s perfect! I hope you can join us there.

CdR-Taille_ori-WIDE.jpg

TRANSFORM 2019

A new unconference about subsurface software

What's happening at TRANSFORM?

Last week, I laid out the case for naming and focusing on an open subsurface stack. To this end, we’re hosting TRANSFORM, an unconference, in May. At TRANSFORM, we’ll be mapping out the present state of things, imagining the future, and starting to build it together. You’re invited.

This week, I want to tell you a bit more about what’s happening at the unconference.

BYOS: Bring Your Own Session

We’ll be using an unconference model. If you come to the event, I ask you to prepare a 45 to 60 minute ‘slot’. You can do whatever you like in your slot, the only requirements are that it’s somewhat aligned with the theme (rocks, computers, and openness), and that it produces something tangible. For example:

  • Start with a short presentation, maybe two, then hold a discussion. Capture the debate.

  • Hold a brainstorming session, generating ideas for new technology. Record the ideas.

  • Host a short sprint around a piece of existing software, checking code into GitHub.

  • Research the available open tools for a particular workflow or file type. Report back.

Really, anything is possible. There’s no need to propose topics ahead of time (but please feel free to discuss them in the #transform channel on the Software Underground). We’ll be gathering all the topics and organizing the schedule for Monday, Tuesday and Wednesday on Sunday evening and Monday morning. It’s just-in-time conferencing!

After the unconference, then the sprints

By the end of Wednesday, we should have a very good idea of what’s in the open subsurface stack, and what is missing. On Thursday and Friday, we’ll have the opportunity to build things. In small team, we can take on all sorts of things:

  • Improving the documentation of a project.

  • Writing tutorials or course material for existing tools.

  • Writing tests for an old or new project.

  • Adding functionality to an old project, or even starting a new project.

By the end of Friday, we should have a big pile of new stuff to play with, and lots of new threads to follow after the event.

Here’s a first-draft, high-level view of the schedule so far…

Transform_schedule_prelim.png

The open subsurface stack

Two observations:

  1. Agile has been writing about open source software for geology and geophysics for several years now (for example here in 2011 and here in 2016). Progress is slow. There are lots of useful tools, but lots of gaps too. Some new tools have appeared, others have died. Conclusion: a robust and trusted open stack is not going to magically appear.

  2. People — some of them representing large corporations — are talking more than ever about industry collaboration. Open data platofrms are appearing all over the place. And several times at the DigEx conference in Oslo last week I heard people talk about open source and open APIs. Some organizations, notably Equinor, seem to really mean business. Conclusion: there seems to be a renewed appetite for open source subsurface software.

A quick reminder of what ‘open’ means; paraphrasing The Open Definition and The Open Source Definition in a sentence:

Open data, content and code can be freely used, modified, and shared by anyone for any purpose.

The word ‘open’ is being punted around quite a bit recently, but you have to read the small print in our business. Just as OpenWorks is not ‘open’ by the definition above, neither is OpenSpirit (remember that?), nor the Open Earth Community. (I’m not trying to pick on Halliburton but the company does seem drawn to the word, despite clearly not quite understanding it.)

The conditions are perfect

Earlier I said that a robust and trusted ‘stack’ (a collection of software that, ideally, does all the things we need) is not going to magically appear. What do I mean by ‘robust and trusted’? It goes far beyond ‘just code’ — writing code is the easy bit. It means thoroughly tested, carefully documented, supported, and maintained. All that stuff takes work, and work takes people and time. And people and time mean money.

Two more observations:

  1. Agile has been teaching geocomputing like crazy — 377 people in the last year. In our class, the participants install a lot of Python libraries, including a few from the open subsurface stack: segyio, lasio, welly, and bruges. Conclusion: a proto-stack exists already, hundreds of users exist already, and some training and support exist already.

  2. The Software Underground has over 1200 members (you should sign up, it’s free!). That’s a lot of people that care passionately about computers and rocks. The Python and machine learning communies are especially active. Conclusion: we have a community of talented scientists and developers that want to get good science done.

So what’s missing? What’s stopping us from taking open source subsurface tech to the next level?

Nothing!

Nothing is stopping us. And I’ve reached the conclusion that we need to provide care and feeding to this proto-stack, and this needs to start now. This is what the TRANSFORM 2019 unconference is going to be about. About 40 of us (you’re invited!) will spend five days working on some key questions:

  • What libraries are in the Python ‘proto-stack’? What kind of licenses do they have? Who are the maintainers?

  • Do we need a core library for the stack? Something to manage some basic data structures, units of measure, etc.

  • What are we calling it, who cares about it, and how are we going to work together?

  • Who has the capacity to provide attention, developer time, existing code, or funds to the stack?

  • Where are the gaps in the stack, and which ones need to be filled first?

We won’t finish all this at the unconference. But we’ll get started. We’ll produce a lot of ideas, plans, roadmaps, GitHub issues, and new code. If that sounds like fun to you, and you can contribute something to this work — please come. We need you there! Get more info and sign up here.


Read the follow-up post >>> What’s happening at TRANSFORM?


Thumbnail photo of the Old Man of Hoy by Tom Bastin, CC-BY on Flickr.

What is the fastest axis of an array?

One of the participants in our geocomputing course asked us a tricky question earlier this year. She was a C++ and Java programmer — we often teach experienced programmers who want to learn about Python and/or machine learning — and she worked mostly with seismic data. She had a question related to the performance of n-dimensional arrays: what is the fastest axis of a NumPy array?

I’ve written before about how computational geoscience is not ‘software engineering’ and not ‘computer science’, but something else. And there’s a well established principle in programming, first expressed by Michael Jackson:

We follow two rules in the matter of optimization:
Rule 1: Don’t do it.
Rule 2 (for experts only). Don’t do it yet — that is, not until you have a perfectly clear and unoptimized solution.

Most of the time the computer is much faster than we need it to be, so we don’t spend too much time thinking about making our programs faster. We’re mostly concerned with making them work, then making them correct. But sometimes we have to think about speed. And sometimes that means writing smarter code. (Other times it means buying another GPU.) If your computer spends its days looping over seismic volumes extracting slices for processing, you should probably know whether you want to put time in the first dimension or the last dimension of your array.

The 2D case

Let’s think about a two-dimensional case first — imagine a small 2D array, also known as a matrix in some contexts. I’ve coloured in the elements of the matrix to make the next bit easier to understand.

matrix-memory-a.png

When we store a matrix in a computer (or an image, or any array), we have a decision to make. In simple terms, the computer’s memory is like a long row of boxes, each with a unique address — shown here as a 3-digit hexadecimal number:

We can only store one number in each box, so we’re going to have to flatten the 2D array. The question is, do we put the rows in together, effectively splitting up the columns, or do we put the columns in together? These two options are commonly known as ‘row major’, or C-style, and ‘column major’, or Fortran-style:

matrix-memory-b.png

Let’s see what this looks like in terms of the indices of the elements. We can plot the index number on each axis vs. the position of the element in memory. Notice that the C-ordered elements are contiguous in axis 0:

If you spend a lot of time loading seismic data, you probably recognize this issue — it’s analgous to how traces are stored in a SEG-Y file. Of couse, with seismic data, two dimensions aren’t always enough…

Higher dimensions

The problem multiplies at higher dimensions. If we have a cube of data, then C-style ordering results in the first dimension having large contiguous chunks, and the last dimension being broken up. The middle dimension is somewhere in between. As before, we can illustrating this by plotting the indices of the data. This time I’m highlighting the positions of the elements with index 2 (i.e. the third element) in each dimension:

So if this was a seismic volume, we might organize inlines in the first dimension, and travel-time in the last dimension. That way, we can access inlines very quickly, but timeslices will take longer.

In Fortran order, which we can optionally specify in NumPy, the situation is reversed. Now the fast axis is the last axis:

3d-array-forder.png

Lots of programming languages and libraries use row-major memory layout, including C, C++, Torch and NumPy. Most others use column-major ordering, including MATLAB, R, Julia, and Fortran. (Some other languages, such as Java and .NET, use a variant of row-major order called Iliffe vectors). NumPy calls row-major order ‘C’ (for C, not for column), and column-major ‘F’ for Fortran (thankfully they didn’t use R, for R not for row).

I expect it’s related to their heritage, but the Fortran-style languages also start counting at 1, whereas the C-style languages, including Python, start at 0.

What difference does it make?

The main practical difference is in the time it takes to access elements in different orientations. It’s faster for the computer to take a contiguous chunk of neighbours from the memory ‘boxes’ than it is to have to ‘stride’ across the memory taking elements from here and there.

How much faster? To find out, I made datasets full of random numbers, then selected slices and added 1 to them. This was the simplest operation I could think of that actually forces NumPy to do something with the data. Here are some statistics — the absolute times are pretty irrelevant as the data volumes I used are all different sizes, and the speeds will vary on different machines and architectures:

  • 2D data: 3.6× faster. Axis 0: 24.4 µs, axis 1: 88.1 µs (times relative to first axis: 1, 3.6).

  • 3D data: 43× faster. 229 µs, 714 µs, 9750 µs (relatively 1, 3.1, 43).

  • 4D data: 24× faster. 1.27 ms, 1.36 ms, 4.77 ms, 30 ms (relatively 1, 1.07, 3.75, 23.6).

  • 5D data: 20× faster. 3.02 ms, 3.07 ms, 5.42 ms, 11.1 ms, 61.3 ms (relatively 1, 1.02, 1.79, 3.67, 20.3).

  • 6D data: 5.5× faster. 24.4 ms, 23.9 ms, 24.1 ms, 37.8 ms, 55.3 ms, 136 ms (relatively 1, 0.98, 0.99, 1.55, 2.27, 5.57).

These figures are more or less simply reversed for Fortran-ordered arrays (see the notebook for datails).

Clearly, the biggest difference is with 3D data, so if you are manipulating seismic data a lot and need to access the data in that last dimension, usually travel-time, you might want to think about ways to reduce this overhead.

What difference does it really make?

The good news is that, for most of us most of the time, we don’t have to worry about any of this. For one thing, NumPy’s internal workings (in particular, its universal functions, or ufuncs) know which directions are fastest and take advantage of this when possible. For another thing, we generally try to avoid looping over arrays at all, leaving the iterative components of our algorithms to the ufuncs — so the slicing speed isn’t a factor. Even when it is a factor, or if we can’t avoid looping, it’s often not the bottleneck in the code. Usually the guts of our algorithm are what are slowing the computer down, not the access to memory. The net result of all this is that we don’t often have to think about the memory layout of our arrays.

So when does it matter? The following situations merit a bit of thought:

  • When you’re doing a very large number of accesses to memory or disk. Saving a few microseconds might add up to a lot if you’re doing it a billion times.

  • When the objects you’re accessing are very large. Reading and writing elements of a 200GB array in memory brings new challenges compared to handling a few gigabytes.

  • Reading and writing data files — really just another kind of memory — brings all the same issues. Reading a chunk of contiguous data is much faster than reading bytes from here and there. Landmark’s BRI seismic data format, Schlumberger’s ZGY files, and HDF5 files, all implement strategies to help make reading arbitrary data faster.

  • Converting code from other languages, especially MATLAB, although do realize that other languages may have their own indexing rules, as well as differing in how they store n-dimensional arrays.

If you determine that you do need to think about this stuff, then you’re going to need to read this essay about NumPy’s internal representations, and I recommend checking out this blog post by Eli Bendersky too.

There you have it. Very occasionally we scientists also need to think a bit about how computers work… but most of the time someone has done that thinking for us.

Some of the figures and all of the timings for this post came from this notebook — please have a look. If you have anything to add, or (better yet) correct, please get in touch. I’d love to hear from you.

2018 retrospective

It’s almost the end of another trip around the sun. I hope it’s been kind to you. I mean, I know it’s sometimes hard to see the kindness for all the nonsense and nefariousness in <ahem> certain parts of the world, but I hope 2018 at least didn’t poke its finger in your eye, or set fire to any of your belongings. If it did — may 2019 bring you some eye drops and a fire extinguisher.

Anyway, at this time of year, I like to take a quick look over my shoulder at the past 12 months. Since I’m the over-sharing type, I like to write down what I see and put it on the Internet. I apologize, and/or you’re welcome.

Top of the posts

We’ve been busier than ever this year, and the blog has taken a bit of a hit. In spite of the reduced activity (only 45 posts, compared to 53 last year), traffic continues to grow and currently averages 9000 unique visitors per month. These were the most visited posts in 2018:

Last December’s post, No more rainbows, got more traffic this year than any of these posts. And, yet again, k is for wavenumber got more than any. What is it with that post??

Where in the world?

Every year I take a look at where our people are reading the blog from (according to Google). We’ve travelled more than usual this year too, so I’ve added our various destinations to the map… it makes me realize we’re still missing most of you.

blog-map-2018.png
  1. Houston (number 1 last year)

  2. London (up from 3)

  3. Calgary (down from 2)

  4. Stavanger (6)

  5. Paris (9)

  6. New York (—)

  7. Perth (4)

  8. Bangalore (—)

  9. Jakarta (—)

  10. Kuala Lumpur (8)

Together these cities capture at least 15% of our readship. New York might be an anomaly related to the location of cloud infrastructure there. (Boardman, Oregon, shows up for the same reason.) But who knows what any of these numbers mean…

Work

People often ask us how we earn a living, and sometime I wonder myself. But not this year: there was a clear role for us to play in 2018 — training the next wave of digital scientists and engineers in subsurface.

Rob.jpeg
  • We continued the machine learning project on GPR interpretation that we started last year.

  • We revived Pick This and have it running on a private corporate cloud at a major oil company, as well as on the Internet.

  • We have spent 63 days in the classroom this year, and taught 325 geoscientists the fundamentals of Python and machine learning.

  • Apart from the 6 events of our own that we organized, we were involved in 3 other public hackathons and 2 in-house hackathons.

  • We hired awesome digital geologist Robert Leckenby (right) full time. 

The large number of people we’re training at the moment is especially exciting, because of what it means for the community. We spent 18 days in the classroom and trained 139 scientists in the previous four years combined — so it’s clear that digital geoscience is important to people today. I cannot wait to see what these new coders do in 2019 and beyond!

The hackathon trend is similar: we hosted 310 scientists and engineers this year, compared to 183 in the four years from 2013 to 2017. Numbers are only numbers of course, but the reality is that we’re seeing more mature projects, and more capable coders, at every event. I know it’s corny to say so, but I feel so lucky to be a scientist today, there is just so much to do.

Cheers to you

Agile is, as they say, only wee. And we all live in far-flung places. But the Intertubes are a marvellous thing, and every week we meet new people and have new conversations via this blog, and on Twitter, and the Software Underground. We love our community, and are grateful to be part of it. So thank you for seeking us out, cheering us on, hiring us, and just generally being a good sport about things.

From all of us at Agile, have a fantastic festive season — and may the new year bring you peace and happiness.

The London hackathon

At the end of November I reported on the projects at the Oil & Gas Authority’s machine learning hackathon in Aberdeen. This post is about the follow-up event at London Olympia.


Like the Aberdeen hackathon the previous weekend, the theme was ‘machine learning’. The event unfolded in the Apex Room at Olympia, during the weekend before the PETEX conference. The venue was excellent, with attentive staff and top-notch catering. Thank you to the PESGB for organizing that side of things.

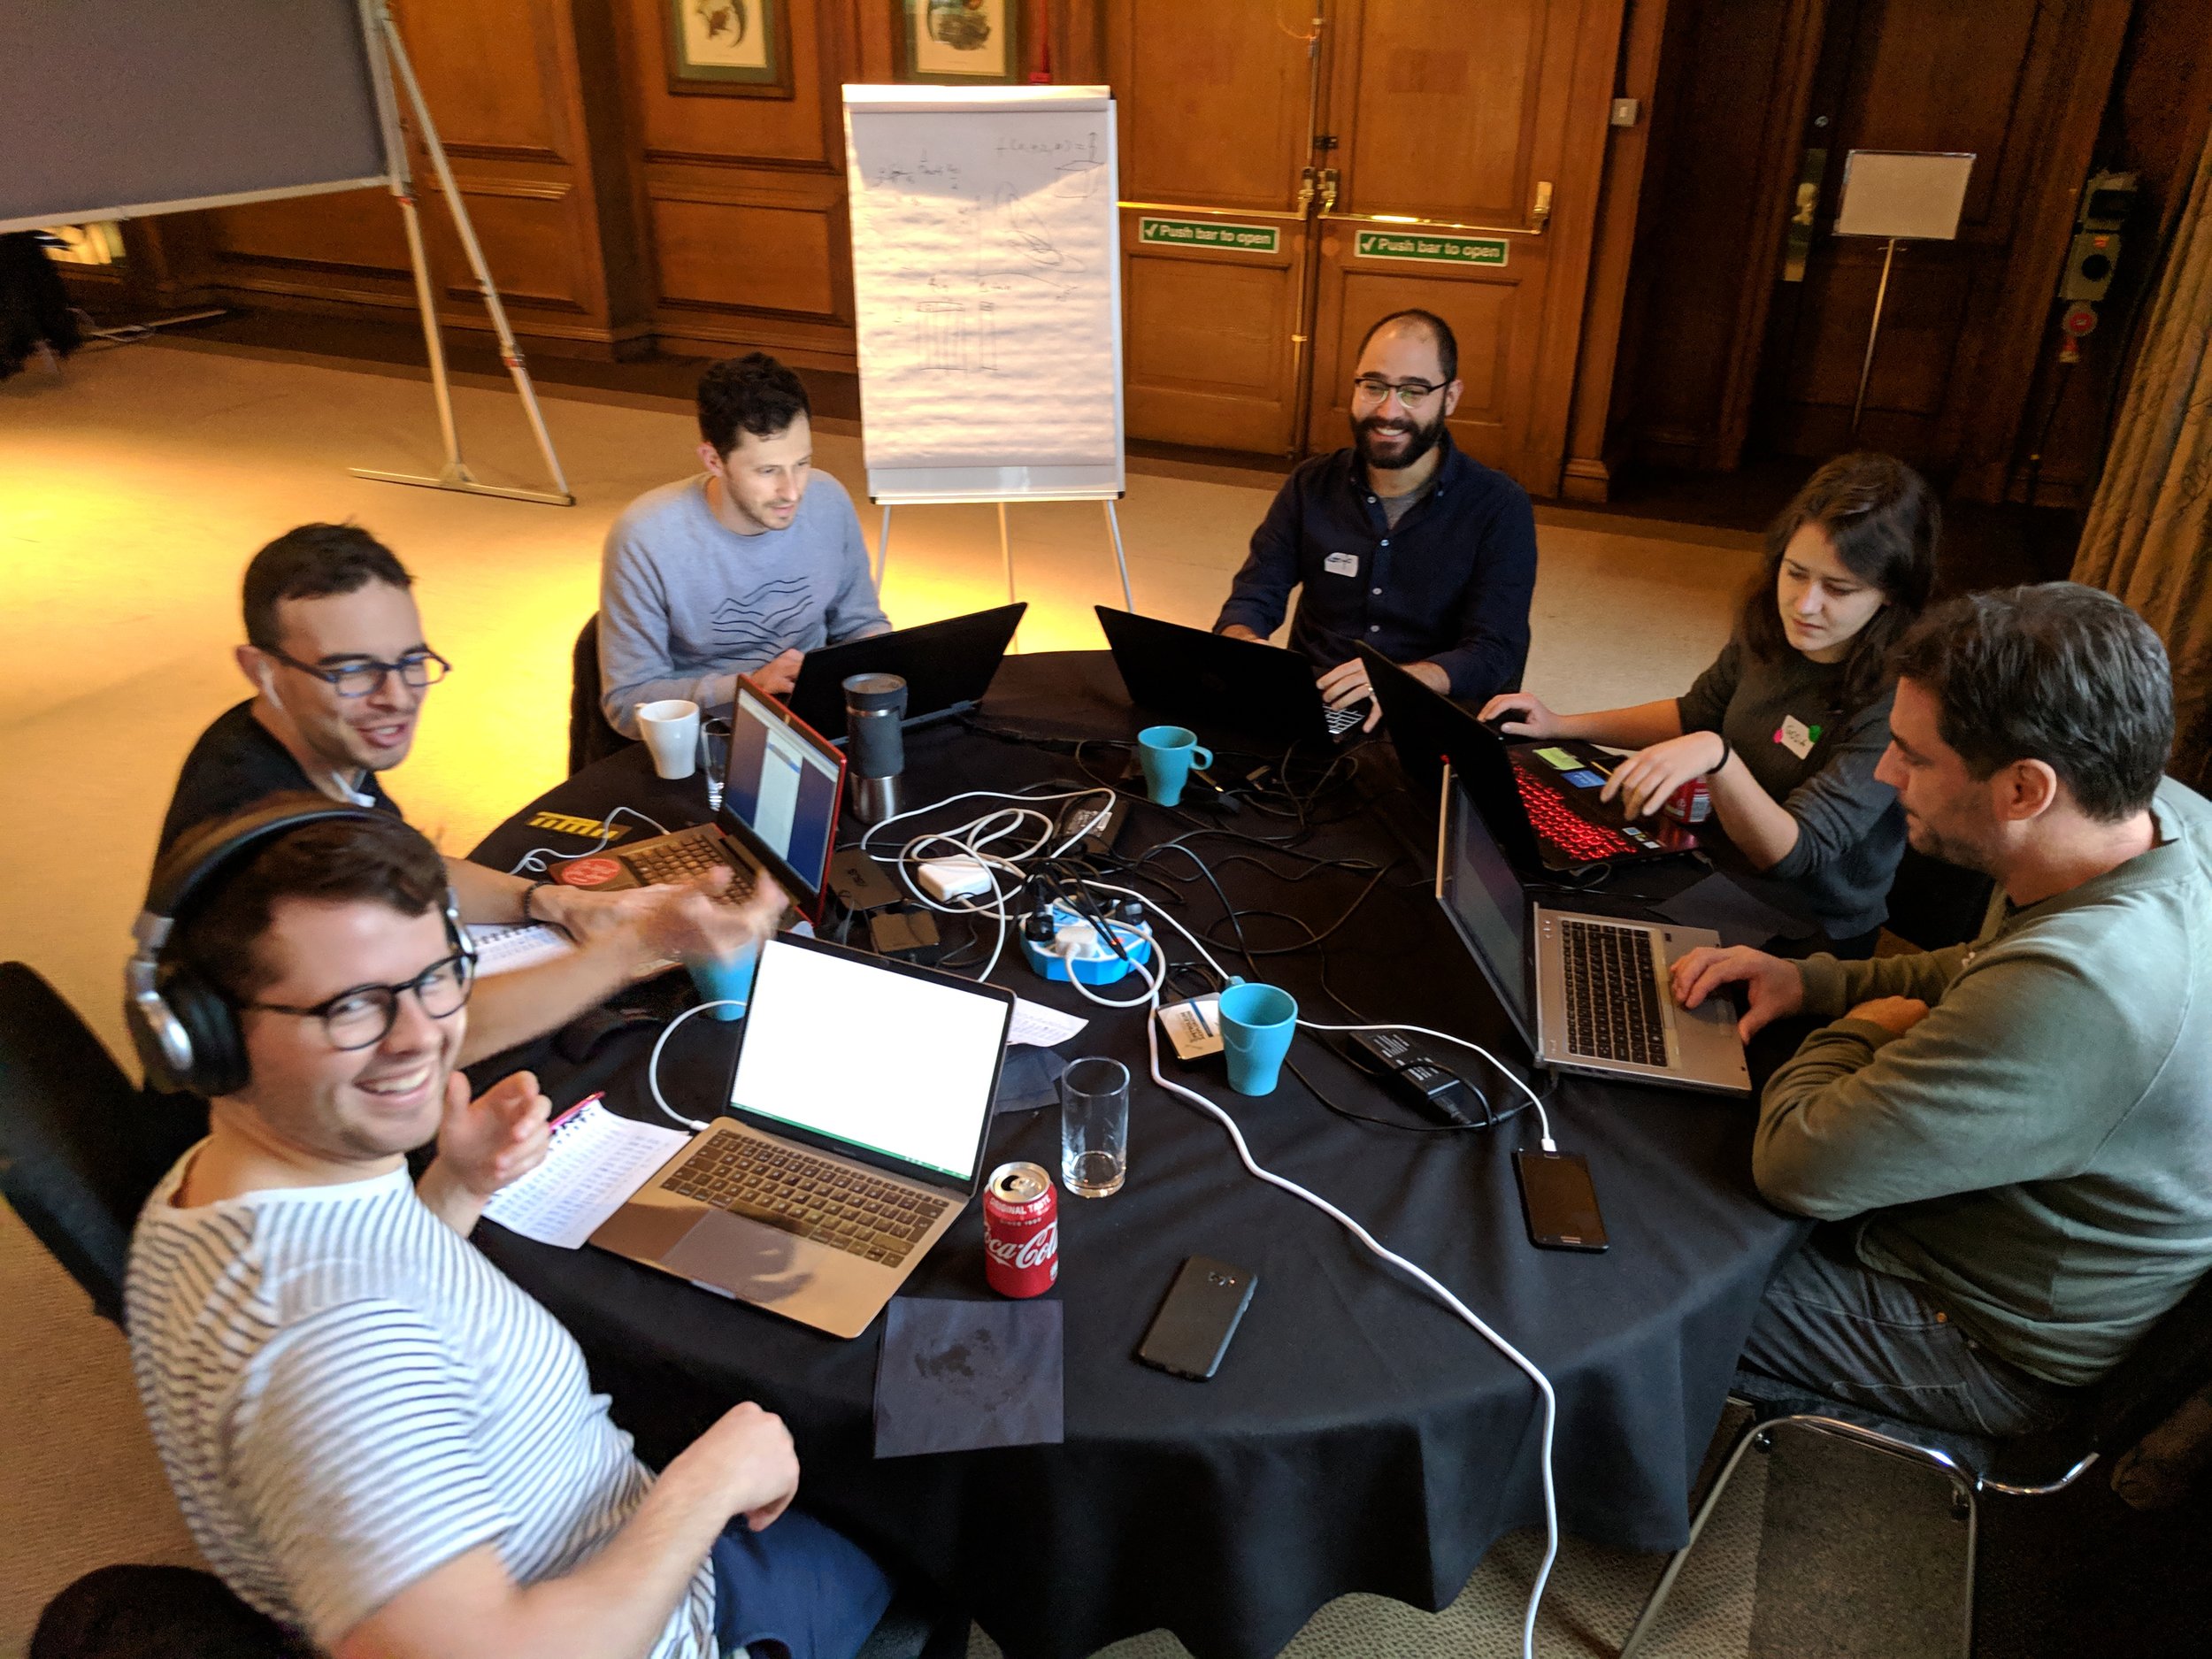
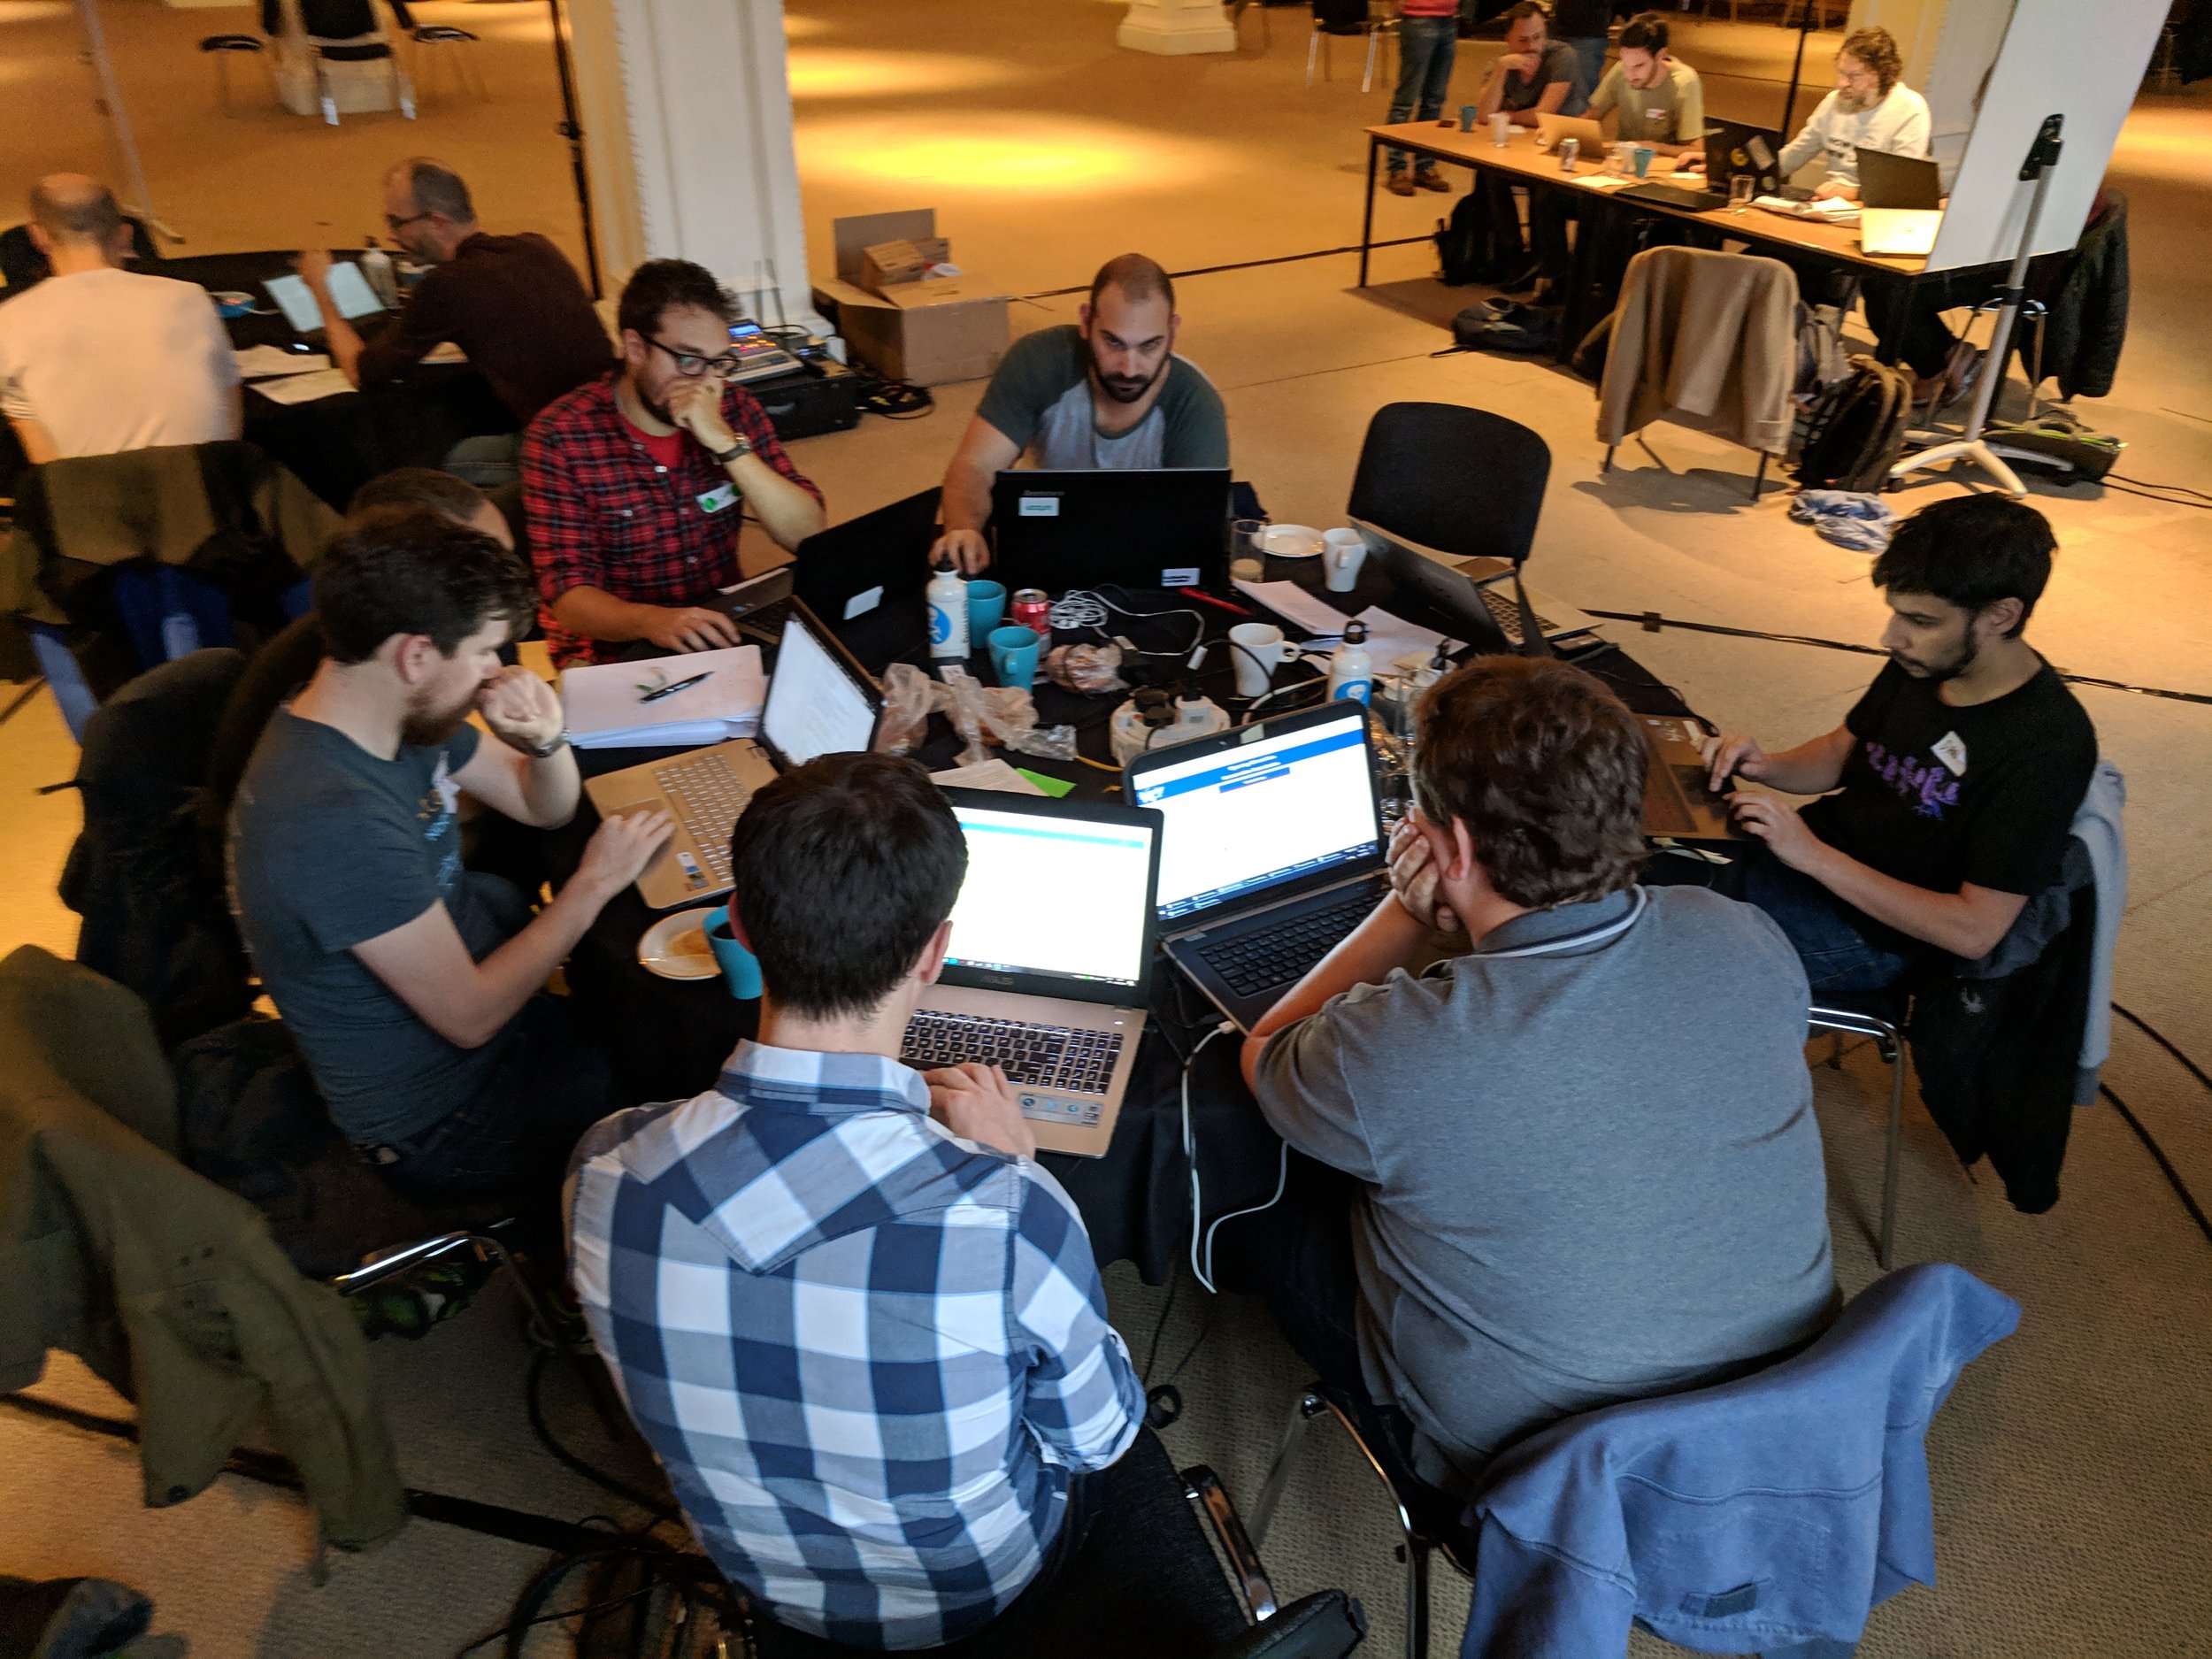
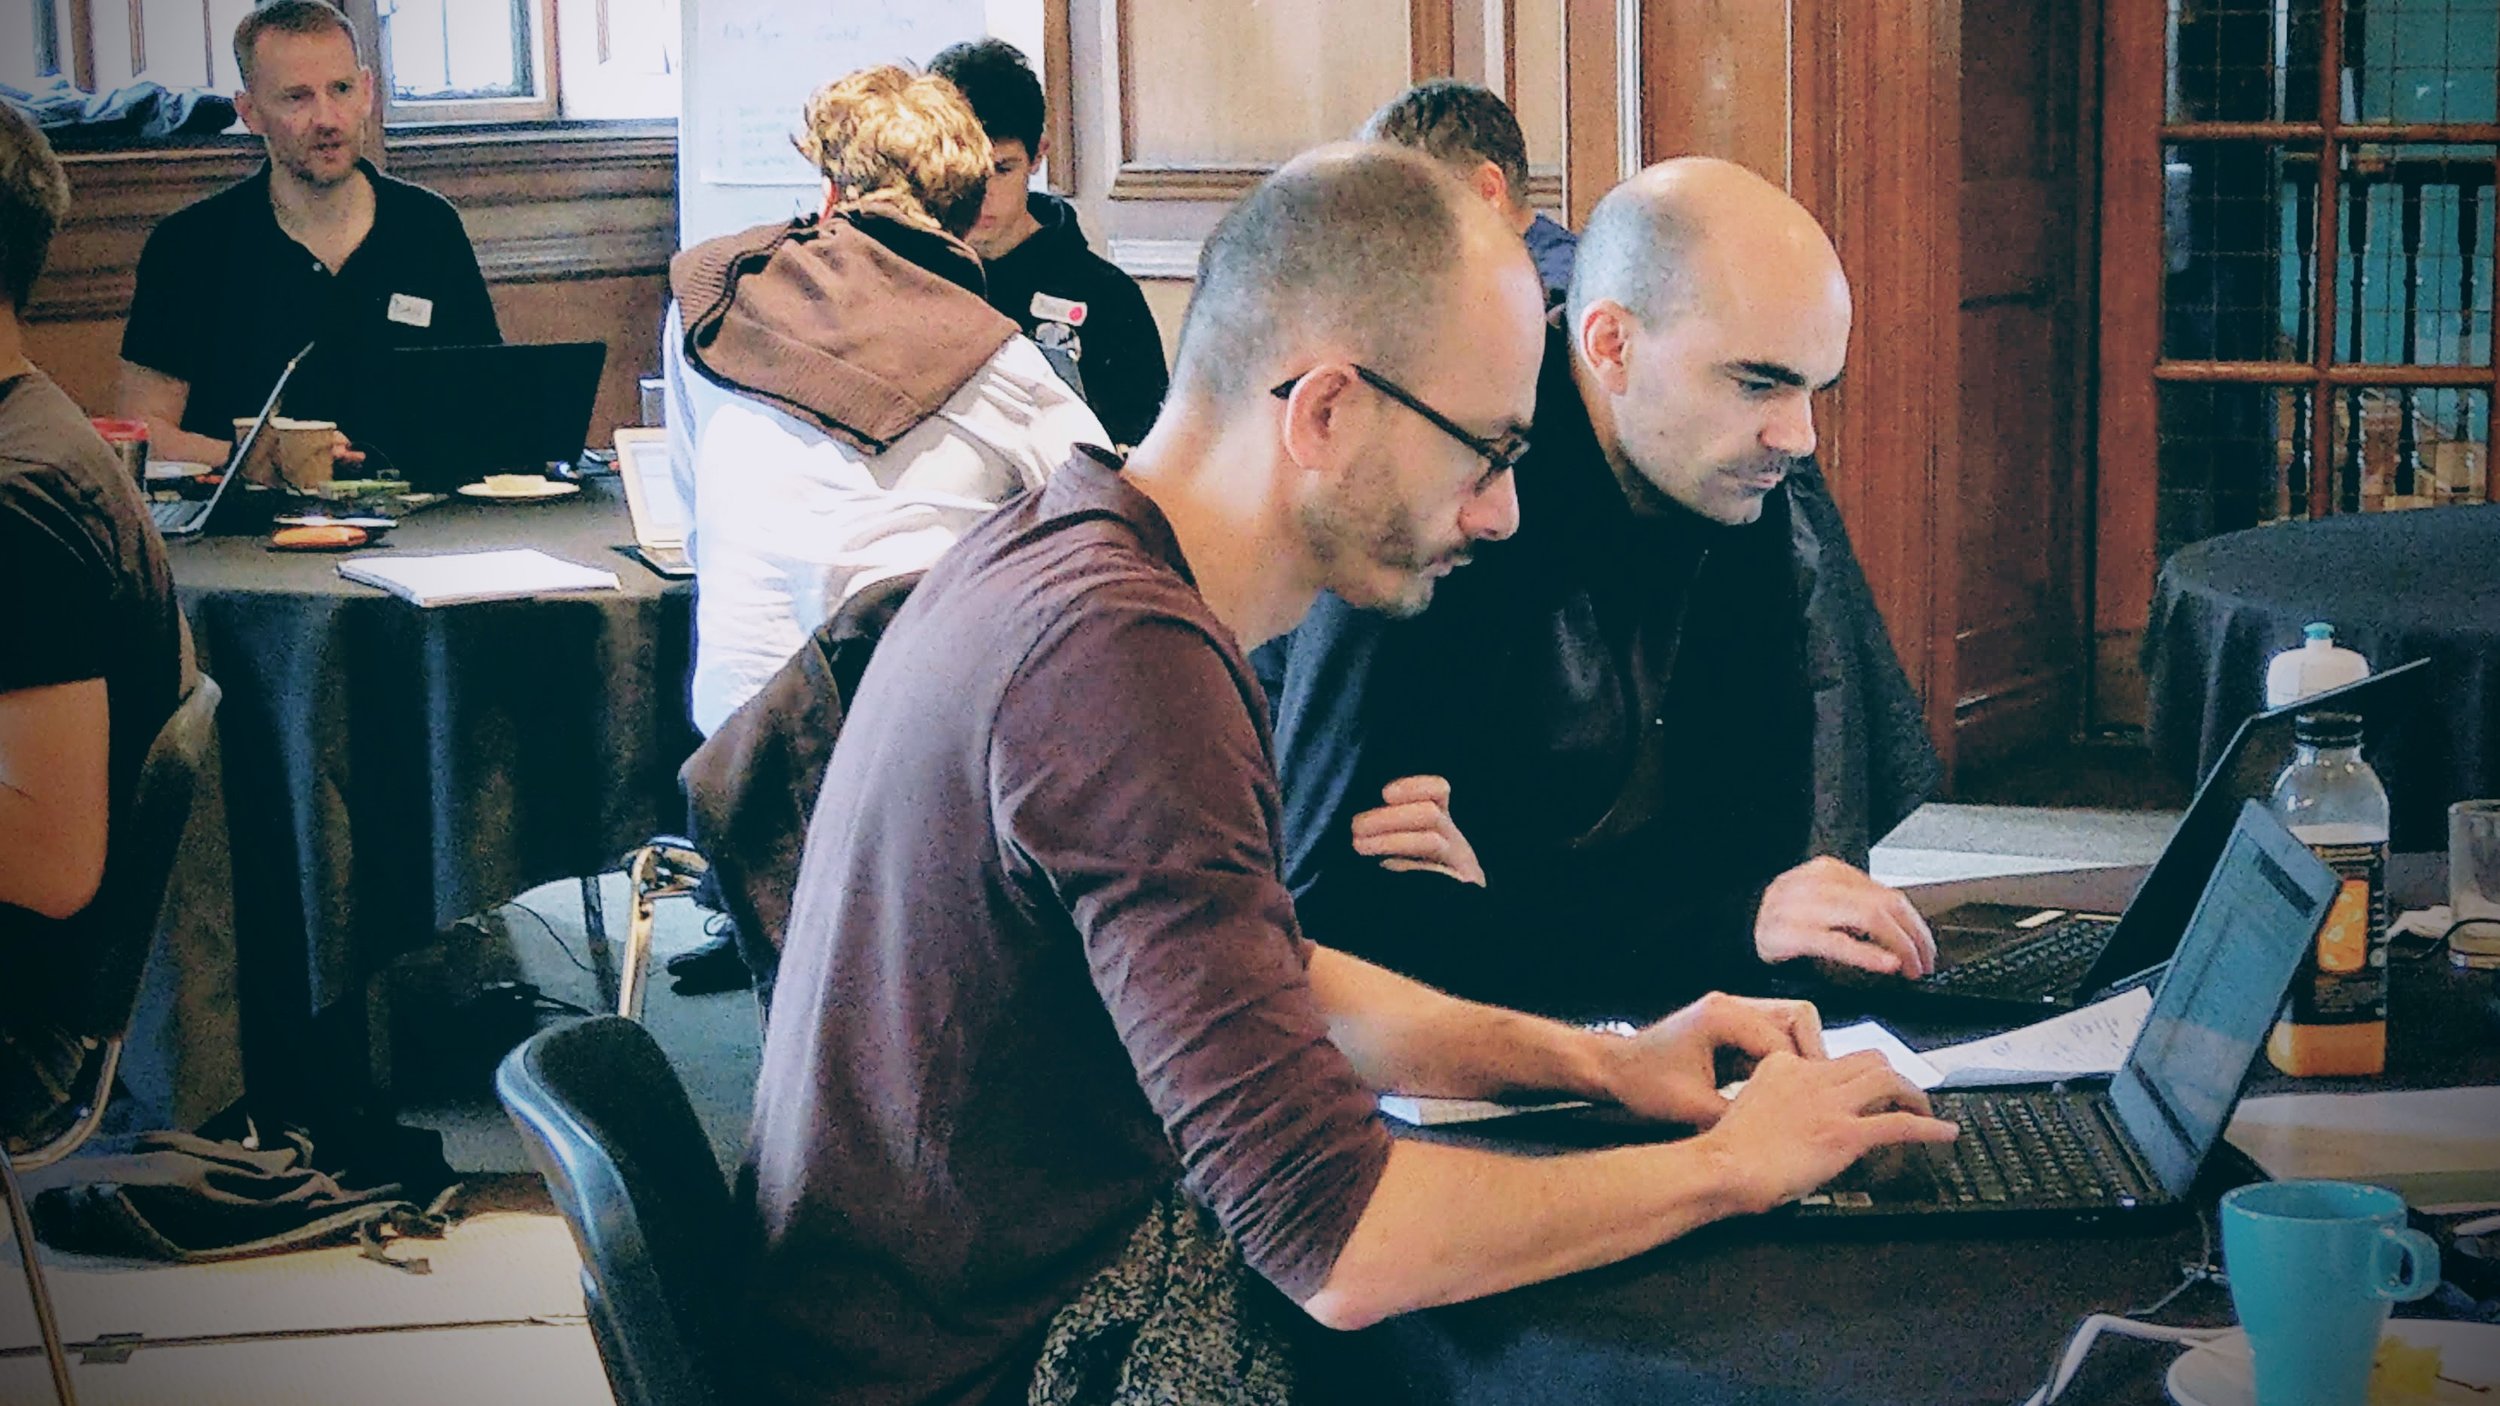
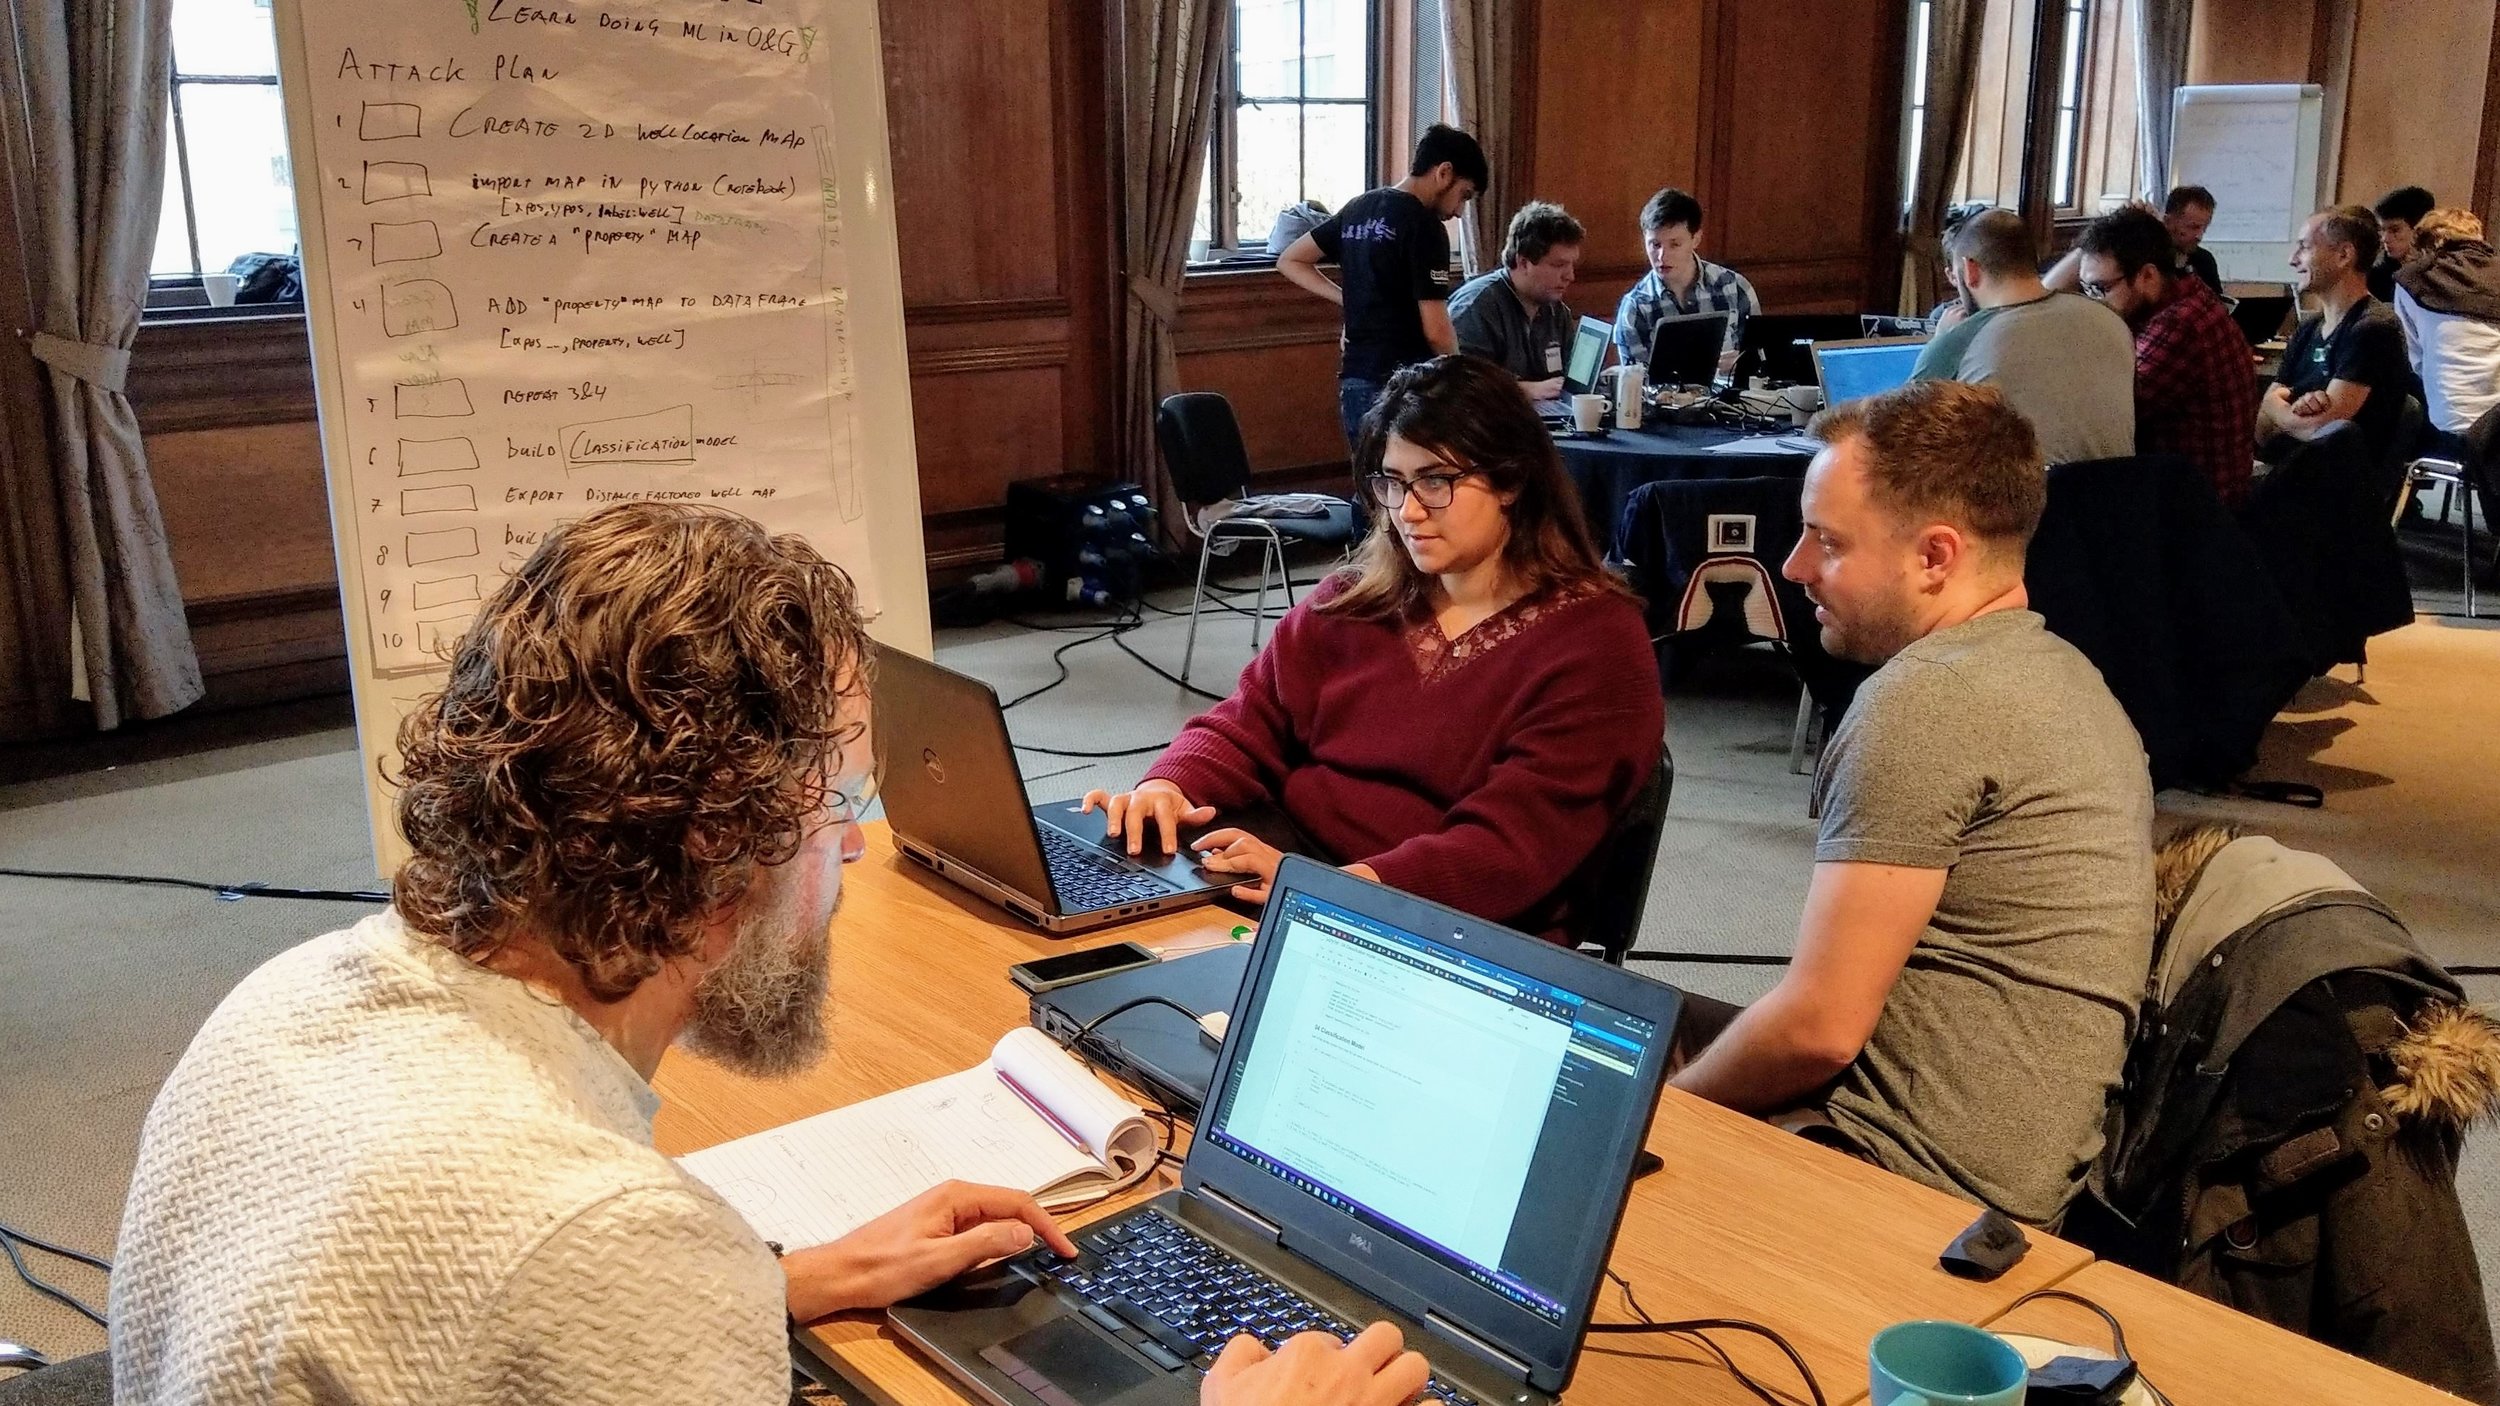
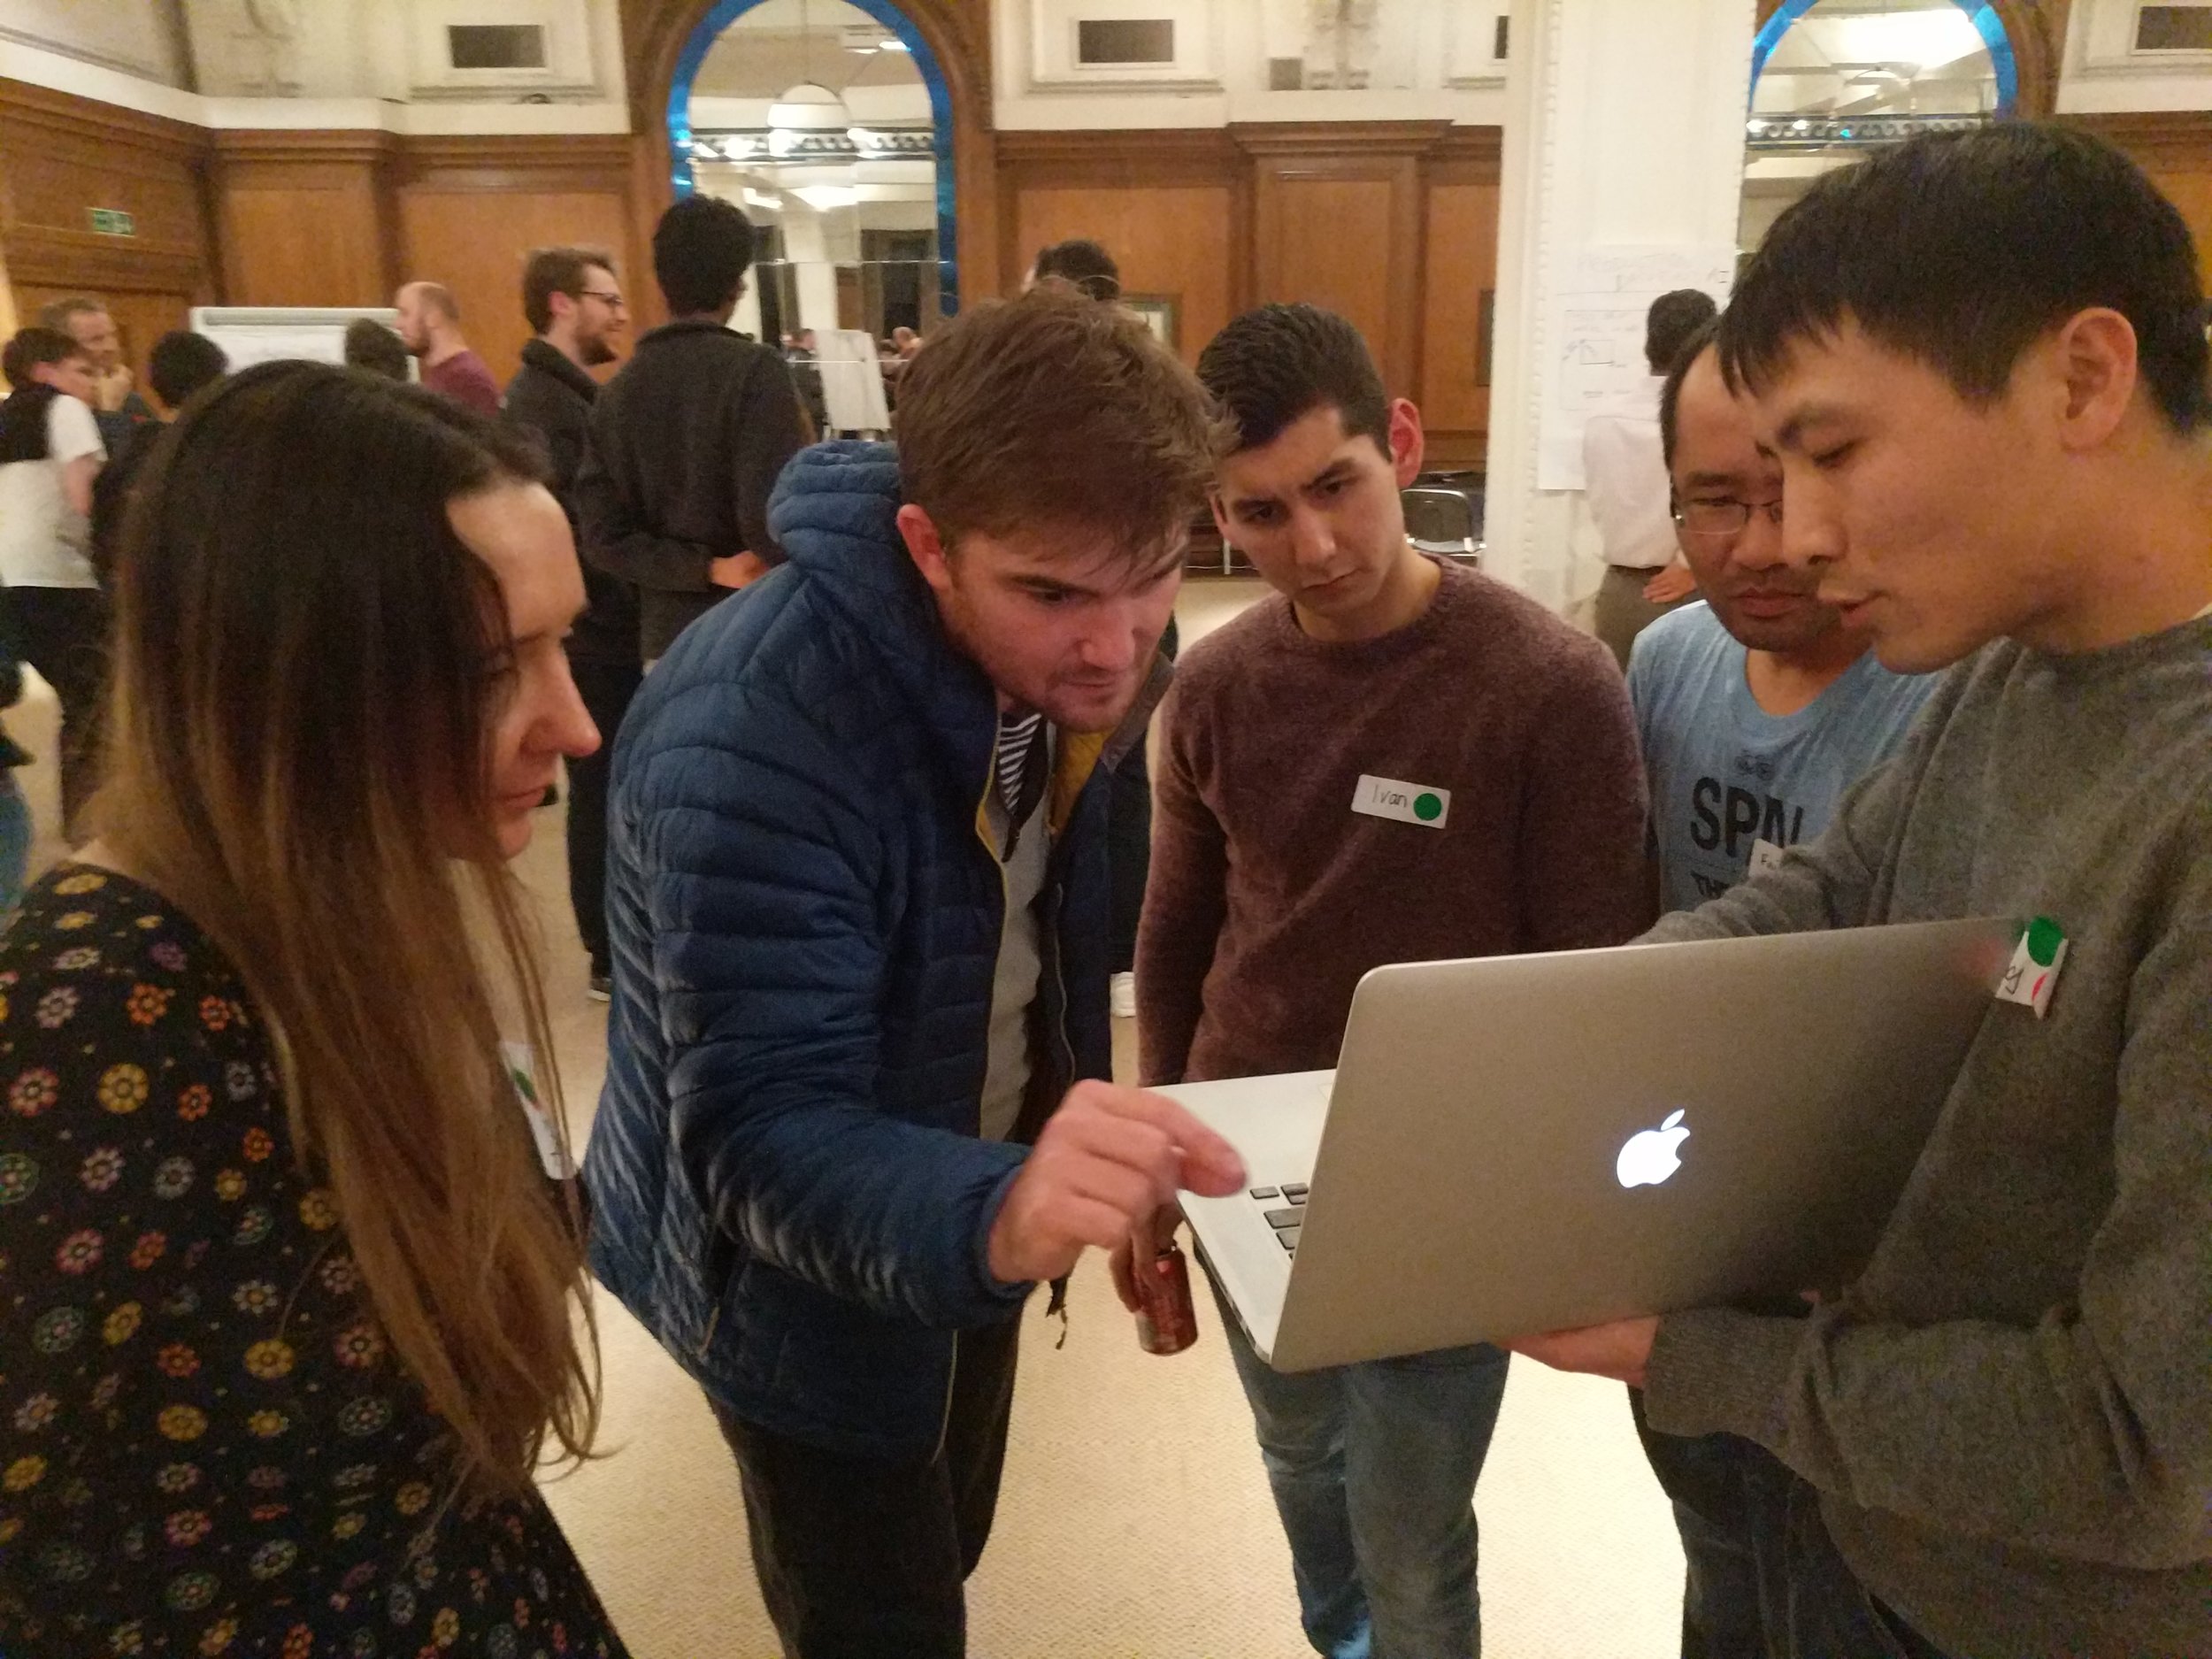
Thirty-eight digital geoscientists spent the weekend with us, and most of them also took advantage of the bootcamp on Friday; at least a dozen of those had not coded at all before the event. It’s such a privilege to work with people on their skills at these events, and to see them writing their own code over the weekend.

Here’s the full list of projects from the event…


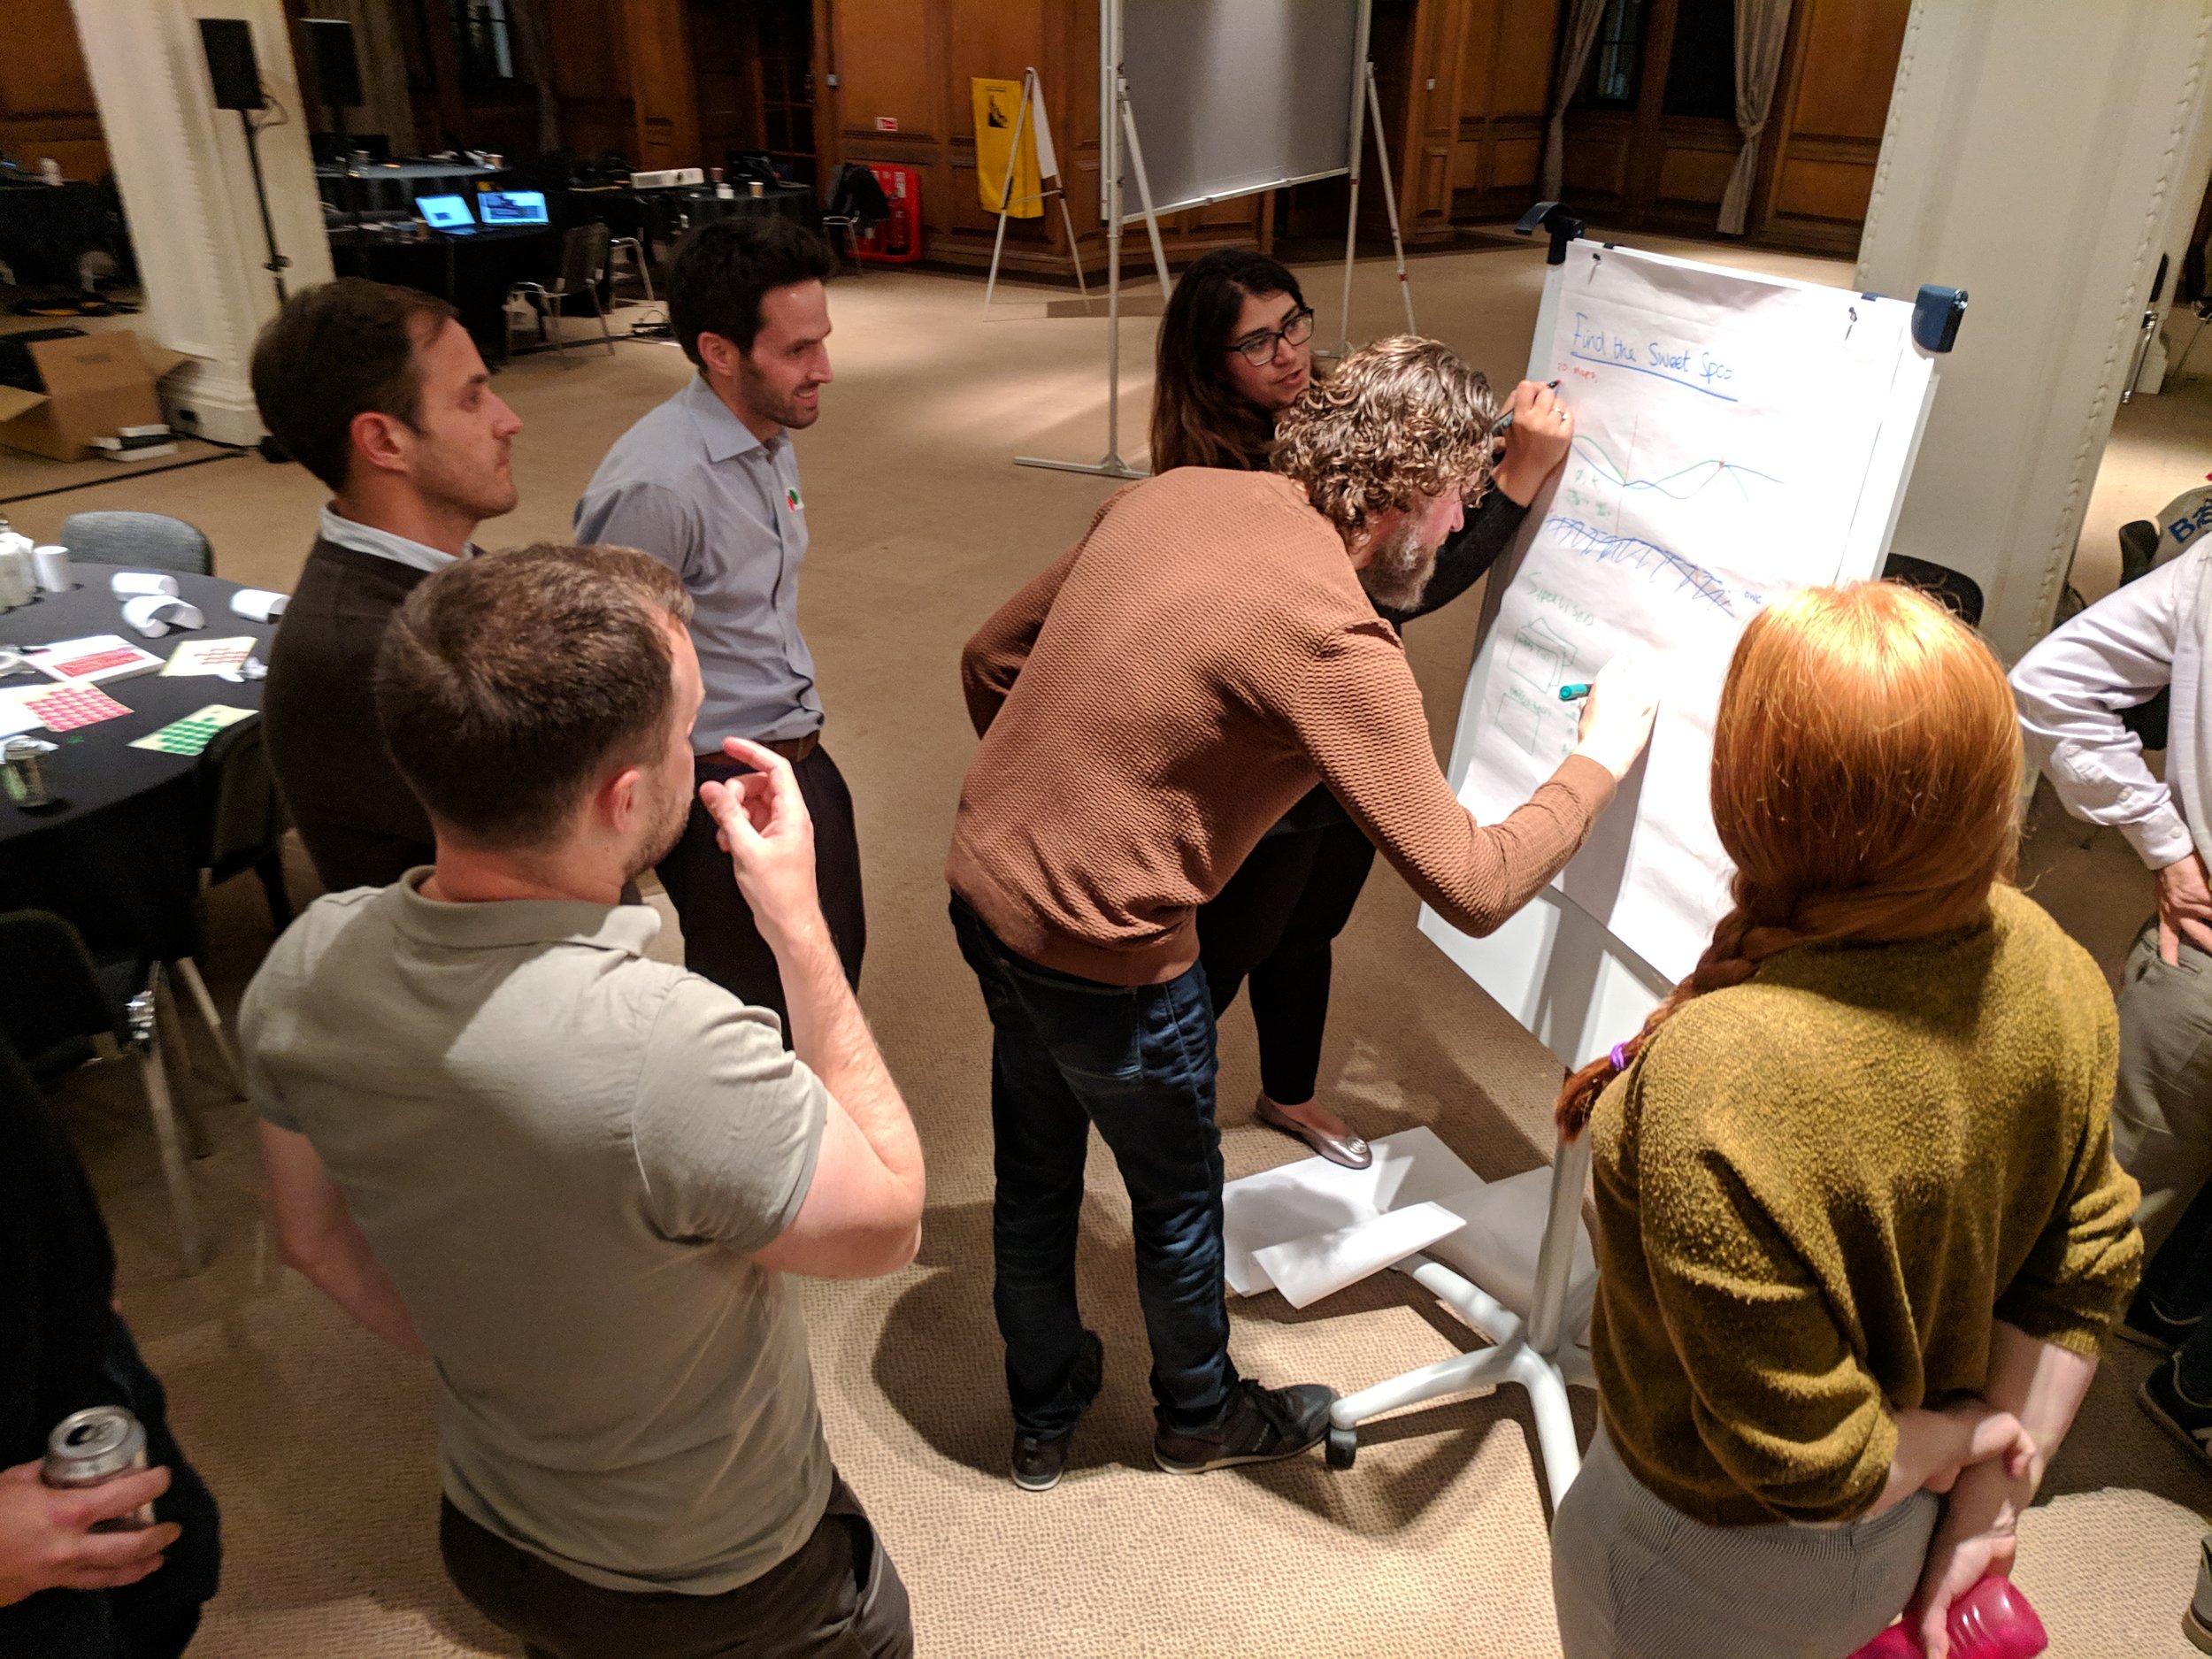
Sweet spot hunting

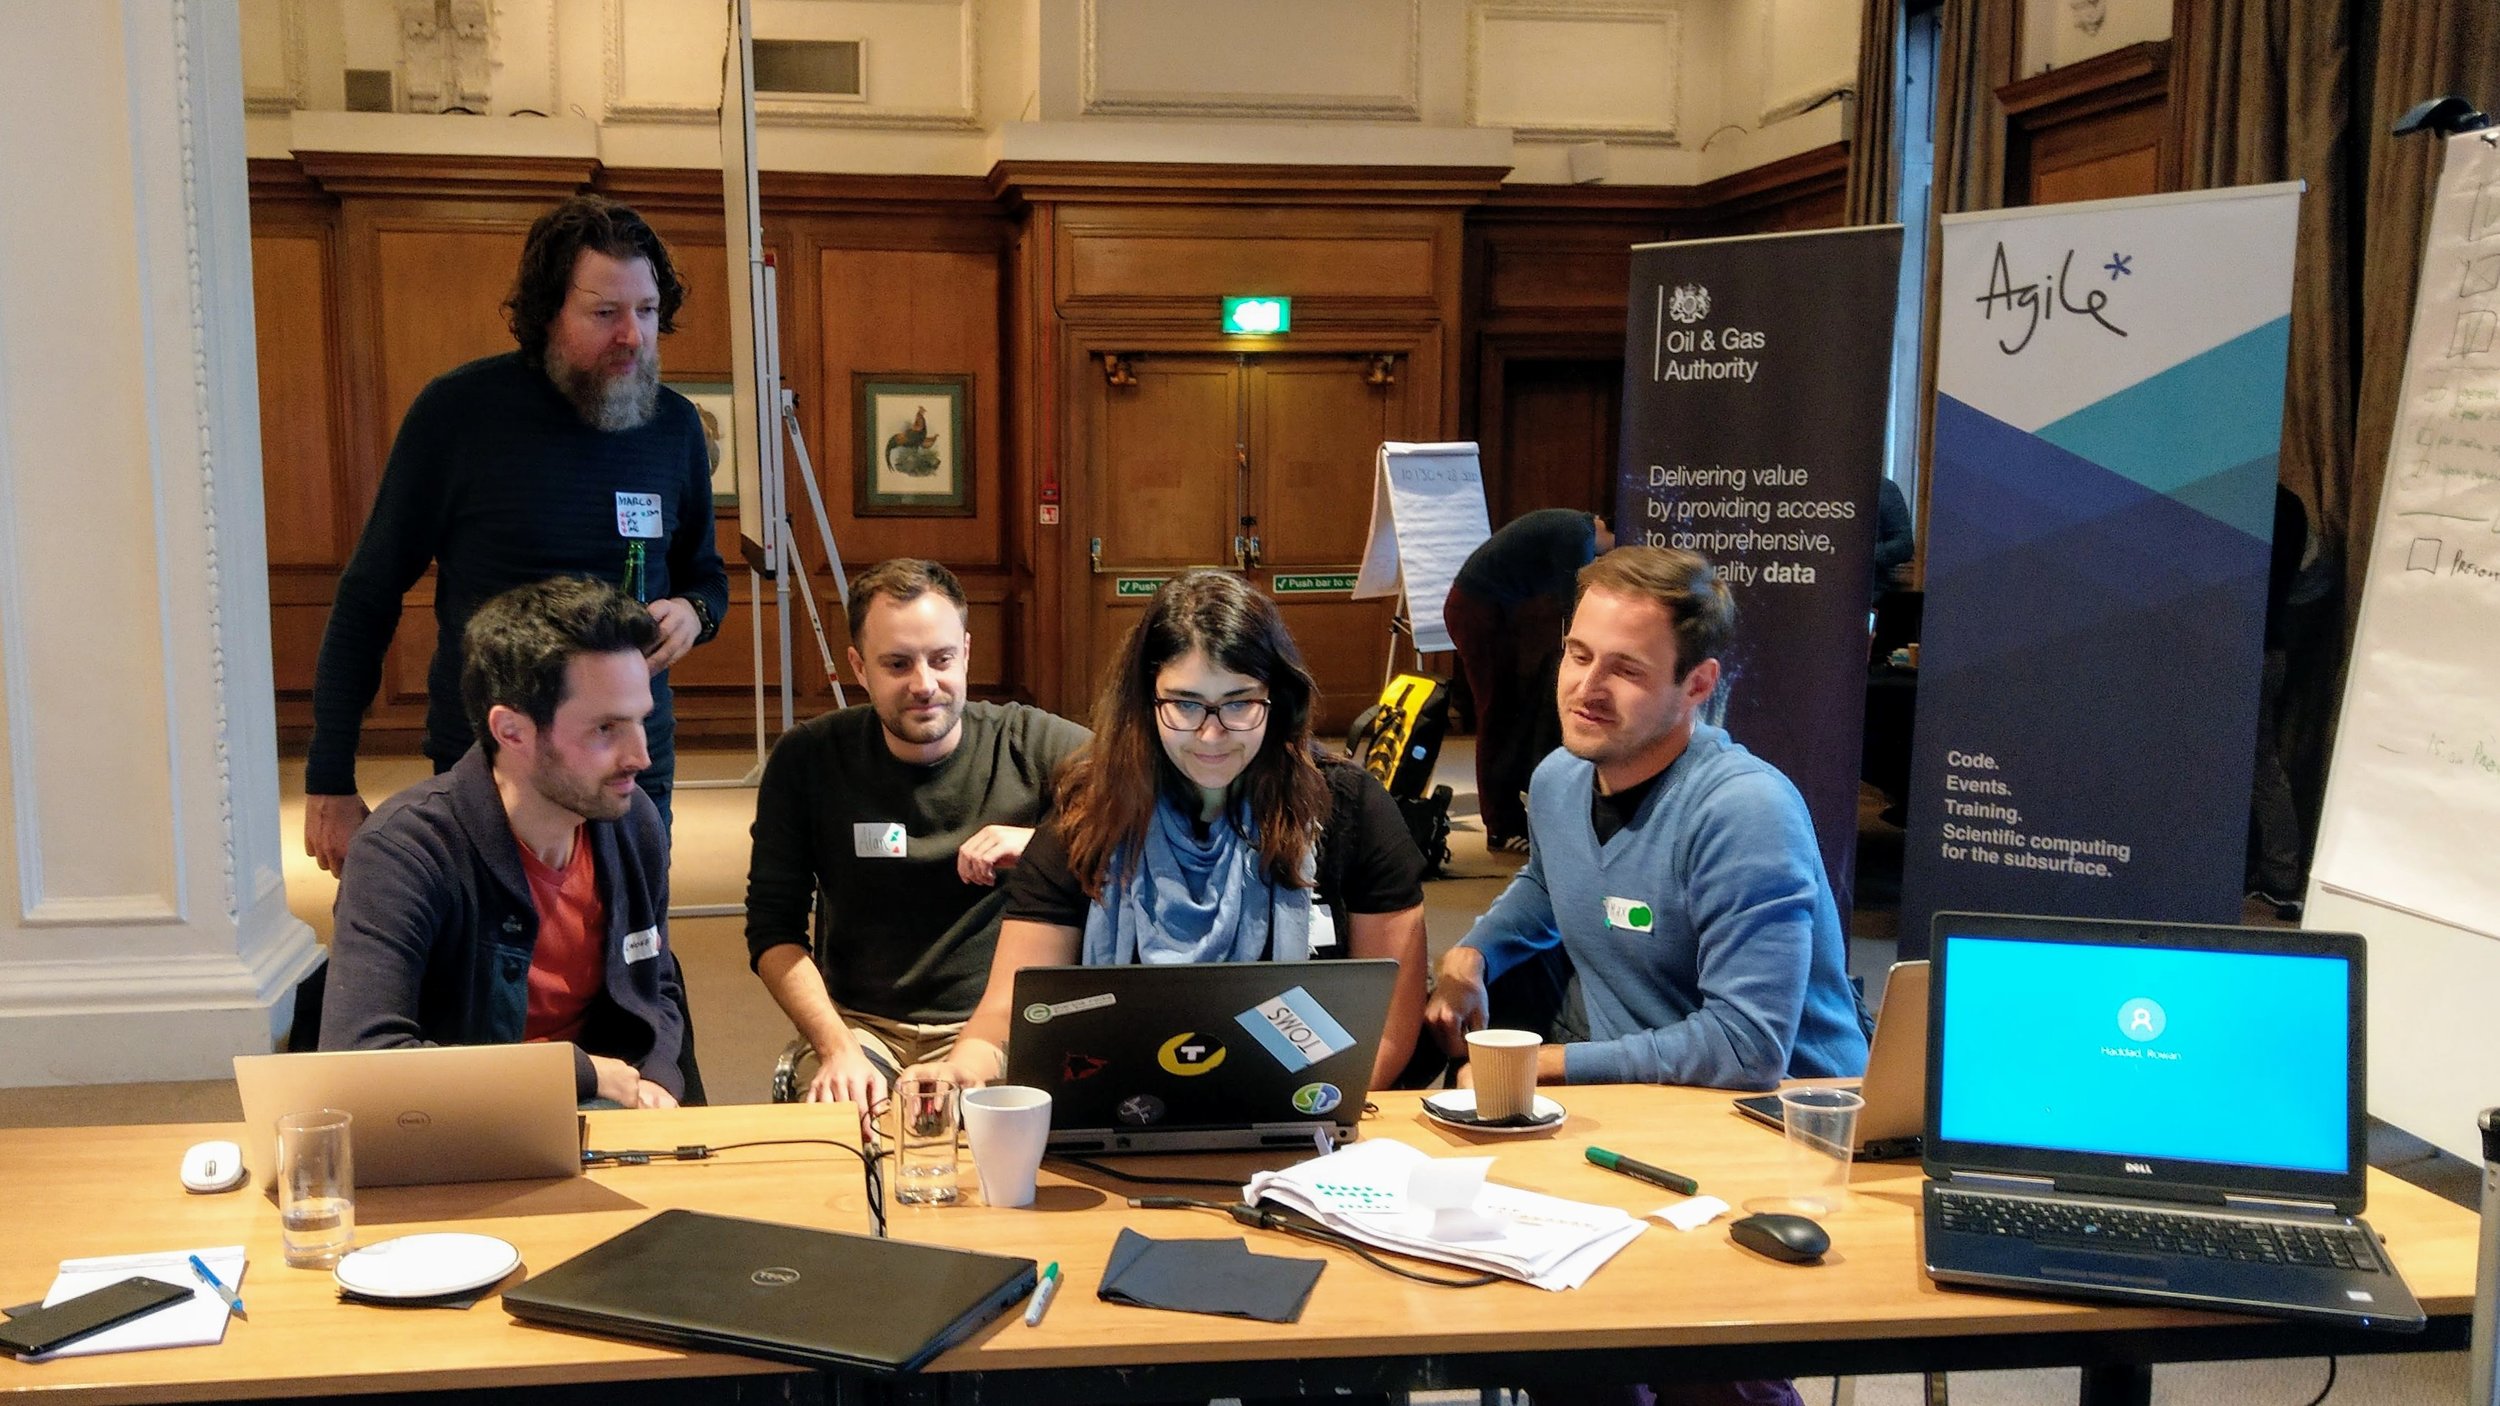
Sweet Spot Sweat Shop: Alan Wilson, Geoff Chambers, Marco van der Linden, Maxim Kotenev, Rowan Haddad.

Project: We’ve seen a few people tackling the issue of making decisions from large numbers of realizations recently. The approach here was to generate maps of various outputs from dynamic modeling and present these to the user in an interactive way. The team also had maps of sweet spots, as determined by simulation, and they attempted to train models to predict these sweetspots directly from the property maps. The result was a unique and interesting exploration of the potential for machine learning to augment standard workflows in reservoir modeling and simulation. Project page. GitHub repo.

sweetspot_prediction.png

An intelligent dashboard

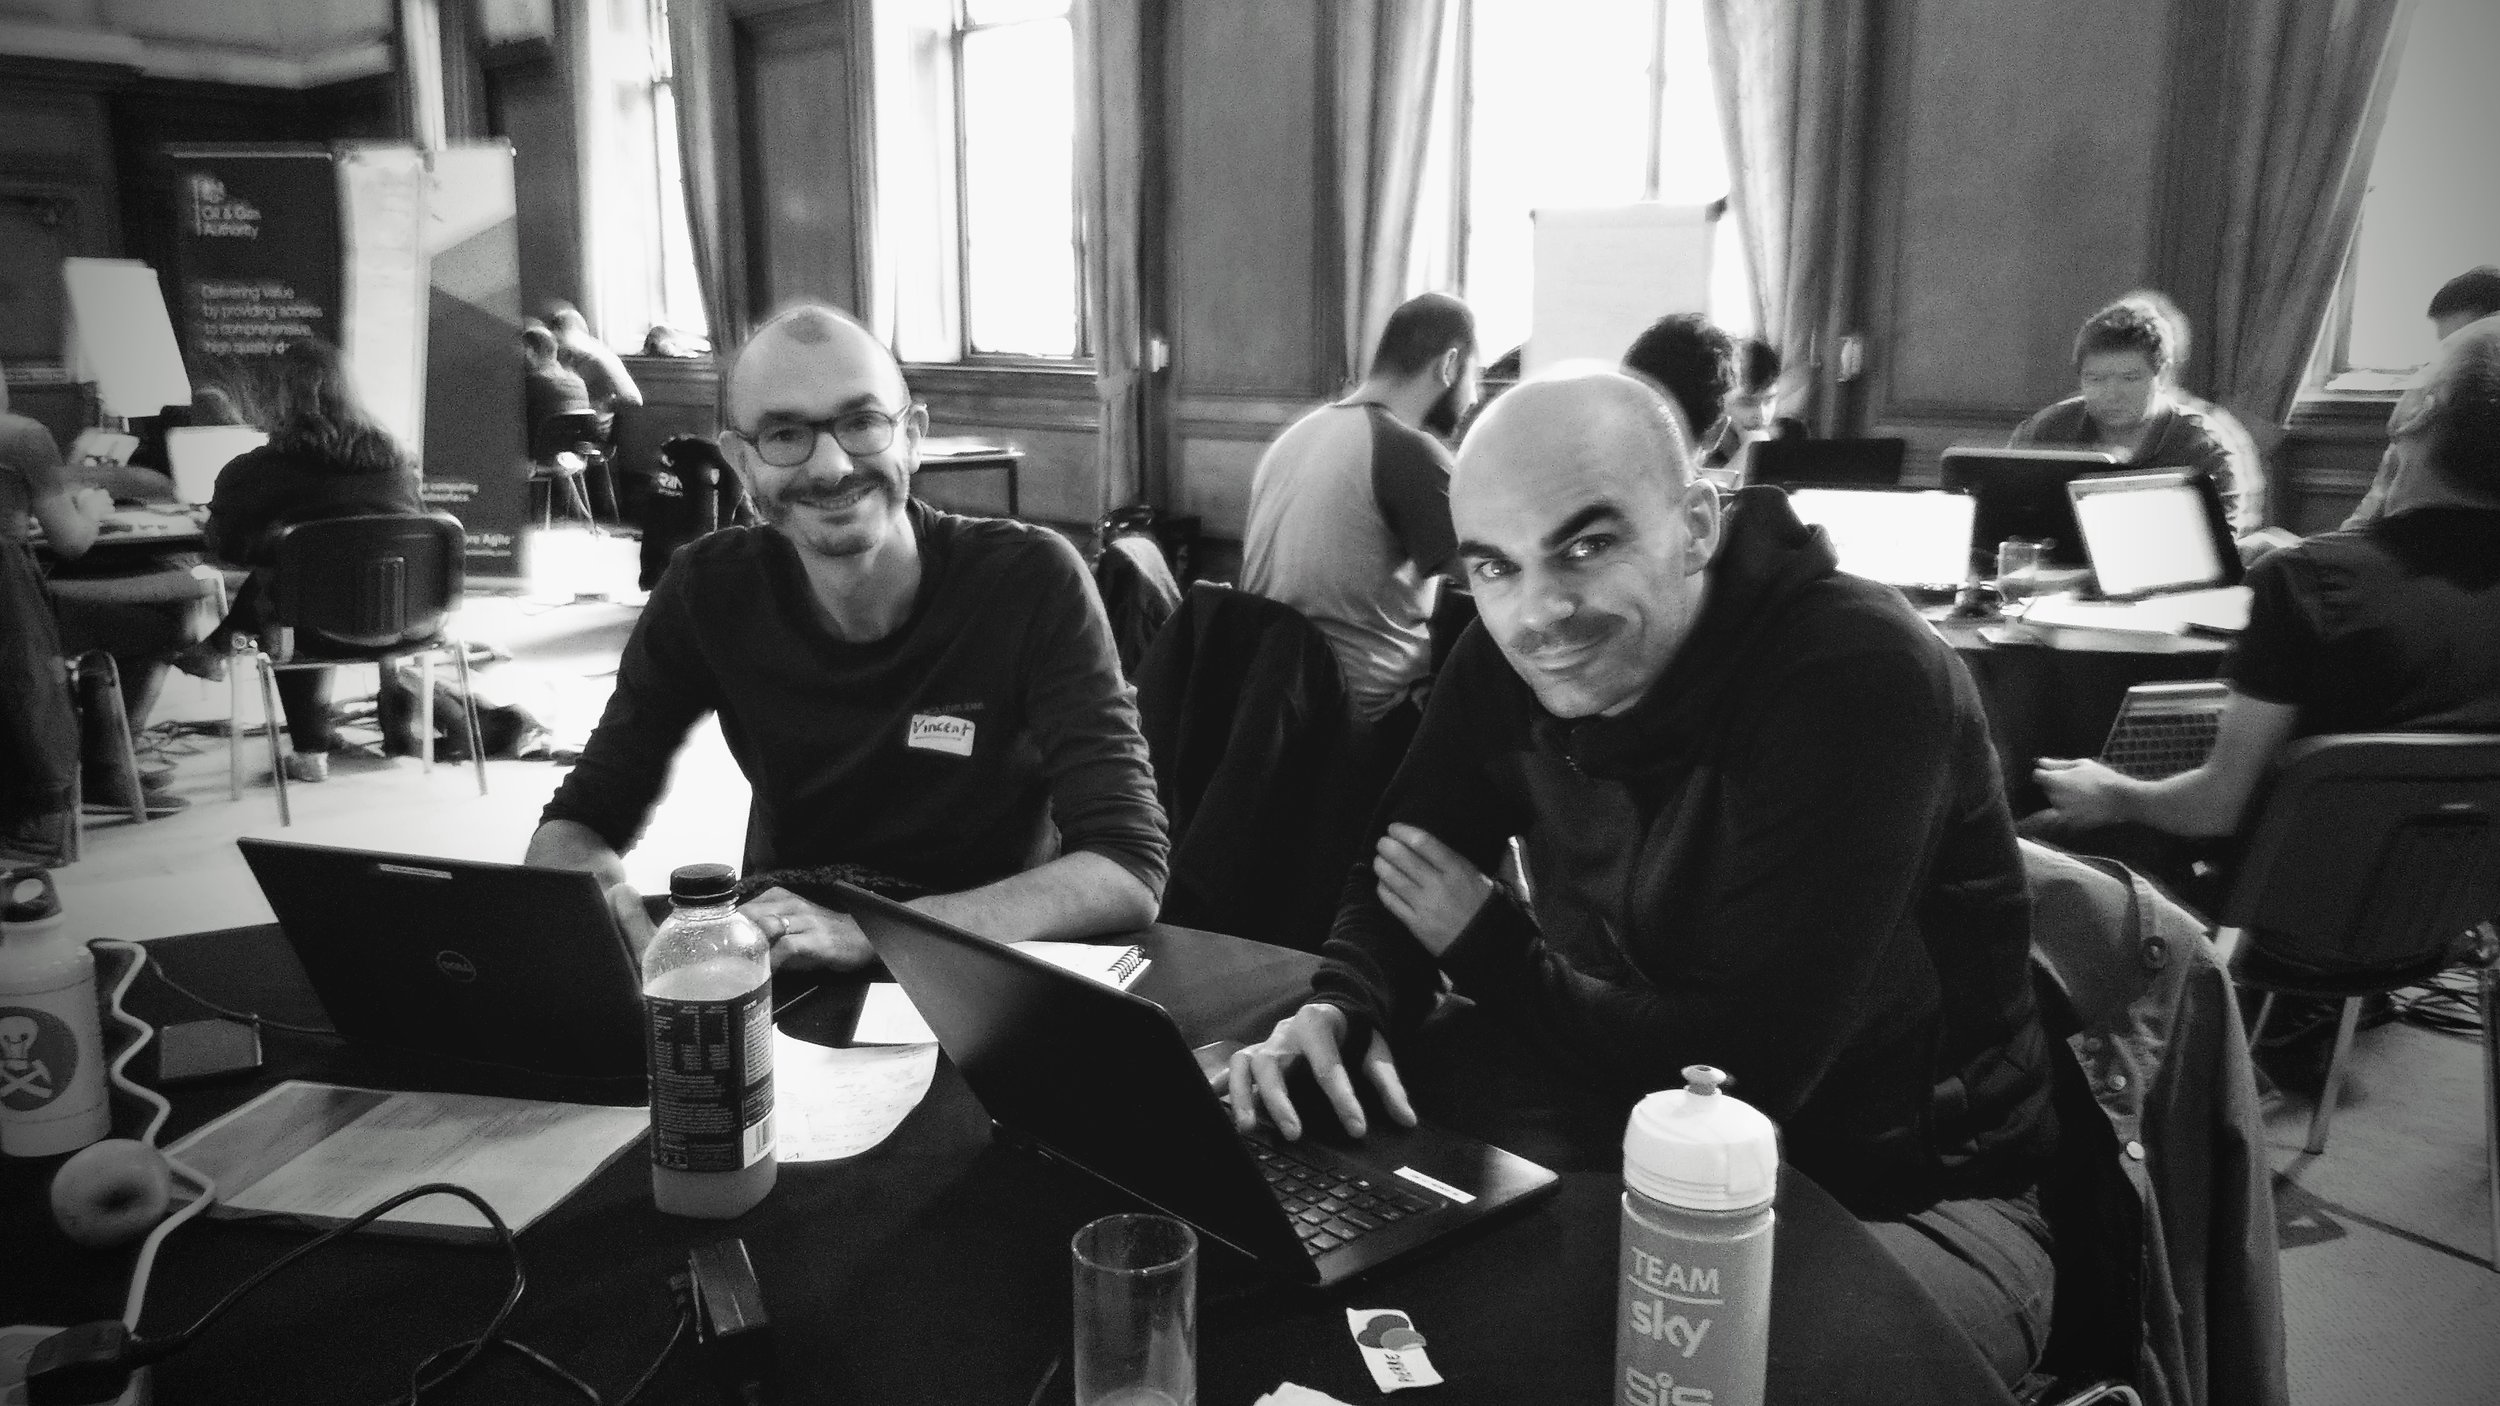
Dash AI: Vincent Penasse, Pierre Guilpain.

Project: Vincent and Pierre believed so strongly in their project that they ran with it as a pair. They started with labelled production history from 8 wells in a Pandas dataframe. They trained some models, including decision trees and KNN classifiers, to recognizedata issues and recommend required actions. Using skills they gained in the bootcamp, they put a flask web app in front of these to allow some interaction. The result was the start of an intelligent dashboard that not only flagged issues, but also recommended a response. Project page.

This project won recognition for impact.

DashAI-team.jpg

Predicting logs ahead of the bit

Team Mystic Bit: Connor Tann, Lawrie Cowliff, Justin Boylan-Toomey, Patrick Davies, Alessandro Christofori, Dan Austin, Jeremy Fortun.

Project: Thinking of this awesome demo, I threw down the gauntlet of real-time look-ahead prediction on the Friday evening, and Connor and the Mystic Bit team picked it up. They did a great job, training a series of models to predict a most likely log (see right) as well as upper and lower bounds. In the figure, the bit is currently at 1770 m. The model is shown the points above this. The orange crosses are the P90, P50 and P10 predictions up to 40 m ahead of the bit. The blue points below 1770 m have not yet been encountered. Project page. GitHub repo.

This project won recognition for best execution.

MysticBit_log-pred.png

The seals make a comeback

Selkie Se7en: Georgina Malas, Matthew Gelsthorpe, Caroline White, Karen Guldbaek Schmidt, Jalil Nasseri, Joshua Fernandes, Max Coussens, Samuel Eckford.

Project: At the Aberdeen hackathon, Julien Moreau brought along a couple of satellite image with the locations of thousands of seals on the images. They succeeded in training a model to correctly identify seal locations 80% of the time. In London, another team of almost all geologists picked up the project. They applied various models to the task, and eventually achieved a binary prediction accuracy of over 97%. In addition, the team trained a multiclass convolutional neural network to distinguish between whitecoats (pups), moulted seals (yearlings and adults), double seals, and dead seals.

Impressive stuff; it’s always inspiring to see people operating way outside their comfort zone. Project page.

selkie-seven.png

Interpreting the language of stratigraphy

The Lithographers: Gijs Straathof, Michael Steventon, Rodolfo Oliveira, Fabio Contreras, Simon Franchini, Malgorzata Drwila.

Project: At the project bazaar on Friday (the kick-off event at which we get people into teams), there was some chat about the recent paper on lithology prediction using recurrent neural networks (Jiang & James, 2018). This team picked up the idea and set out to reproduce the results from the paper. In the process, they digitized lithologies from one of the Posiedon wells. Project page. GitHub repo.

This project won recognition for teamwork.

Lithographers_team_logs.png

Know What You Know

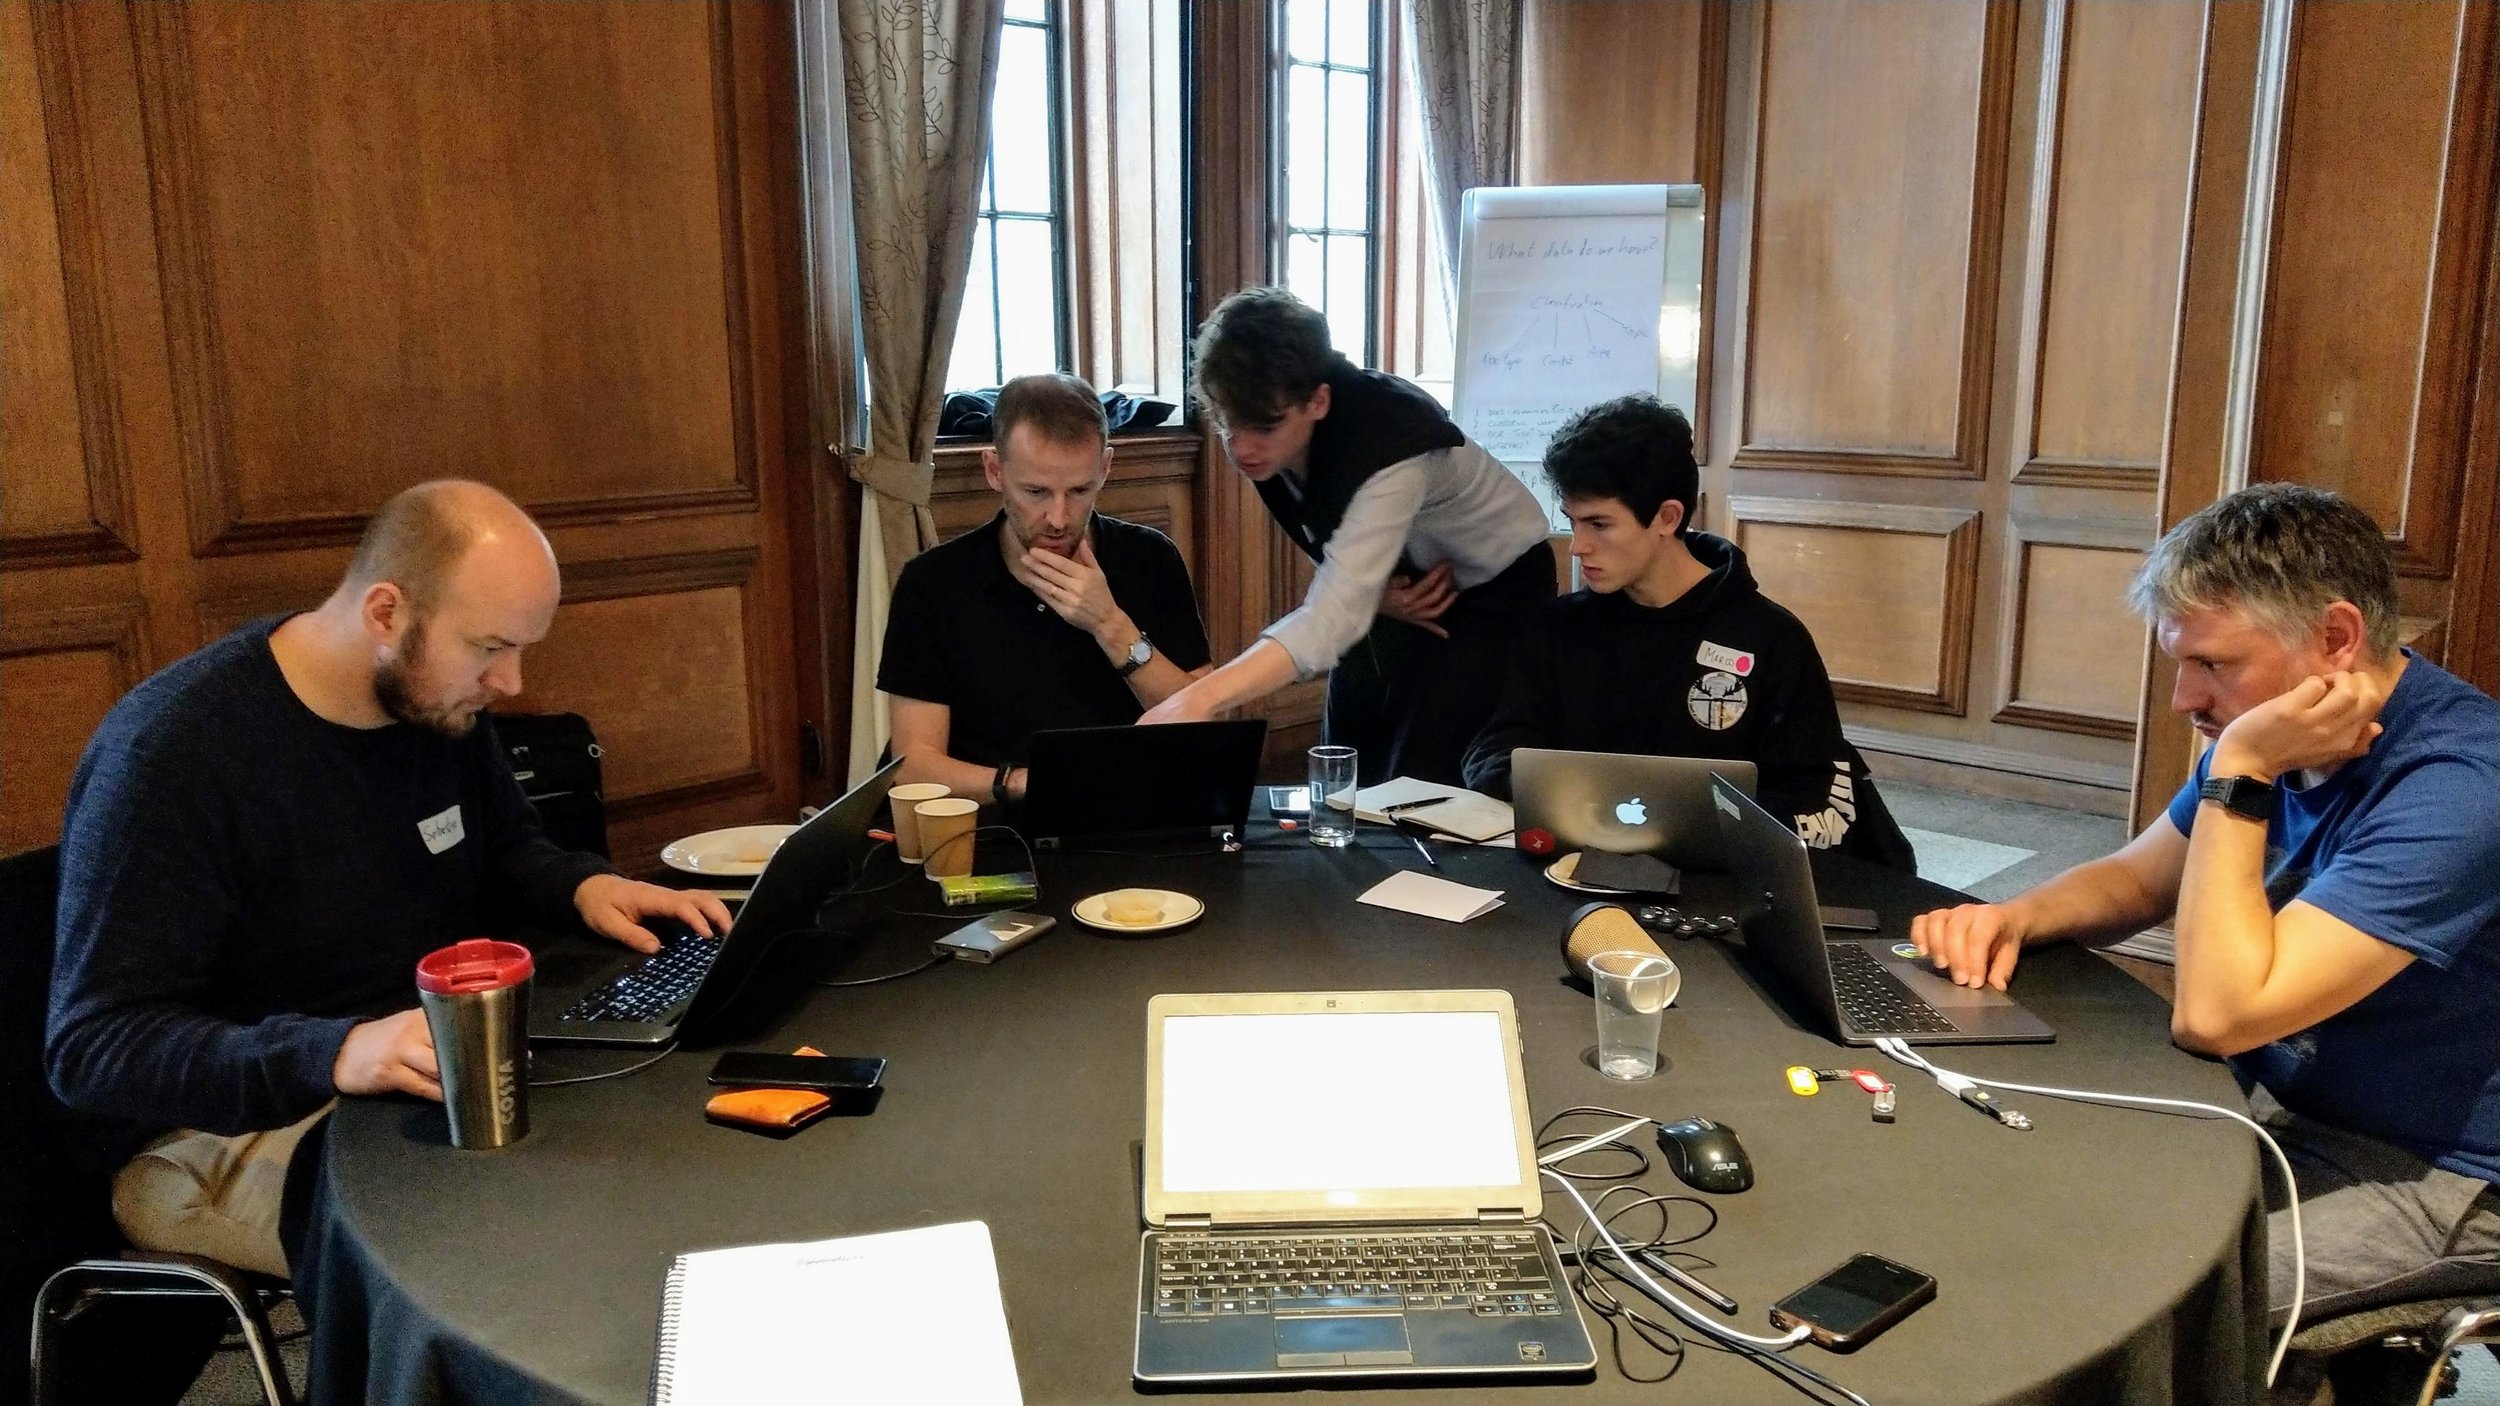
Team KWYK: Malcolm Gall, Thomas Stell, Sebastian Grebe, Marco Conticini, Daniel Brown.

Project: There’s always at least one team willing to take on the billions of pseudodigital documents lying around the industry. The team applied latent semantic analysis (a standard approach in natural language processing) to some of the gnarlier documents in the OGA’s repository. Since the documents don’t have labels, this is essentially an unsupervised task, and therefore difficult to QC, but the method seemed to be returning useful things. They put it all in a nice web app too. Project page. GitHub repo.

This project won recognition for Most Value.


A new approach to source separation

Cocktail Party Problem: Song Hou, Fai Leung, Matthew Haarhoff, Ivan Antonov, Julia Sysoeva.

Project: Song, who works at CGG, has a history of showing up to hackathons with very cool projects, and this was no exception. He has been working on solving the seismic source separation problem, more generally known as the cocktail party problem, using deep learning… and seems to have some remarkable results. This is cool because the current deblending methods are expensive. At the hackathon he and his team looked for ways to express the uncertainty in the deblending result, and even to teach a model to predict which parts of the records were not being resolved with acceptable signal:noise. Highly original work and worth keeping an eye on.

cocktail-party-problem.jpg

A big Thank You to the judges: Gillian White of the OGTC joined us a second time, along with the OGA’s own Jo Bagguley and Tom Sandison from Shell Exploration. Jo and Tom both participated in the Subsurface Hackathon in Copenhagen earlier this year, so were able to identify closely with the teams.

Thank you as well to the sponsors of these events, who all deserve the admiration of the community for stepping up so generously to support skill development in our industry:

oga-sponsors.png

That’s it for hackathons this year! If you feel inspired by all this digital science, do get involved. There are computery geoscience conversations every day over at the Software Underground Slack workspace. We’re hosting a digital subsurface conference in France in May. And there are lots of ways to get started with scientific computing… why not give the tutorials at Learn Python a shot over the holidays?

To inspire you a bit more, check out some more pictures from the event…