
F is for Frequency
/Frequency is the number of times an event repeats per unit time. Periodic signals oscillate with a frequency expressed as cycles per second, or hertz: 1 Hz means that an event repeats once every second. The frequency of a light wave determines its color, while the frequency of a sound wave determines its pitch. One of the greatest discoveries of the 18th century is that all signals can be decomposed into a set of simple sines and cosines oscillating at various strengths and frequencies.
I'll use four toy examples to illustrate some key points about frequency and where it rears its head in seismology. Each example has a time-series representation (on the left) and a frequency spectrum representation (right).
The same signal, served two ways
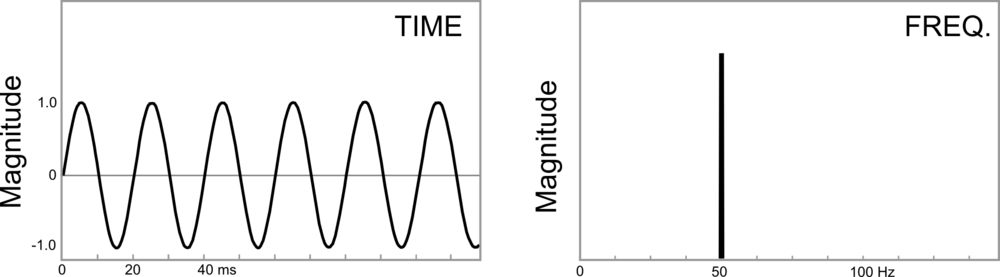
This sinusoid has a period of 20 ms, which means it oscillates with a frequency of 50 Hz (1/20 ms-1). A sinusoid is composed of a single frequency, and that component displays as a spike in the frequency spectrum. A side note: we won't think about wavelength here, because it is a spatial concept, equal to the product of the period and the velocity of the wave.
In reflection seismology, we don't want things that are of infinitely long duration, like sine curves. We need events to be localized in time, in order for them to be localized in space. For this reason, we like to think of seismic impulses as a wavelet.
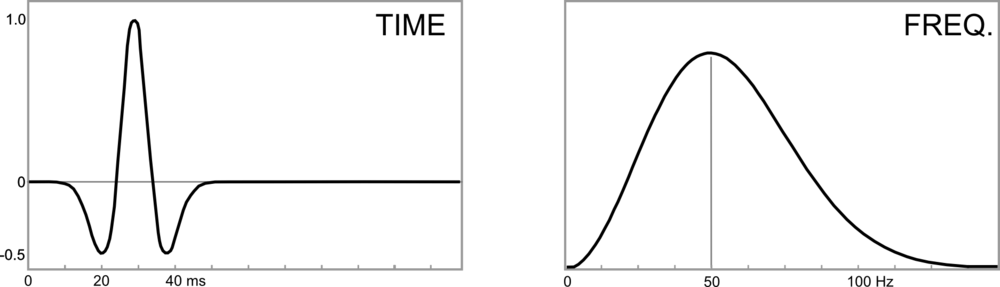
The Ricker wavelet is a simple model wavelet, common in geophysics because it has a symmetric shape and it's a relatively easy function to build (it's the second derivative of a Gaussian function). However, the answer to the question "what's the frequency of a Ricker wavelet?" is not straightforward. Wavelets are composed of a range (or band) of frequencies, not one. To put it another way: if you added monotonic sine waves together according to the relative amplitudes in the frequency spectrum on the right, you would produce the time-domain representation on the left. This particular one would be called a 50 Hz Ricker wavelet, because it has the highest spectral magnitude at the 50 Hz mark—the so-called peak frequency.
Bandwidth
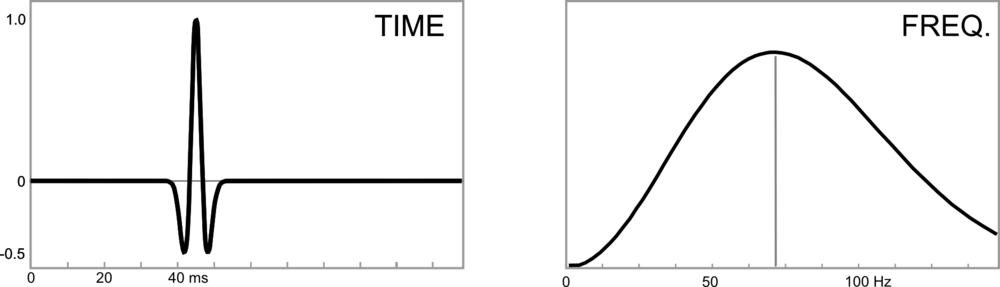
For a signal even shorter in duration, the frequency band must increase, not just the dominant frequency. What makes this wavelet shorter in duration is not only that it has a higher dominant frequency, but also that it has a higher number of sine waves at the high end of the frequency spectrum. You can imagine that this shorter duration signal traveling through the earth would be sensitive to more changes than the previous one, and would therefore capture more detail, more resolution.
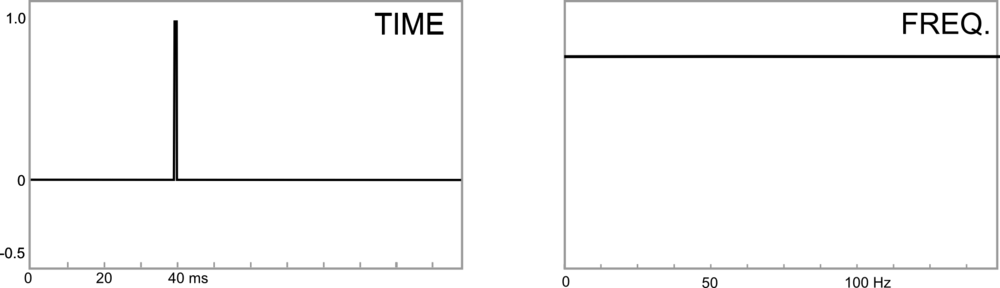
The extreme end member case of infinite resolution is known mathematically as a delta function. Composing a signal of essentially zero time duration (notwithstanding the sample rate of a digital signal) takes not only high frequencies, but all frequencies. This is the ultimate broadband signal, and although it is impossible to reproduce in real-world experiments, it is a useful mathematical construct.
What about seismic data?
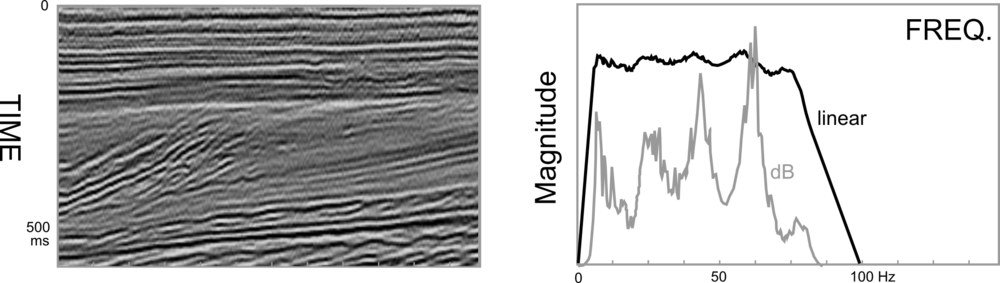
Real seismic data, which is acquired by sending wavelets into the earth, also has a representation in the frequency domain. Just as we can look at seismic data in time, we can look at seismic data in frequency. As is typical with all seismic data, the example below set lacks low and high frequencies: it has a bandwidth of 8–80 Hz. Many geophysical processes and algorithms have been developed to boost or widen this frequency band (at both the high and low ends), to increase the time domain resolution of the seismic data. Other methods, such as spectral decomposition, analyse local variations in frequency curves that may be otherwise unrecognizable in the time domain.
High resolution signals are short in the time domain and wide or broadband in the frequency domain. Geoscientists often equate high resolution with high frequency, but that it not entirely true. The greater the frequency range, the larger the information carrying capacity of the signal.
In future posts we'll elaborate on Fourier transforms, sampling, and frequency domain treatments of data that are useful for seismic interpreters.
For more posts in our Geophysics from A to Z posts, click here.


 Except where noted, this content is licensed