Seismic quality traffic light
/We like to think that our data are perfect and limitless, because experiments are expensive and scarce. Only then can our interpretations hope to stand up to even our own scrutiny. It would be great if seismic data was a direct representation of geology, but it never is. Poor data doesn't necessarily mean poor acquisition or processing. Sometimes geology is complex!
In his book First Steps in Seismic Interpretation, Don Herron describes a QC technique of picking a pseudo horizon at three different elevations to correspond to poor, fair, and good data regions. I suppose that will do in a pinch, but I reckon it would take a long time, and it is rather subjective. Surely we can do better?
Computing seismic quality
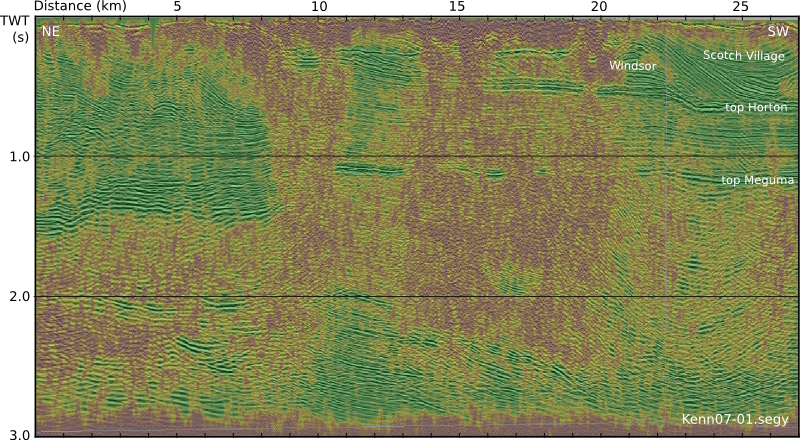
Conceptually speaking, the ease of interpretation depends on things we can measure (and display), like coherency, bandwidth, amplitude strength, signal-to-noise, and so on. There is no magic combination of filters that will work for all data, but I am convinced that for every seismic dataset there is a weighted function of attributes that can be concocted to serve as a visual indicator of the data complexity:

So one of the first things we do with new data at Agile is a semi-quantitative assessment of the likely ease and reliability of interpretation.

This traffic light display of seismic data quality, corendered here with amplitude, is not only a precursor to interpretation. It should accompany the interpretation, just like an experiment reporting its data with errors. The idea is to show, honestly and objectively, where we can trust eventual interpretations, and where they not well constrained. A common practice is to cherry pick specific segments or orientations that support our arguments, and quietly suppress those that don't. The traffic light display helps us be more honest about what we know and what we don't — where the evidence for our model is clear, and where we are relying more heavily on skill and experience to navigate a model through an area where the data is unclear or unconvincing.
Capturing uncertainty and communicating it in our data displays is not only a scientific endeavour, it is an ethical one. Does it change the way we look at geology if we display our confidence level alongside?
Reference
Herron, D (2012). First Steps in Seismic Interpretation. Geophysical Monograph Series 16. Society of Exploration Geophysicists, Tulsa, OK.
The seismic profile shown in the figure is from the Kennetcook Basin, Nova Scotia. This work was part of a Geological Survey of Canada study, available in this Open File report.


 Except where noted, this content is licensed