Tuning geology
/It's summer! We will be blogging a little less often over July and August, but have lots of great posts lined up so check back often, or subscribe by email to be sure not to miss anything. Our regular news feature will be a little less regular too, until the industry gets going again in September. But for today... here's the motivation behind our latest app for Android devices, Tune*.
Geophysicists like wedges. But why? I can think of only a few geological settings with a triangular shape; a stratigraphic pinchout or an angular unconformity. Is there more behind the ubiquitous geophysicist's wedge than first appears?
Seismic interpretation is partly the craft of interpreting artifacts, and a wedge model illustrates several examples of artifacts found in seismic data. In Widess' famous paper, How thin is a thin bed? he set out a formula for vertical seismic resolution, and constructed the wedge as an aid for quantitative seismic interpretation. Taken literally, a synthetic seismic wedge has only a few real-world equivalents. But as a purely quantitative model, it can be used to calibrate seismic waveforms and interpret data in any geological environment. In particular, seismic wedge models allow us to study how the seismic response changes as a function of layer thickness. For fans of simplicity, most of the important information from a wedge model can be represented by a single function called a tuning curve.
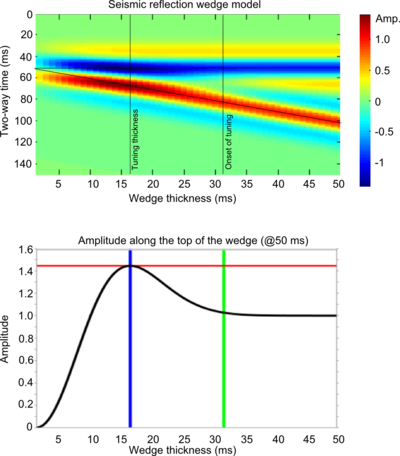
 In this figure, a seismic wedge model is shown for a 25 Hz Ricker wavelet. The effects of tuning (or interference) are clearly seen as variations in shape, amplitude, and travel time along the top and base of the wedge. The tuning curve shows the amplitude along the top of the wedge (thin black lines). Interestingly, the apex of the wedge straddles the top and base reflections, an apparent mis-timing of the boundaries.
On a tuning curve there are (at least) two values worth noting; the onset of tuning, and the tuning thickness. The onset of tuning (marked by the green line) is the thickness at which the bottom of the wedge begins to interfere with the top of the wedge, perturbing the amplitude of the reflections, and the tuning thickness (blue line) is the thickness at which amplitude interference is a maximum.
For a Ricker wavelet the amplitude along the top of the wedge is given by:
where R is the reflection coefficient at the boundary, f is the dominant frequency and t is the wedge thickness (in seconds). Building the seismic expression of the wedge helps to verify this analytic solution.
Wedge artifacts
The synthetic seismogram and the tuning curve reveal some important artifacts that the seismic interpreter needs to know about, because they could be pitfalls, or they could provide geological information:
Bright (and dim) spots: A bed thickness equal to the tuning thickness (in this case 15.6 ms) has considerably more reflective power than any other thickness, even though the acoustic properties are constant along the wedge. Below the tuning thickness, the amplitude is approximately proportional to thickness.
Mis-timed events: Below 15 ms the apparent wedge top changes elevation: for a bed below the tuning thickness, and with this wavelet, the apparent elevation of the top of the wedge is actually higher by about 7 ms. If you picked the blue event as the top of the structure, you'd be picking it erroneously too high at the thinnest part of the wedge. Tuning can make it challenging to account for amplitude changes and time shifts simultaneously when picking seismic horizons.
Limit of resolution: For a bed thinner than about 10 ms, the travel time between the absolute reflection maxima—where you would pick the bed boundaries—is not proportional to bed thickness. The bed appears thicker than it actually is.
Bottom line: if you interpret seismic data, and you are mapping beds around 10–20 ms thick, you should take time to study the effects of thin beds. We want to help! On Monday, I'll write about our new app for Android mobile devices, Tune*.
Reference
Widess, M (1973). How thin is a thin bed? Geophysics, 38, 1176–1180.


 Except where noted, this content is licensed