Illuminated equations
/Last year I wrote a post about annotated equations, and why they are useful teaching tools. But I never shared all the cool examples people tweeted back, and some of them are too good not to share.
Let’s start with this one from Andrew Alexander that he uses to explain complex number notation:
Paige Bailey tweeted some examples of annotated equations and code from the reinforcement learning tutorial, Building a Powerful DQN in TensorFlow by Sebastian Theiler. Here’s one of the algorithms, with slightly muted annotations:
Finally, Jesper Dramsch shared a new one today (and reminded me that I never finished this post). It links to Edward Raff’s book, Inside Deep Learning, which has some nice annotations, e.g. expressing a fundamental idea of machine learning:
Dynamic explication
The annotations are nice, but it’s quite hard to fully explain an equation or algorithm in one shot like this. It’s easier to do, and easier to digest, over time, in a presentation. I remember a wonderful presentation by Ross Mitchell (then U of Calgary) at the also brilliant lunchtime mathematics lectures that Shell used to sponsor in Calgary. He unpeeled time-frequency analysis, especially the S transform, and I still think about his talk today.
What Ross understood is that the learner really wants to see the maths build, more or less from first principles. Here’s a nice example — admittedly in the non-ideal medium of Twitter: make sure you read the whole thread — from Darrel Francis, a cardiologist at Imperial Colege, London:
A video is even more dynamic of course. Josef Murad shared a video in which he derives the Navier–Stokes equation:
In this video, Grant Sanderson, perhaps the equation explainer nonpareil, unpacks the Fourier transform. He creeps up on the equation, starting instead with building the intuition around frequency decomposition:
If you’d like to try making this sort of thing, you might like to know that Sanderson’s Python software, manim, is open source.
Multi-modal explication
Sanderson illustrates nicely that the teacher has several pedagogic tools at their disposal:
The spoken word.
The written word, especially the paragraph describing a function.
A symbolic representation of the function.
A graphical representation of the function.
A code representation of the function, which might also have a docstring, which is a formal description of the code, its inputs, and its outputs. It might also produce the graphical representation.
Still other modes, e.g. pseudocode (see Theiler’s example, above), a cartoon (esssentially a ‘pseudofigure’),
Virtually all of these things are, or can be dynamic (in a video, on a whiteboard) and annotated. They approach the problem from different directions. The spoken and written descriptions should be rigorous and unambiguous, but this can make them clumsy. Symbolic maths can be useful to those that can read it, but authors must take care to define symbols properly and to be consistent. The code representation must be strict (assuming it works), but might be hard for non-programmers to parse. Figures help most people, but are more about building intuition than providing the detail you might need for implementation, say. So perhaps the best explanations have several modes of explication.
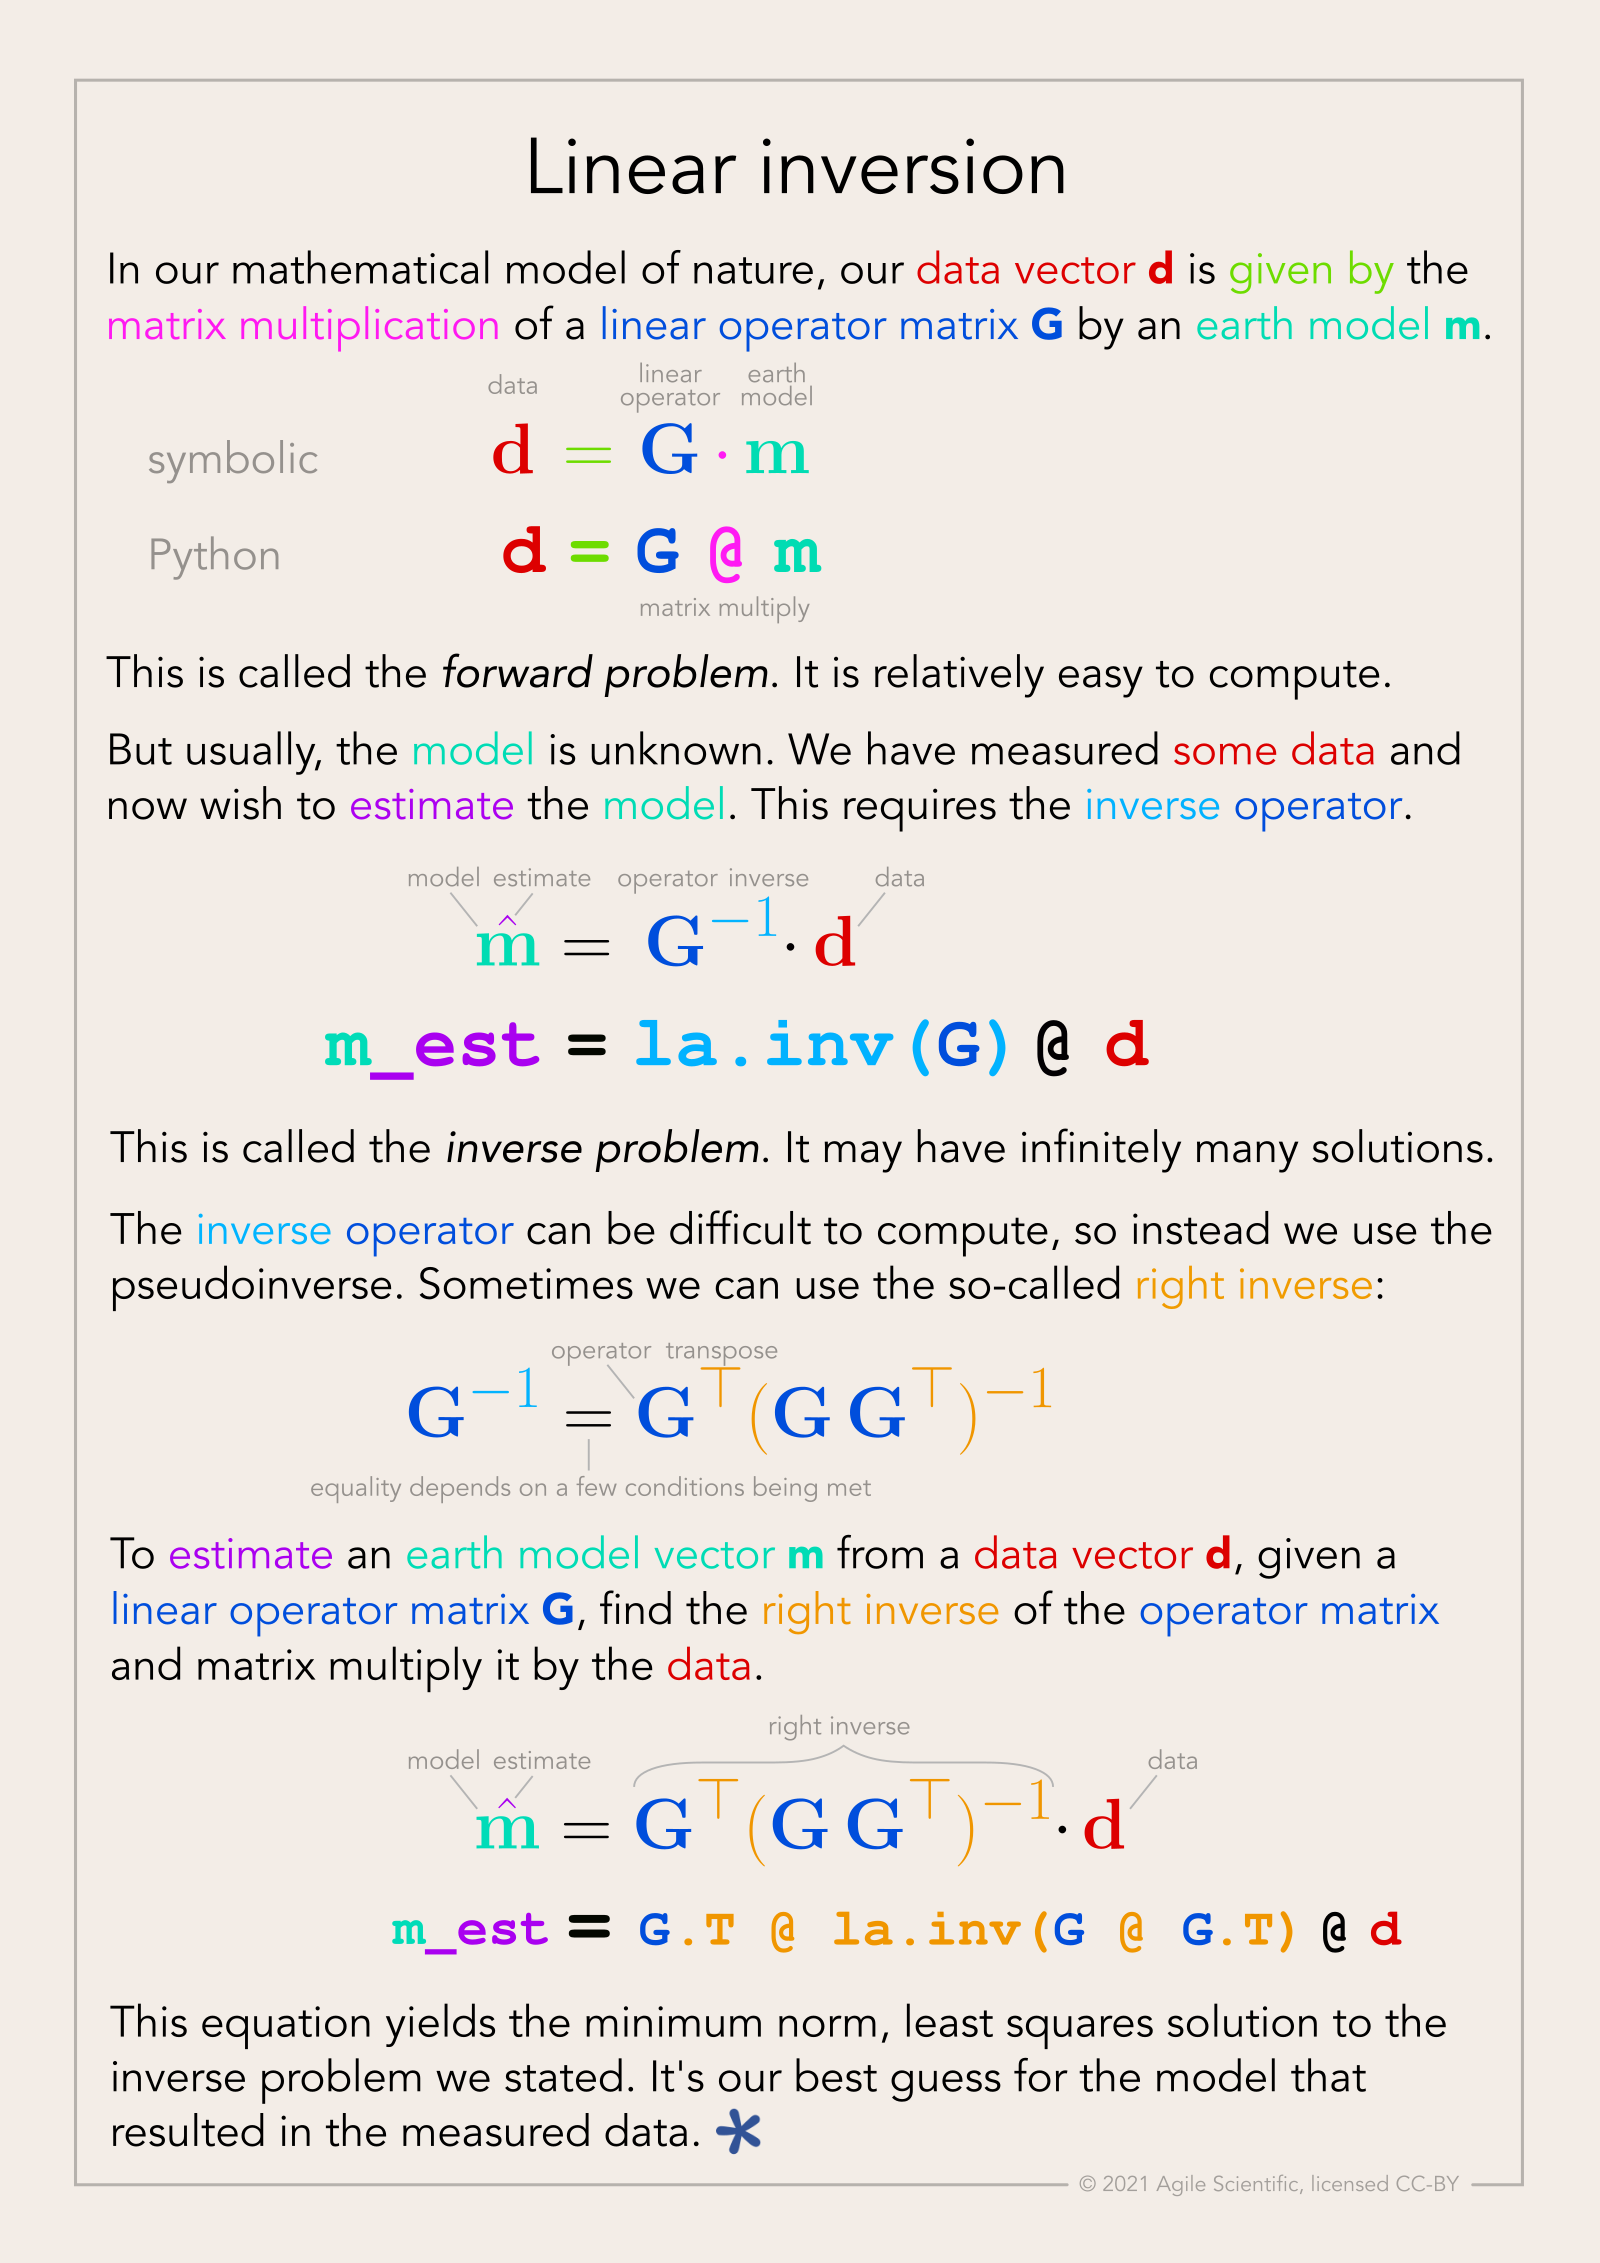
In this vein of multi-modal explication, Jeremy Howard shared a nice example from his book, Deep learning for coders, of combining text, symbolic maths, and code:
Eventually I settled on calling these things, that go beyond mere annotation, illuminated equations (not to directly compare them to the beautiful works of devotion produced by monks in the 13th century, but that’s the general idea). I made an attempt to describe linear regression and the neural network equation (not sure what else to call it!) in a series of tweets last year. Here’s the all-in-one poster version (as a PDF):
There’s nothing intuitive about physics, maths, or programming. The more tricks we have for spreading intuition about these important scientific tools, the better. I think there’s something in illuminated equations for teachers to practice — and students too. In fact, Jackie Caplan-Auerbach decribes coaching her students in creating ‘equation dictionaries’ in her geophysics classes. I think this is a wonderful idea.
If you’re teaching or learning maths, I’d love to hear your thoughts. Are these things worth the effort to produce? Do you have any favourite examples to share?


 Except where noted, this content is licensed