Interpreting spectral gamma-ray logs
/Before you can start interpreting spectral gamma-ray logs (or, indeed, any kind of data), you need to ask about quality.
Calibrate your tool...
The main issues affecting the quality of the logs are tool calibration and drilling mud composition. I think there's a tendency to assume that delivered logs have been rigorously quality checked, but... they haven't. The only safe assumption is that nobody cares about your logs as much as you. (There is a huge opportunity for service companies here — but in my experience they tend to be focused on speed and quantity, not quality.)
 Calibration is critical. The measurement device in the tool consists of a thallium-laced NaI crystal and a photomultiplier. Both of these components are sensitive to temperature, so calibration is especially important when the temperature of the tool is changing often. If the surface temperature is very different from the downhole—winter in Canada—calibrate often.
Drilling mud containing KCl (to improve borehole stability) increases the apparent potassium content of the formation, while barite acts as a gamma-ray absorber and reduces the count rates, especially in the low energies (potassium).
One of the key quality control indicators is negative readings on the uranium log. A few negative values are normal, but many zero-crossings may indicate that the tool was improperly calibrated. It is imperative to quality control all of the logs, for bad readings and pick-up effects, before doing any quantitative work.
 ...and your interpretation
Most interpretations of spectral-gamma ray logs focus on the relationships between the three elemental concentrations. In particular, Th/K and Th/U are often used for petrophysical interpretation and log correlation. In calculating these ratios, Schlumberger uses the following cut-offs: if uranium < 0.5 then uranium = 0.5; if potassium < 0.004 then potassium = 0.001 (according to my reference manual for the natural gamma tool).
In general, high K values may be caused by the presence of potassium feldspars or micas. Glauconite usually produces a spike in the K log. High Th values may be associated with the presence of heavy minerals, particularly in channel deposits. Increased Th values may also be associated with an increased input of terrigenous clays. Increases in U are frequently associated with the presence of organic matter. For example, according to the ODP, particularly high U concentrations (> 5 ppm) and low Th/U ratios (< 2) often occur in black shale deposits.
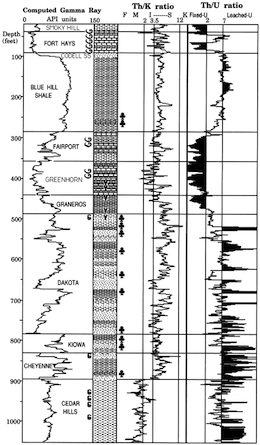
The logs here, from Kansas Geological Survey open file 90-27 by Macfarlane et al. shows a quite overt interpretive approach, with the Th/K log labelled with minerals (feldspar, mica, illite–smectite) and the Th/U log in uranium 'fixedness', a proxy for organic matter.
Sounds useful. But really, you can probably find just a paper to support just about any interpretation you want to make. Which isn't to say that spectral gamma-ray is no use — it's just not diagnostic on its own. You need to calibrate it to your own basin and your own stratigraphy. This means careful, preferably quantitative, comparison of core and logs.
Further reading
- Ross Crain's Petrophysical Handbook is a mine of well logging goodness
- Paul Glover's MSc course notes are very comprehensive on most well logging topics
- Fabricius et al. (2003). Geological Survey of Denmark and Greenland Bulletin 1, 349–366. A case stuudy from the Danish Central Graben.


 Except where noted, this content is licensed