What is spectral gamma-ray?
/The spectral gamma-ray log is a measure of the natural radiation in rocks. The amplitude of the signal from the gamma-ray tool, which is just a sensor with no active source, is proportional to the energy of the gamma-ray photons it encounters. Being able to differentiate between photons of different energies turns out to be very handy Compared to the ordinary gamma-ray log, which ignores the energies and only counts the photons, it's like seeing in colour instead of black and white.
Why do we care about gamma radiation?
First, what are gamma rays? Highly energetic photons: electromagnetic radiation with very short wavelengths.

Being able to see different energies, or 'colours', means we can differentiate between the radioactive decay of different elements. Elements decay by radiating energy, and the 'colour' of that energy is characteristic of that element (actually, of each isotope). So, we can tell by looking at the energy of a photon if we are seeing a potassium atom (40K) or a uranium atom (238U) decay. These are very different isotopes, with very different habits. We can do geology!
In fact, all sorts of radioisotopes occur naturally in the earth. By far the most abundant are potassium 40K, thorium 232Th and uranium 238U. Of these, potassium is the most abundant in sedimentary rocks, but thorium and uranium are present in small quantities, and have particular sedimentological implications.
What exactly are we measuring?
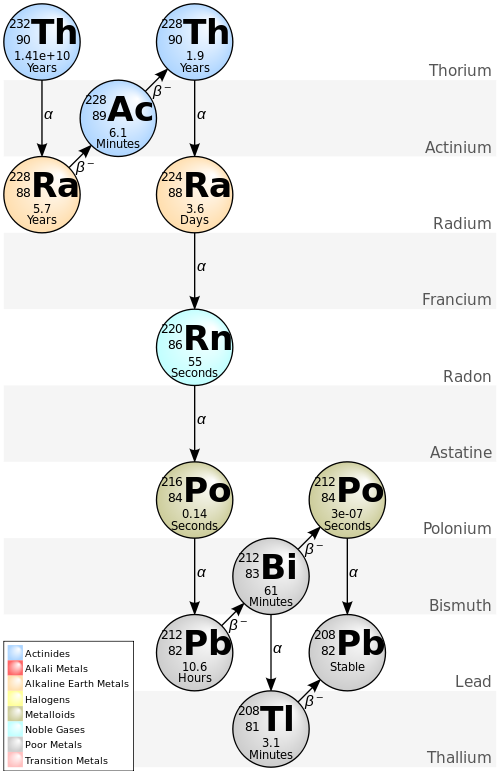
 Potassium 40K decays to argon about 10% of the time, with γ-emission at 1.46 MeV (the other 90% of the time it decays to calcium). However, all of the decay in the 232Th and 238U decay series occurs by α- and β-particle decay, which don't always result in photon emission. The tool in fact measures γ-radiation from the decay of thallium 208Tl in the 232Th series (right), and from bismuth 214Bi in the 238U series. The spectral gamma-ray tool must be calibrated to known samples to give concentrations of 232Th and 238U from its readings. Proper calibration is vital, and is temperature-sensitive (of note in Canada!).
The concentrations of the three elements are estimated from the spectral measurements. The concentration of potassium is usually measured in percent (%) or per mil (‰), or sometimes in kilograms per tonne, which is equivalent to per mil. The other two elements are measured in parts per million (ppm).
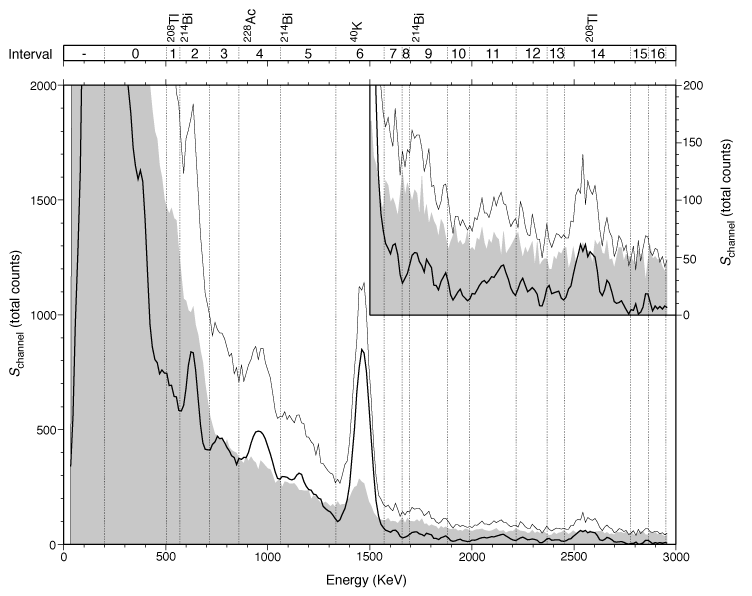
 Here is the gamma-ray spectrum from a single sample from 509 m below the sea-floor at ODP Site 1201. The final spectrum (heavy black line) is shown after removing the background spectrum (gray region) and applying a three-point mean boxcar filter. The thin black line shows the raw spectrum. Vertical lines mark the interval boundaries defined by Peter Blum (an ODP scientist at Texas A&M). Prominent energy peaks relating to certain elements are identified at the top of the figure. The inset shows the spectrum for energies >1500 keV at an expanded scale.
We wouldn't normally look at these spectra. Instead, the tool provides logs for K, Th, and U. Next time, I'll look at the logs.
Spectrum illustration by Wikipedia user Inductiveload, licensed GFDL; decay chain by Wikipedia user BatesIsBack, licensed CC-BY-SA.


 Except where noted, this content is licensed