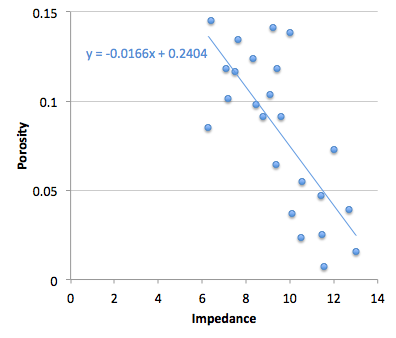
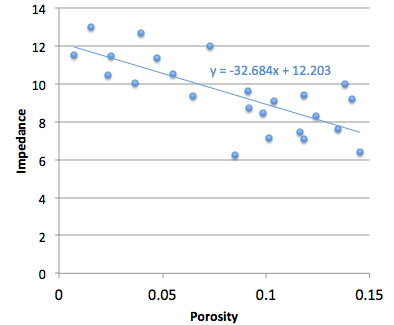
Cross plot or plot cross?
/I am stumped. About once a year, for the last nine years or so, I have failed to figure this out.
What could be simpler than predicting porosity from acoustic impedance? Well, lots of things, but let’s pretend for a minute that it’s easy. Here’s what you do:
 1. Measure impedance at a bunch of wells
2. Measure the porosity — at seismic scale of course — at those wells
3. Make a crossplot with porosity on the y-axis and amplitude on the x-axis
4. Plot the data points and plot the regression line (let’s keep it linear)
5. Find the equation of the line, which is of the form y = ax + b, or porosity = gradient × impedance + constant
6. Apply the equation to a map (or volume, if you like) of amplitude, and Bob's your uncle.
Easy!
But, wait a minute. Is Bob your uncle after all? The parameter on the y-axis is also called the dependent variable, and that on the x-axis the independent. In other words, the crossplot represents a relationship of dependency, or causation. Well, porosity certainly does not depend on impedance — it’s the other way around. To put it another way, impedance is not the cause of porosity. So the natural relationship should put impedance, not porosity, on the y-axis. Right?
 Therefore we should change some steps:
3. Make a crossplot with impedance on the y-axis and porosity on the x-axis
4. Plot the data points and plot the regression line
5a. Find the equation of the line, which is of the form y = ax + b, or impedance = gradient × porosity + constant
5b. Rearrange the equation for what we really want:
porosity = (impedance – constant)/gradient
Not quite as easy! But still easy.
More importantly, this gives a different answer. Bob is not your uncle after all. Bob is your aunt. To be clear: you will compute different porosities with these two approaches. So then we have to ask: which is correct? Or rather, since neither going to give us the ‘correct’ porosity, which is better? Which is more physical? Do we care about physicality?
I genuinely do not know the answer to this question. Do you?
If you're interested in playing with this problem, the data I used are from Imaging reservoir quality seismic signatures of geologic effects, report number DE-FC26-04NT15506 for the US Department of Energy by Gary Mavko et al. at Stanford University. I digitized their figure D-8; you can download the data as a CSV here. I have only plotted half of the data points, so I can use the rest as a blind test.
Don't miss my follow up to this post... a non-answer. More input and discussion always welcome!


 Except where noted, this content is licensed