The filtered earth
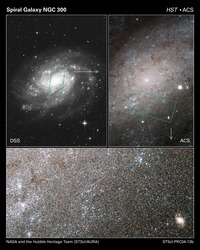
/ Ground-based image (top left) vs Hubble's image. Click for a larger view. One of the reasons for launching the Hubble Space Telescope in 1990 was to eliminate the filter of the atmosphere that affects earth-bound observations of the night sky. The results speak for themselves: more than 10 000 peer-reviewed papers using Hubble data, around 98% of which have citations (only 70% of all astronomy papers are cited). There are plenty of other filters at work on Hubble's data: the optical system, the electronics of image capture and communication, space weather, and even the experience and perceptive power of the human observer. But it's clear: eliminating one filter changed the way we see the cosmos.
What is a filter? Mathematically, it's a subset of a larger set. In optics, it's a wavelength-selection device. In general, it's a thing or process which removes part of the input, leaving some output which may or may not be useful. For example, in seismic processing we apply filters which we hope remove noise, leaving signal for the interpreter. But if the filters are not under our control, if we don't even know what they are, then the relationship between output and input is not clear.
Imagine you fit a green filter to your petrographic microscope. You can't tell the difference between the scene on the left and the one on the right—they have the same amount and distribution of green. Indeed, without the benefit of geological knowledge, the range of possible inputs is infinite. If you could only see a monochrome view, and you didn't know what the filter was, or even if there was one, it's easy to see that the situation would be even worse.
 Like astronomy, the goal of geoscience is to glimpse the objective reality via our subjective observations. All we can do is collect, analyse and interpret filtered data, the sifted ghost of the reality we tried to observe. This is the best we can do.
What do our filters look like? In the case of seismic reflection data, the filters are mostly familiar:
- the design determines the spatial and temporal resolution you can achieve
- the source system and near-surface conditions determine the wavelet
- the boundaries and interval properties of the earth filter the wavelet
- the recording system and conditions affect the image resolution and fidelity
- the processing flow can destroy or enhance every aspect of the data
- the data loading process can be a filter, though it should not be
- the display and interpretation methods control what the interpreter sees
- the experience and insight of the interpreter decides what comes out of the entire process
Every other piece of data you touch, from wireline logs to point-count analyses, and from pressure plots to production volumes, is a filtered expression of the earth. Do you know your filters? Try making a list—it might surprise you how long it is. Then ask yourself if you can do anything about any of them, and imagine what you might see if you could.
Hubble image is public domain. Photomicrograph from Flickr user Nagem R., licensed CC-BY-NC-SA.


 Except where noted, this content is licensed