The hack is back: An invitation to get creative

We're organizing another hackathon! It's free, and it's for everyone — not just programmers. So mark your calendar for the weekend of 25 and 26 October, sign up with a friend, and come to Denver for the most creative 48 hours you'll spend this year. Then stay for the annual geophysics fest that is the SEG Annual Meeting!

First things first: what is a hackathon? Don't worry, it's not illegal, and it has nothing to do with security. It has to do with ideas and collaborative tool creation. Here's a definition from Wikipedia:

A hackathon (also known as a hack day, hackfest, or codefest) is an event in which computer programmers and others involved in software development, including graphic designers, interface designers and project managers, collaborate intensively on software projects.

I would add that we just need a lot of scientists — you can bring your knowledge of workflows, attributes, wave theory, or rock physics. We need all of that.

Creativity in geophysics

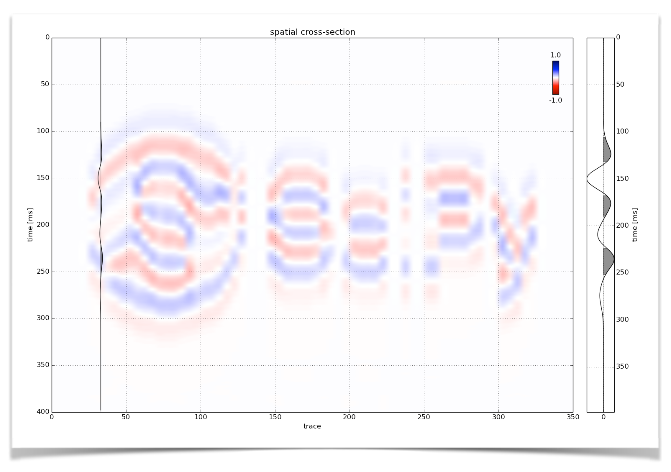
The best thing we can do with our skills — and to acquire new ones — is create things. And if we create things with and alongside others, we learn from them and they learn from us, and we make lasting connections with people. We saw all this last year, when we built several new geophysics apps:

hackathon_2014_calendar.png

The event is at the THRIVE coworking space in downtown Denver, less than 20 minutes' walk from the convention centre — a Manhattan distance of under 1 mile. They are opening up especially for us — so we'll have the place to ourselves. Just us, our laptops, high-speed WiFi, and lots of tacos. 

Sign up here.It's going to be awesome.

The best in the biz

GeoTeric_logo.jpg

This business is blessed with some forward-looking companies that know all about innovation in subsurface geoscience. We're thrilled to have some of them as sponsors of our event, and I hope they will also be providing coders and judges for the event itself. So far we have generous support from dGB — creators of the OpendTect seismic interpretation platform — and ffA — creators the GeoTeric seismic attribute analysis toolbox. A massive Thank You to them both.

If you think your organization might be up for supporting the event, please get in touch! And remember, a fantastic way to support the event — for free! — is just to come along and take part. Sign your team up here!

Student grants

We know there's a lot going on at SEG on this same weekend, and we know it's easier to get money for traditional things like courses. So... We promise that this hackathon will bring you at least as much lasting joy, insight, and skill development as any course. And, if you'll write and tell us what you'd build, we'll consider you for one of four special grants of $250 to help cover your extra costs. No strings. Send your ideas to matt@agilegeoscience.com.

Update

on 2014-09-07 12:17 by Matt Hall

OpenGeoSolutions, the Calgary-based tech company that's carrying the FreeUSP torch and exporing the frequency domain so thoroughly, has sponsred the hackathon again this year. Thank you to Jamie and Chris and everyone else at OGS!

Six books about seismic analysis

Last year, I did a round-up of six books about seismic interpretation. A raft of new geophysics books recently, mostly from Cambridge, prompts this look at six volumes on seismic analysis — the more quantitative side of interpretation. We seem to be a bit hopeless at full-blown book reviews, and I certainly haven't read all of these books from cover to cover, but I thought I could at least mention them, and give you my first impressions.

If you have read any of these books, I'd love to hear what you think of them! Please leave a comment. 

Observation: none of these volumes mention compressive sensing, borehole seismic, microseismic, tight gas, or source rock plays. So I guess we can look forward to another batch in a year or two, when Cambridge realizes that people will probably buy anything with 3 or more of those words in the title. Even at $75 a go.


Quantitative Seismic Interpretation

Per Avseth, Tapan Mukerji and Gary Mavko (2005). Cambridge University Press, 408 pages, ISBN 978-0-521-15135-1. List price USD 91, $81.90 at Amazon.com, £45.79 at Amazon.co.uk

You have this book, right?

Every seismic interpreter that's thinking about rock properties, AVO, inversion, or anything beyond pure basin-scale geological interpretation needs this book. And the MATLAB scripts.

Rock Physics Handbook

Gary Mavko, Tapan Mukerji & Jack Dvorkin (2009). Cambridge University Press, 511 pages, ISBN 978-0-521-19910-0. List price USD 100, $92.41 at Amazon.com, £40.50 at Amazon.co.uk

If QSI is the book for quantitative interpreters, this is the book for people helping those interpreters. It's the Aki & Richards of rock physics. So if you like sums, and QSI left you feeling unsatisifed, buy this too. It also has lots of MATLAB scripts.

Seismic Reflections of Rock Properties

Jack Dvorkin, Mario Gutierrez & Dario Grana (2014). Cambridge University Press, 365 pages, ISBN 978-0-521-89919-2. List price USD 75, $67.50 at Amazon.com, £40.50 at Amazon.co.uk

This book seems to be a companion to The Rock Physics Handbook. It feels quite academic, though it doesn't contain too much maths. Instead, it's more like a systematic catalog of log models — exploring the full range of seismic responses to rock properies.

Practical Seismic Data Analysis

Hua-Wei Zhou (2014). Cambridge University Press, 496 pages, ISBN 978-0-521-19910-0. List price USD 75, $67.50 at Amazon.com, £40.50 at Amazon.co.uk

Zhou is a professor at the University of Houston. His book leans towards imaging and velocity analysis — it's not really about interpretation. If you're into signal processing and tomography, this is the book for you. Mostly black and white, the book has lots of exercises (no solutions though).

Seismic Amplitude: An Interpreter's Handbook

Rob Simm & Mike Bacon (2014). Cambridge University Press, 279 pages, ISBN 978-1-107-01150-2 (hardback). List price USD 80, $72 at Amazon.com, £40.50 at Amazon.co.uk

Simm is a legend in quantitative interpretation and the similarly lauded Bacon is at Ikon, the pre-eminent rock physics company. These guys know their stuff, and they've filled this superbly illustrated book with the essentials. It belongs on every interpreter's desk.

Seismic Data Analysis Techniques...

Enwenode Onajite (2013). Elsevier. 256 pages, ISBN 978-0124200234. List price USD 130, $113.40 at Amazon.com. £74.91 at Amazon.co.uk.

This is the only book of the collection I don't have. From the preview I'd say it's aimed at undergraduates. It starts with a petroleum geology primer, then covers seismic acquisition, and seems to focus on processing, with a little on interpretation. The figures look rather weak, compared to the other books here. Not recommended, not at this price.

NOTE These prices are Amazon's discounted prices and are subject to change. The links contain a tag that gets us commission, but does not change the price to you. You can almost certainly buy these books elsewhere. 

Geophysics at SciPy 2014

Wednesday was geophysics day at SciPy 2014, the conference for scientific Python in Austin. We had a mini-symposium in the afternoon, with 4 talks and 2 lightning talks about posters.

All the talks

Here's what went on in the session...

The talks should all be online eventually. For now, you can watch my talk and Joe's (awesome) talk right here...

And also...

There have been so many other highlights at this amazing conference that I can't resist sharing a couple of the non-geophysical gems...

Last thing... If you use the scientific Python stack in your work, please consider giving as generously as you can to the NumFOCUS Foundation. Support open source!

Looking forward to SciPy 2014

This week the Agile crew is at the SciPy conference in Austin, Texas. SciPy is a scientific library for the Python programming language, and the eponymous conference is the annual meetup for the physicists, astonomers, economists — and even the geophysicists! — that develop and use SciPy.

What is SciPy?

Python is an awesome high-level programming language. It's awesome because...

  • Python is free and open source.
  • Python is easy to learn and quite versatile.
  • Python has hundreds of great open source extensions, called libraries.
  • The Python ecosystem is actively developed by programmers at Google, Enthought, Continuum, and elsewhere.
  • Python has a huge and talkative user community, so finding help is easy.

All of these factors make it ideal for crunching and visualizing scientific data. The most important of these is NumPy, which provides efficient linear algebra operations — essential for handling big vectors and matrices. SciPy builds on NumPy to provide signal processing, statistics, and optimization. There are other packages in the same ecosystem for plotting, data management, and so on.

If you follow this blog, you know we have been getting into code lately. We think that languages like Python, GNU Octave, and R (a stastical language) are a core competency for geoscientists. That's why we want to help geoscientists learn Python, and why we organize hackathons, and why we keep going on about it on the blog.

What's going on in Austin?

Technical organizers Katy Huff and Serge Rey have put together a fantastic schedule including 2 days of tutorials (already underway), 3 days of technical talks and posters, and 2 days of sprints (focused coding sessions). Interspersed throughout the talk days are 'Birds of a Feather' meetups for various special-interest groups, and more social gatherings. It's exactly what a scientific conference should be: active learning, content, social, hacking, and unstructured discussion.

Here are some of the things I'm most looking forward to:

If you're interested in hearing about what's going on in this corner of the geophysical and scientific computing world, tune in this week to read more. We'll be posting regularly to the blog, or you can follow along on the #SciPy2014 Twitter hashtag.

Well tie calculus

As Matt wrote in March, he is editing a regular Tutorial column in SEG's The Leading Edge. I contributed the June edition, entitled Well-tie calculus. This is a brief synopsis only; if you have any questions about the workflow, or how to get started in Python, get in touch or come to my course.


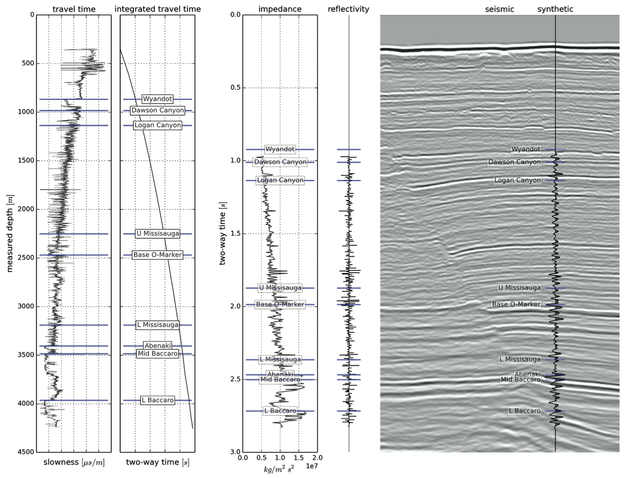
Synthetic seismograms can be created by doing basic calculus on traveltime functions. Integrating slowness (the reciprocal of velocity) yields a time-depth relationship. Differentiating acoustic impedance (velocity times density) yields a reflectivity function along the borehole. In effect, the integral tells us where a rock interface is positioned in the time domain, whereas the derivative tells us how the seismic wavelet will be scaled.

This tutorial starts from nothing more than sonic and density well logs, and some seismic trace data (from the #opendata Penobscot dataset in dGB's awesome Open Seismic Repository). It steps through a simple well-tie workflow, showing every step in an IPython Notebook:

  1. Loading data with the brilliant LASReader
  2. Dealing with incomplete, noisy logs
  3. Computing the time-to-depth relationship
  4. Computing acoustic impedance and reflection coefficients
  5. Converting the logs to 2-way travel time
  6. Creating a Ricker wavelet
  7. Convolving the reflection coefficients with the wavelet to get a synthetic
  8. Making an awesome plot, like so...

Final thoughts

If you find yourself stretching or squeezing a time-depth relationship to make synthetic events align better with seismic events, take the time to compute the implied corrections to the well logs. Differentiate the new time-depth curve. How much have the interval velocities changed? Are the rock properties still reasonable? Synthetic seismograms should adhere to the simple laws of calculus — and not imply unphysical versions of the earth.


Matt is looking for tutorial ideas and offers to write them. Here are the author instructions. If you have an idea for something, please drop him a line.

Fibre optic seismology at #GeoCon14

We've been so busy this week, it's hard to take time to write. But for the record, here are two talks I liked yesterday at the Canada GeoConvention. Short version — Geophysics is awesome!

DAS good

Todd Bown from OptaSense gave an overview of the emerging applications for distributed acoustic sensing (DAS) technology. DAS works by shining laser pulses down a fibre optic cable, and measuring the amount of backscatter from impurities in the cable. Tiny variations in strain on the cable induced by a passing seismic wave, say, are detected as subtle time delays between light pulses. Amazing.

Fibre optic cables aren't as sensitive as standard geophone systems (yet?), but compared to conventional instrumentation, DAS systems have several advantages:

  • Deployment is easy: fibre is strapped to the outside of casing, and left in place for years.
  • You don't have to re-enter and interupt well operations to collect data.
  • You can build ultra-long receiver arrays — as long as your spool of fibre.
  • They are sensitive to a very broad band of signals, from DC to kilohertz.

Strain fronts

Later in the same session, Paul Webster (Shell) showed results from an experiment that used DAS as a fracture diagnosis tool. That means you can record for minutes, hours, even days; if you can cope with all that data. Shell has accumulated over 300 TB of records from a handful of projects, and seems to be a leader in this area.

By placing a cable in one horizontal well in order to listen to the frac treatment from another, the cable can effectively designed to record data similar to a conventional shot gather, except with a time axis of 30 minutes. On the gathers he drew attention to slow-moving arcuate events that he called strain fronts. He hypothesized a number of mechanisms that might cause these curious signals: the flood of fracking fluids finding their way into the wellbore, the settling and closing creep of rock around proppant, and so on. This work is novel and important because it offers insight into the mechanical behavoir of engineered reservoirs, not just during the treatment, but long after.

Why is geophysics awesome? We can measure sound with light. A mile underground. That's all.

Calibrate your seismic intuition

On Tuesday we announced our new web app, modelr.io. Why are we so excited about it? 

  • We love the idea that subsurface software can cost dollars, not 1000's of dollars. 
  • We love the idea of subsurface software being online, not on the desktop.
  • We love the idea that subsurface software can be open source. Here's our code!
  • We love the idea of subsurface software that doesn't need a manual to master.
  • We love the idea of subsurface software that runs on a tablet or a phone.
  • We see software as an important way to share knowledge and connect people.

OK, that's enough reasons. There are more. Those are the main ones.

The point is: we love these ideas. And we hope that you, dear reader, at least like some of them a bit. Because we really want to keep developing modelr. We think it can be awesome. Imagine 3D earth models, imagine full waveform modeling, imagine gravity and magnetic models. We get very excited when we think about all the possiblities. There's no better way to calibrate your seismic intuition than modeling, and modelr is a great place to start modeling. 

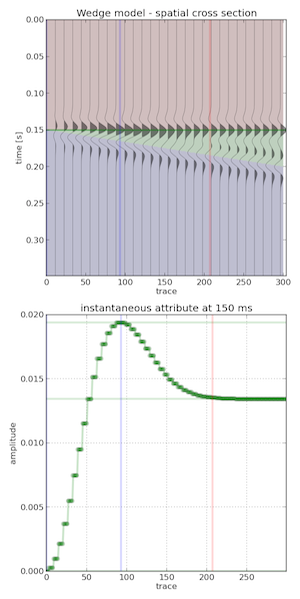
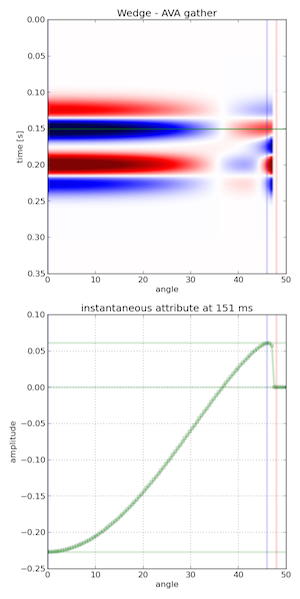
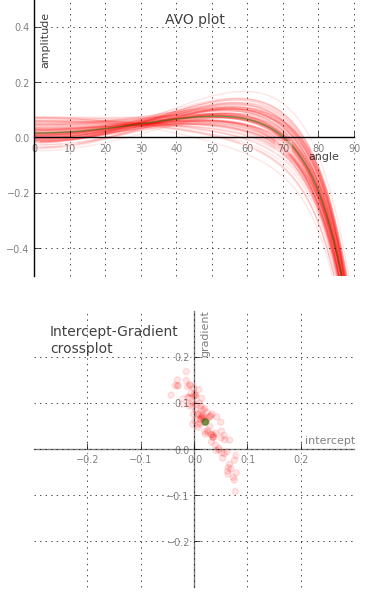
Here's a challenge: take 3 minutes and see if you can generate...

 A wedge model & tuning curve An AVA gather for a Class 4 sand    A stochastic AVA crossplot          

 modelr seismic wedge modelmodelr seismic avo modelmodelr stochastic avo  model

The most important thing nobody does

A couple of weeks ago, we told you we were up to something. Today, we're excited to announce modelr.io — a new seismic forward modeling tool for interpreters and the seismically inclined.

Modelr is a web app, so it runs in the browser, on any device. You don't need permission to try it, and there's never anything to install. No licenses, no dongles, no not being able to run it at home, or on the train.

Later this week, we'll look at some of the things Modelr can do. In the meantime, please have a play with it.
Just go to modelr.io and hit Demo, or click on the screenshot below. If you like what you see, then think about signing up — the more support we get, the faster we can make it into the awesome tool we believe it can be. And tell your friends!

If you're intrigued but unconvinced, sign up for occasional news about Modelr:

This will add you to the email list for the modeling tool. We never share user details with anyone. You can unsubscribe any time.

6 questions about seismic interpretation

This interview is part of a series of conversations between Satinder Chopra and the authors of the book 52 Things You Should Know About Geophysics (Agile Libre, 2012). The first three appeared in the October 2013 issue of the CSEG Recorder, the Canadian applied geophysics magazine, which graciously agreed to publish them under a CC-BY license.


Satinder Chopra: Seismic data contain massive amounts of information, which has to be extracted using the right tools and knowhow, a task usually entrusted to the seismic interpreter. This would entail isolating the anomalous patterns on the wiggles and understanding the implied subsurface properties, etc. What do you think are the challenges for a seismic interpreter?

Evan Bianco: The challenge is to not lose anything in the abstraction.

The notion that we take terabytes of prestack data, migrate it into gigabyte-sized cubes, and reduce that further to digitized surfaces that are hundreds of kilobytes in size, sounds like a dangerous discarding of information. That's at least 6 orders of magnitude! The challenge for the interpreter, then, is to be darn sure that this is all you need out of your data, and if it isn't (and it probably isn't), knowing how to go back for more.

SC: How do you think some these challenges can be addressed?

EB: I have a big vision and a small vision. Both have to do with documentation and record keeping. If you imagine the entire seismic experiment upon a sort of conceptual mixing board, instead of as a linear sequence of steps, elements could be revisited and modified at any time. In theory nothing would be lost in translation. The connections between inputs and outputs could be maintained, even studied, all in place. In that view, the configuration of the mixing board itself becomes a comprehensive and complete history for the data — what's been done to it, and what has been extracted from it.

The smaller vision: there are plenty of data management solutions for geospatial information, but broadcasting the context that we bring to bear is a whole other challenge. Any tool that allows people to preserve the link between data and model should be used to transfer the implicit along with the explicit. Take auto-tracking a horizon as an example. It would be valuable if an interpreter could embed some context into an object while digitizing. Something that could later inform the geocellular modeler to proceed with caution or certainty.

SC: One of the important tasks that a seismic interpreter faces is the prediction about the location of the hydrocarbons in the subsurface.  Having come up with a hypothesis, how do you think this can be made more convincing and presented to fellow colleagues?

EB: Coming up with a hypothesis (that is, a model) is solving an inverse problem. So there is a lot of convincing power in completing the loop. If all you have done is the inverse problem, know that you could go further. There are a lot of service companies who are in the business of solving inverse problems, not so many completing the loop with the forward problem. It's the only way to test hypotheses without a drill bit, and gives a better handle on methodological and technological limitations.
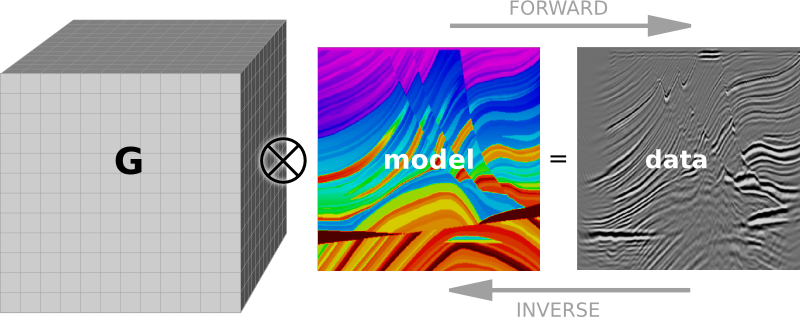
SC: You mention "absolving us of responsibility" in your article.  Could you elaborate on this a little more? Do you think there is accountability of sorts practiced in our industry?

EB: I see accountability from a data-centric perspective. For example, think of all the ways that a digitized fault plane can be used. It could become a polygon cutting through a surface on map. It could be a wall within a geocellular model. It could be a node in a drilling prognosis. Now, if the fault is mis-picked by even one bin, this could show up hundreds of metres away, depending on the dip of the fault, compared to the prognosis. Practically speaking, accounting for mismatches like this is hard, and is usually done in an ad hoc way, if at all. What caused the error? Was it the migration or was it the picking? Or what about the error in the measurement of the drill-bit? I think accountability is loosely practised at best because we don't know how to reconcile all these competing errors.

Until data can have a memory, being accountable means being diligent with documentation. But it is time-consuming, and there aren’t as many standards as there are data formats.

SC: Declaring your work to be in progress could allow you to embrace iteration.  I like that. However, there is usually a finite time to complete a given interpretation task; but as more and more wells are drilled, the interpretation could be updated. Do you think this practice would suit small companies that need to ensure each new well is productive or they are doomed?

EB: The size of the company shouldn't have anything to do with it. Iteration is something that needs to happen after you get new information. The question is not, "do I need to iterate now that we have drilled a few more wells?", but "how does this new information change my previous work?" Perhaps the interpretation was too rigid — too precise — to begin with. If the interpreter sees her work as something that evolves towards a more complete picture, she needn't be afraid of changing her mind if new information proves us to be incorrect. Depth migration, for example, exemplifies this approach. Hopefully more conceptual and qualitative aspects of subsurface work can adopt it as well.

SC: The present day workflows for seismic interpretation for unconventional resources demand more than the usual practices followed for the conventional exploration and development.  Could you comment on how these are changing?

EB: With unconventionals, seismic interpreters are looking for different things. They aren't looking for reservoirs, they are looking for suitable locations to create reservoirs. Seismic technologies that estimate the state of stress will become increasingly important, and interpreters will need to work in close contact to geomechanics. Also, microseismic monitoring and time-lapse technologies tend to push interpreters into the thick of the operations, which allow them to study how the properties of the earth change according to operations. What a perfect place for iterative workflows.


You can read the other interviews and Evan's essay in the magazine, or buy the book! (You'll find it in Amazon's stores too.) It's a great introduction to who applied geophysicists are, and what sort of problems they work on. Read more about it. 

Join CSEG to catch more of these interviews as they come out. 

To make a wedge

We'll need a wavelet like the one we made last time. We could import it, if we've made one, but SciPy also has one so we can save ourselves the trouble. Remember to put %pylab inline at the top if using IPython notebook.

import numpy as np
from scipy.signal import ricker
import matplotlib.pyplot as plt

Now we need to make a physical earth model with three rock layers. In this example, let's make an acoustic impedance earth model. To keep it simple, let's define the earth model with two-way-travel time along the vertical axis (as opposed to depth). There are number of ways you could describe a wedge using math, and you could probably come up with a way that is better than mine. Here's a way:

nsamps, ntraces = [600, 500]
rock_names = ['shale 1', 'sand', 'shale 2']
rock_grid = np.zeros((n_samples, n_traces))

def make_wedge(n_samples, n_traces, layer_1_thickness, start_wedge, end_wedge):
    for j in np.arange(n_traces): 
        for i in np.arange(n_samples):      
            if i <= layer_1_thickness:      
rock_grid[i][j] = 1 if i > layer_1_thickness:
rock_grid[i][j] = 3 if j >= start_wedge and i - layer_1_thickness < j-start_wedge:
rock_grid[i][j] = 2 if j >= end_wedge and i > layer_1_thickness+(end_wedge-start_wedge):
rock_grid[i][j] = 3 return rock_grid

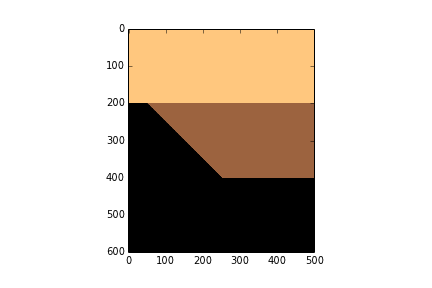
Let's insert some numbers into our wedge function and make a particular geometry.

layer_1_thickness = 200
start_wedge = 50
end_wedge = 250
rock_grid = make_wedge(n_samples, n_traces, 
            layer_1_thickness, start_wedge, 
            end_wedge)

plt.imshow(rock_grid, cmap='copper_r')

Now we can give each layer in the wedge properties.

vp = np.array([3300., 3200., 3300.]) 
rho = np.array([2600., 2550., 2650.]) 
AI = vp*rho
AI = AI / 10e6 # re-scale (optional step)

Then assign values assign them accordingly to every sample in the rock model.

model = np.copy(rock_grid)
model[rock_grid == 1] = AI[0]
model[rock_grid == 2] = AI[1]
model[rock_grid == 3] = AI[2]
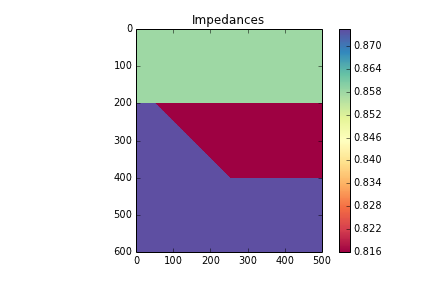
plt.imshow(model, cmap='Spectral')
plt.colorbar()
plt.title('Impedances')

Now we can compute the reflection coefficients. I have left out a plot of the reflection coefficients, but you can check it out in the full version in the nbviewer

upper = model[:-1][:]
lower = model[1:][:]
rc = (lower - upper) / (lower + upper)
maxrc = abs(np.amax(rc))

Now we make the wavelet interact with the model using convolution. The convolution function already exists in the SciPy signal library, so we can just import it.

from scipy.signal import convolve
def make_synth(f):
    synth = np.zeros((n_samples+len(t)-2, n_traces))
    wavelet = ricker(512, 1e3/(4.*f))
    wavelet = wavelet / max(wavelet)   # normalize
    for k in range(n_traces):
        synth[:,k] = convolve(rc[:,k], wavelet)
    synth = synth[ np.ceil(len(wavelet))/2 : -np.ceil(len(wavelet))/2, : ]
    return synth

Finally, we plot the results.

frequencies = array([5, 10, 15]) plt.figure(figsize = (15, 4)) for i in np.arange(len(frequencies)): this_plot = make_synth(frequencies[i]) plt.subplot(1, len(frequencies), i+1) plt.imshow(this_plot, cmap='RdBu', vmax=maxrc, vmin=-maxrc, aspect=1) plt.title( '%d Hz wavelet' % freqs[i] ) plt.grid() plt.axis('tight') # Add some labels for i, names in enumerate(rock_names): plt.text(400, 100+((end_wedge-start_wedge)*i+1), names, fontsize=14, color='gray', horizontalalignment='center', verticalalignment='center')


That's it. As you can see, the marriage of building mathematical functions and plotting them can be a really powerful tool you can apply to almost any physical problem you happen to find yourself working on.

You can access the full version in the nbviewer. It has a few more figures than what is shown in this post.

A day of geocomputing

I will be in Calgary in the new year and running a one-day version of this new course. To start building your own tools, pick a date and sign up:

Eventbrite - Agile Geocomputing    Eventbrite - Agile Geocomputing