To plot a wavelet

As I mentioned last time, a good starting point for geophysical computing is to write a mathematical function describing a seismic pulse. The IPython Notebook is designed to be used seamlessly with Matplotlib, which is nice because we can throw our function on graph and see if we were right. When you start your own notebook, type

ipython notebook --pylab inline

We'll make use of a few functions within NumPy, a workhorse to do the computational heavy-lifting, and Matplotlib, a plotting library.

import numpy as np
import matplotlib.pyplot as plt

Next, we can write some code that defines a function called ricker. It computes a Ricker wavelet for a range of discrete time-values t and dominant frequencies, f:

def ricker(f, length=0.512, dt=0.001):
    t = np.linspace(-length/2, (length-dt)/2, length/dt)
    y = (1.-2.*(np.pi**2)*(f**2)*(t**2))*np.exp(-(np.pi**2)*(f**2)*(t**2))
    return t, y

Here the function needs 3 input parameters; frequency, f, the length of time over which we want it to be defined, and the sample rate of the signal, dt. Calling the function returns two arrays, the time axis t, and the value of the function, y.

To create a 5 Hz Ricker wavelet, assign the value of 5 to the variable f, and pass it into the function like so,

f = 5
t, y = ricker (f)

To plot the result,

plt.plot(t, y)
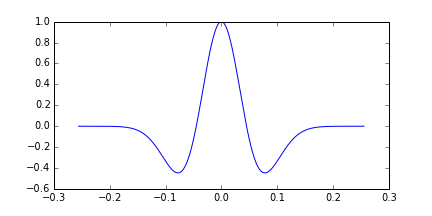
But with a few more commands, we can improve the cosmetics,

plt.figure(figsize=(7,4))
plt.plot( t, y, lw=2, color='black', alpha=0.5)
plt.fill_between(t, y, 0,  y > 0.0, interpolate=False, hold=True, color='blue', alpha = 0.5)
plt.fill_between(t, y, 0, y < 0.0, interpolate=False, hold=True, color='red', alpha = 0.5)

# Axes configuration and settings (optional)
plt.title('%d Hz Ricker wavelet' %f, fontsize = 16 )
plt.xlabel( 'two-way time (s)', fontsize = 14)
plt.ylabel('amplitude', fontsize = 14)
plt.ylim((-1.1,1.1))
plt.xlim((min(t),max(t)))
plt.grid()
plt.show()
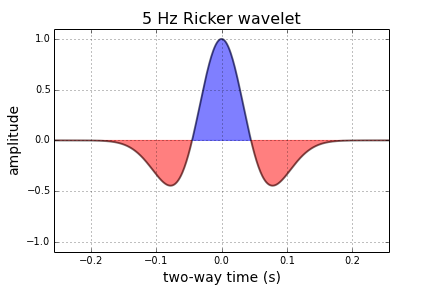
Next up, we'll make this wavelet interact with a model of the earth using some math. Let me know if you get this up and running on your own.

Let's do it

It's short notice, but I'll be in Calgary again early in the new year, and I will be running a one-day version of this new course. To start building your own tools, pick a date and sign up:

Eventbrite - Agile Geocomputing    Eventbrite - Agile Geocomputing

What we built at the weekend

10 days ago we wrapped up the Geophysics Hackathon in Houston. I wrote a bit about it right after the event, but now I've gathered the evidence and can share more of the awesome. First of all — what did everyone build in the 2 days? 

Team 1: Velocity modelling in iOS

Essau Worthy-Blackwell (Southwestern Energy), Jacob Foshee (independent iOS dev), Evan Bianco (Agile), and Ben Bougher (independent, mostly helping Agile) built 2 tools exploring velocity modelling and depth conversion. One was a desktop tool (in Python), the other was an iOS app — watch this.

Team 2: LAS soup demux

Joe Jennings (Colorado School of Mines), Mike Stone (Lukoil), and Karl Schleicher (University of Texas at Austin) built a tool in Python for coping with messy data. Karl is a champion of open data, and needs a tool for quickly exploring large repositories. You can see their progress in the code in GitHub — feel free to help them out!

Team 3: A 1D forward model

Duncan Child (Spectraseis) joined Chris Chalcraft, Paul Garossino, and James Alison from OpenGeoSolutions to help out with his pumped up Java and JSON wrangling skills. Greg Partyka even popped in to help. Here is Blockfilter in GitHub.

Everyone's a winner

As well as being a fun way to get to know people, and create something new together, the event was a (very low key) contest. We had some experienced and perceptive judges to pick some winners and decide how the exactly 3 prizes would be distributed among the exactly 3 teams:

  • Team 3 were awarded with some Raspberry Pi starter kits, to recognize their solid idea, well-constructed code, and respect for work-life balance (hey, it was the weekend!). It was fun peeking over their shoulders occasionally.

  • Team 2 had the most commercially viable product, and as such went away with 2 books: The Lean Startup by Eric Ries, and Business Model Generation by Alex Osterwalder. Thanks to sponsor SURGE Accelerator, the team also won the chance to talk to a business mentor about their ideas.

  • Team 1 delivered the shiniest product at the end of the weekend, with the iOS app and a desktop clone. They each won one of Google's latest Nexus 7 tablets, to continue with their app-building skills.

What will you build?

Thanks again to the daredevils who showed up, the judges — especially Maitri Erwin, who helped out in lots of ways all weekend — and of course the sponsors: OpenGeoSolutions, Enthought, and dGB Earth Sciences. If you missed the event, dear reader, I hope you'll come along next time to share ideas, test workflows, and build new things.

The future is uncertain

Image: Repsol, SEG. Click for the abstract.

SEG Day 2. In the session entitled Exploration and Uncertainty Analysis, I was underwhelmed with the few talks that I attended, except for the last one of the session entitled, Measuring time-map uncertainty

Static uncertainty

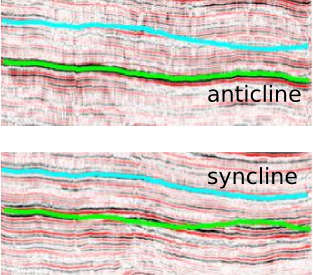
It is commonly uttered that different data processing companies will produce different results; seismic processing is non-unique, and so on. But rarely do I get to see real examples of the kind of variances that can occur. Bruce Blake from Repsol showed seismic imaging results that came back from a number of contractors. The results were truly shocking. The example he showed was an extreme case of uncertainty caused by inadequate static solutions caused by the large sand dunes in Libya. The key point for me is exemplified by the figure shown on the right: the image from one vendor suggests a syncline, the image from the other suggest an anticline. Beware!

A hole in the theory

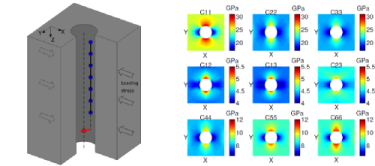
In the borehole sonic session, Xinding Fang, a student from MIT, reinforced a subtle but profound idea: it is tricky to measure the speed of sound in a rock when you drill a hole into it. The hole changes the stress field, and induces an anisotropic stiffness around the circumference of the borehole where sonic tools make their measurements. And since waves take the shortest travel path from source to receiver, speeds that are measured in the presence of an artificial stress are wrong.

Image: Xindang Fang, SEG. Click for the abstract.

The bigger issue here that Xinding has elucidated is that we routinely use sonic logs to make time-depth relationships and tie wells, especially in the absence of a check-shot survey. If it works, it works, but if ever discrepancies exists between seismic and well, the interpreter applies a stretch or a squeeze without much thought. Some may blame the discrepancy on dispersion alone, but that's evidently too narrow. Indeed, we rarely bother to investigate the reasons.

There's a profound point here. We have to drop the assumption that logs are the 'geological' truth upon which to hang an interpretation. We have to realize that the act of making the measurement changes the very thing we want to measure. 

Past, present, future SEG

Today was the first day of the SEG Annual Meeting in Houston. 

Last night we wandered around the icebreaker, still buzzing from the hackathon. The contrast was crushing. The exhibition is gigantic — it's an almost overwhelming amount of marketing. My thoughts on what the exhibition hall is, and what it represents, are not fully formed and might be a bit... ranty, so I will save them for a more considered post. 

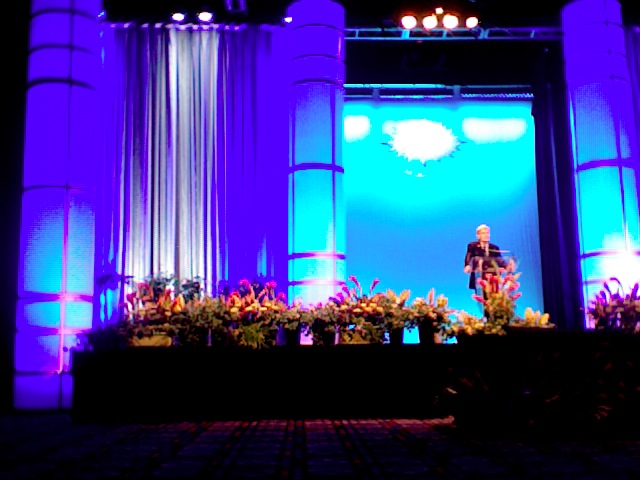
As usual, SEG kicked off with a general session — much better attended this year, but also much less ambitious. At least 300 members came to hear outgoing president David Monk's perspective on SEG's future. His address mostly looked backwards, however, at the trends over the last few years. I guess the idea is to extrapolate from there... But maybe we can do even better than recent years? We mustn't forget to do completely new and unexpected things too. 

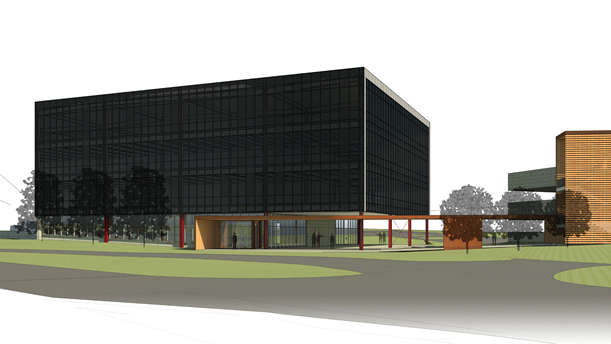
At the end of his slot, Monk showed some animated renderings of SEG's new building in Tulsa. The movie was accompanied by an almost comically strident anthem — evidently it is a big deal. As well as having a smart new office, the real estate will turn in some smart new revenue from other tenants. Ground was broken on Friday, and the opening is expected to be in December 2014. As you see, the architects understood industrial geophysics quite well, opting for a large black box

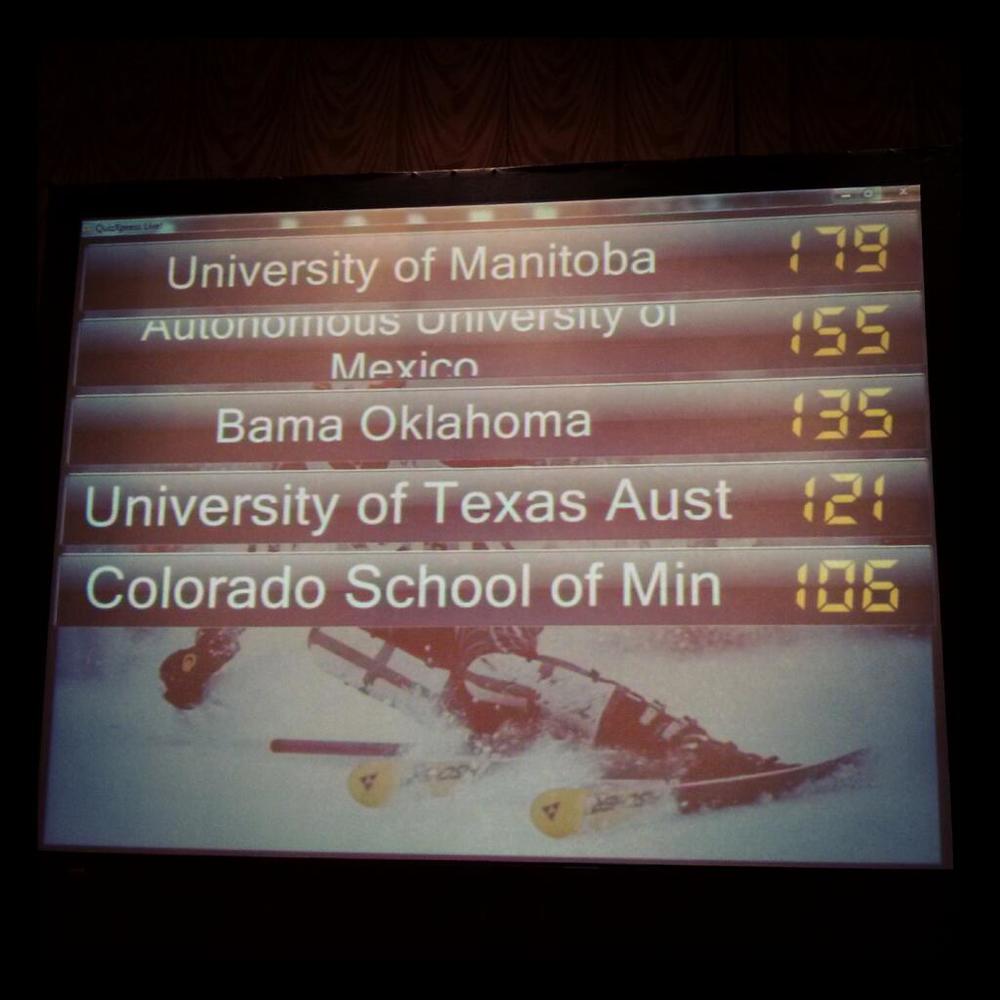
At the end of the day, Canada strode home to yet another SEG Challenge Bowl victory as the University of Manitoba fought off the Autonomous University of Mexico and Colorado School of Mines to prove that, while Texas might be the home of the industry, Canada is the home of exploration geophysics. 

Where's all the geophysics? Evan is compiling some technical highlights from the day as I type. Stay tuned for that. 

If you're at the conference, tell us what you've enjoyed most about the first 24 hours.

Garage geoscience

The Geophysics Hackathon 2013 is over. It was awesome. You should have been there.

The backers

I didn't make a big effort to find sponsors, because I didn't need to — just like the participants, they self-select. dGB Earth Sciences, Enthought, and OpenGeoSolutions are the leaders in the business of open geophysical software. Their support and encouragement means a lot to me personally, and is having a huge impact on our community. Please support them when you have the chance. We need companies like these.

The hackers

There was not too much of a plan. We were keen to allow organic collaboration to happen. So the hackers arrived on Saturday morning, and spent an hour or two matching projects to interests and skills. They settled down to work at about 10:30, and the creative buzz in the room was palpable.

The projects that emerged were:

  • Data viewers for amorphous well data masses, addressing uncertainty due to data disorganization
  • A seismic signal processing sandbox in the web browser, addressing resolution uncertainty
  • Mobile and desktop apps for on-the-fly time–depth transformation, with error bars

On Sunday we ended up in START Houston's garage space, with the doors open to the beautiful fall morning. It had the ambience of a picnic. A sunny Sunday morning with cinnamon coffee, breakfast tacos, Python, and geophysics — what more could you ask for?

The geeks among you might be interested to know what sort of hardware the hacking geophysicists were developing their ideas on. Turns out it was perfectly evenly distributed: 4 each of Mac, Windows, and Linux. Of the Linux distros, there was 1 each of Centos, Ubuntu, crunchbang, and OpenSuse.

At the request of Chris Chalcraft, I also did an impromptu poll of code editor software. This was similarly diverse:

The other backers

Chris Krohn has been a true champion of the event. On Saturday, she brought new SEG president-elect Chris Liner to visit the event — his natural curiosity and enthusiasm are infectious, and lifted everyone present. I hope he's able to realize some of his vision during his presidency. (You do read his blog, right?)

Today she returned with Dennis Cooke and Peter Annan. They all graciously acted as judges. The other judges were Paul de Groot and Eric Jones, two of our generous sponsors, and Maitri Erwin, one of Agile's closest friends. Though they couldn't stick around, we also had visits from Zane Jobe and Joe Dellinger — much appreciated votes of support.

We'll be blogging about the SEG Annual Meeting all week... when the dust has settled a bit, we'll tell you more about the projects the hackers built. It's amazing what you can do in 2 days.

Looking forward to SEG 2013

The SEG Annual Meeting is coming! The program starts tomorrow with the DISC, and continues over the weekend with various other courses. It's not part of the conference, but we're looking forward to the Geophysics Hackathon, obviously. Curious? You're welcome to drop in.

The meeting boasts 124 technical sessions totalling over 1000 PowerPoint presentations. If you haven't looked at the list of expanded abstracts yet, I can't blame you, it's a massive amount of content and the website experience is, er, not optimal — and there's no helpful mobile app this year. [Update: The app came out today! Go get it, it's essential. Thank you Whitney at SEG for letting us know.] I've tried to pick out a few sessions that seem really exciting below.

Worst. App. Ever.Each day at 10:30 am, I will be doing a guest presentation at the Enthought booth, showing some novel geophysics tools that I've been making. They are powered by Python and Enthought's Canopy environment. Come by and I will show you that you can too! However, I need somebody to please go to this exhibition booth 'browser' and show me where the Enthought booth is. Worst. App. Ever.

And each day at 11 am, there's a 2-hour mini-wikithon. Stop by the Press Room for a quick tour of SEG Wiki, and find out how you can help make it better.

Monday

With no technical presentations on Monday morning, it is safe to assume that most delegates will be wandering around the exhibition hall. A few may trickle over to the unenticing Opening Session which Matt and I found was horribly attended last year and the year before. Matt at least will be there, mostly out of morbid curiosity.

Continuing the Hackathon's theme on error and uncertainty, I will be diving into the session on Monday afternoon called

From 3-6 pm be sure to check out the always popular SEG Student Challenge Bowl. The global finals, are hosted by the crowd-pleasing past SEG president (and fellow Canadian) Peter Duncan. Top pairings from Universities across the world duking it out in a button-pushing quiz show. Come out, cheer on the students and test your own geophysics trivia from the audience.

Tuesday

The sessions that look appealing to me on Tuesday are

Wednesday

Agile's good friend Maitri Erwin is the instigator behind the Women's Networking Breakfast. All are welcome; consider yourself lucky to connect with Maitri. As for talks, I will try make an appearance at

The first one I know quite a bit about, but can always use a refresher, and the second one I know very little about, but it's been a hot topic for 3 or 4 years now. If we aren't worn out at the end of the day, we might find some tickets to the Bayou Bash.

Thursday & Friday

There are over a dozen workshops on both Thursday and Friday. As far as I can tell, they are basically more talks, each around a central theme. Don't ask me how this is in any way distinguishable from the technical program, and there is still a full suite of technical sessions conflicting on Thursday morning. It's a shame because I'm curious to attend the session Fractures, shale and well-log characterization but I don't want to miss Workshop 2, Grand challenges, which takes place all day on Thursday. Then on Friday there's Characterizing fractures (Workshop 15).

There are many other events going on, so if you see something good, make sure you tweet the rest of us about it: @EvanBianco, @kwinkunks, @maitri, @toastar, and lots of others — follow hashtag #SEG13. (Not #SEG2013, that's all marketing wonks).

If you'll be at the Annual Meeting, do look out for us, we'd love to meet you. If you won't be there, tell us what you'd like to hear about. News from the exhibition? Our favourite talks? Detailed minutes from the committee meetings? Let us know in the comments.

Ten ways to make a difference

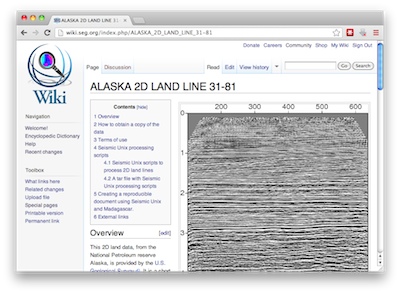
SEG WikiAfter reading my remarks yesterday about geoscience wikis, perhaps you're itching to share some of what you know. Below are ten quick ways to get started. And if you're going to SEG next week, you're in luck: you'll find a quick way to get started. 

Ten things you can do

First, if you really just want to dive in, here are ten easy things you can do in almost any wiki. Let's use SEG Wiki as an example — but this applies equally well to SubSurfWiki, PetroWiki, or Wikipedia.

  1. Read it — find a page or category that interests you, and start exploring the content
  2. Edit it — nothing tricky, but if you find a typo or other small error, hit Edit and fix it (you can do this without logging in on Wikipedia, but most other wikis require you to make an account first. This isn't usually a deliberate effort to put you off — allowing anonymous editing results in an amazing amount robot spam. Yes, robot spam.)
  3. Share it — like most of the web, wikis need to be shared to survive. When you find something useful, share it.
  4. Add a profile — if you're an SEG member, you already have an account on SEG Wiki. Why not add some info about yourself? Go log in to SEG.org then click this link. Here's mine
  5. Add a sandbox — Edit your user page, add this: [[/Sandbox/]], then save your page. You'll see a red link. Click on it. Try some editing — you can do anything you like here. Again, here's mine — click Edit and copy my code. 
  6. Fix equations — most of the equations in the SEG Encyclopedic Dictionary are poorly formatted. If you know LaTeX, you can help fix them. Here's one that's been fixed. Here's a bad one (if it looks OK, someone beat you to it :)
  7. Add references — Just like technical papers, wikis need citations and references if they are to be useful and trusted. Most articles in SEG Wiki have citations, but the references are on another page. Here's one I've fixed. 
  8. Add a figure — Again, the figures are mostly divorced from their articles. The Q article shows one way to integrate them. Some articles have lots of figures. 
  9. Improve a definition — Many of the Dictionary definitions are out of date or unhelpfully terse. Long articles probably belong in the 'main' namespace (that is, not the Dictionary part) — so for example I split Spectral decomposition into a main article, apart from the short dictionary definition.
  10. Add an article — This may seem like a big step, but don't be shy. Be bold! We can worry later if the new article needs to be split or combined or renamed or reformatted. The point is to start.

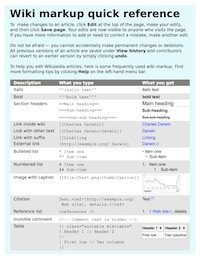
Wiki markup takes a little getting used to, but you can get a very long way with a little know-how. This wiki markup cheatsheet will give you a head start.

One place you can start

SEG Annual MeetingAt the SEG Annual Meeting next week, I'll be hanging about the Press Room from 11 am till 1 pm every day, with John Stockwell, Karl Schleicher and some other wiki enthusiasts. We'd be happy to answer any questions or help you get started.

Bring your laptop! Spread the word! Bring a friend! See you there!

Seismic quality traffic light

We like to think that our data are perfect and limitless, because experiments are expensive and scarce. Only then can our interpretations hope to stand up to even our own scrutiny. It would be great if seismic data was a direct representation of geology, but it never is. Poor data doesn't necessarily mean poor acquisition or processing. Sometimes geology is complex!

In his book First Steps in Seismic Interpretation, Don Herron describes a QC technique of picking a pseudo horizon at three different elevations to correspond to poor, fair, and good data regions. I suppose that will do in a pinch, but I reckon it would take a long time, and it is rather subjective. Surely we can do better?

Computing seismic quality

Conceptually speaking, the ease of interpretation depends on things we can measure (and display), like coherency, bandwidth, amplitude strength, signal-to-noise, and so on. There is no magic combination of filters that will work for all data, but I am convinced that for every seismic dataset there is a weighted function of attributes that can be concocted to serve as a visual indicator of the data complexity:

So one of the first things we do with new data at Agile is a semi-quantitative assessment of the likely ease and reliability of interpretation.

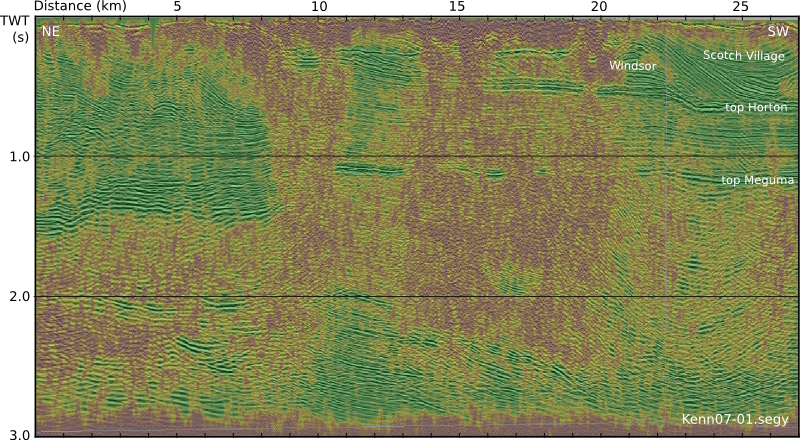
This traffic light display of seismic data quality, corendered here with amplitude, is not only a precursor to interpretation. It should accompany the interpretation, just like an experiment reporting its data with errors. The idea is to show, honestly and objectively, where we can trust eventual interpretations, and where they not well constrained. A common practice is to cherry pick specific segments or orientations that support our arguments, and quietly suppress those that don't. The traffic light display helps us be more honest about what we know and what we don't — where the evidence for our model is clear, and where we are relying more heavily on skill and experience to navigate a model through an area where the data is unclear or unconvincing.

Capturing uncertainty and communicating it in our data displays is not only a scientific endeavour, it is an ethical one. Does it change the way we look at geology if we display our confidence level alongside? 

Reference

Herron, D (2012). First Steps in Seismic Interpretation. Geophysical Monograph Series 16. Society of Exploration Geophysicists, Tulsa, OK.

The seismic profile shown in the figure is from the Kennetcook Basin, Nova Scotia. This work was part of a Geological Survey of Canada study, available in this Open File report.

Invitation to a geophysics hackathon

Do you like to build things? Join us for two days of scientific software creation. We'll be in Houston on 21 & 22 September, right before the SEG Annual Meeting, building web and mobile apps to attack one of the unsolved problem themes we exposed in Calgary in May — error and uncertainty

Let's build something together

What displays, or calculators, or simulators, could you dream up to help understand, or compute, or visualize, or communicate, or reduce error and uncertainty in your work? How about stochastic synthetics? Well logs with error bars? Fuzzy inversion?

You don't have to be a programmer — teams need ideas, they need science, they need design, and they need presentation skills. Please bring your creativity and your courage. Bring whatever you have, but mainly your brain

I'm in, what now? 

If want to take part, sign up at hackathon.io. If you have an idea already, start a project there. We are still filling in some blanks but can say that the event will be in downtown Houston, starting at 9 am on Saturday 21 Sept and running till 6 pm on Sunday 22 Sept. It will be free for students; there will probably be a small fee for professionals. We can only take 8 teams, so get in early and be sure not to miss out! 

If you'd like to help make this event happen, we'd love to have you as a sponsor for the event. The two main opportunities for sponsorship are the catering, and the prizes, but we're open to ideasDrop us a line.

Last thing: Please share this post with someone you know who loves to make things. Or help spread us on social media with the hashtag #geophysicshack. Cheers!

Great geophysicists #8: d'Alembert


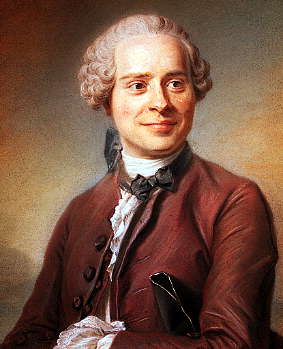
Jean-Baptiste le Rond d'Alembert was a French mathematician, born on 16 or 17 November 1717 in Paris, and died on 29 October 1783, also in Paris. His father was an artillery officer, but his mother was much more interesting. Having been a nun, she sought papal dispensation in 1714 for a new career as a fun-loving socialite, benefiting from the new government banknote printing scheme of John Law. She left her illegitimate child on the steps of Église St Jean Le Rond de Paris, whence he was taken to an orphanage. When his father returned from duty, he arranged for the boy's care.

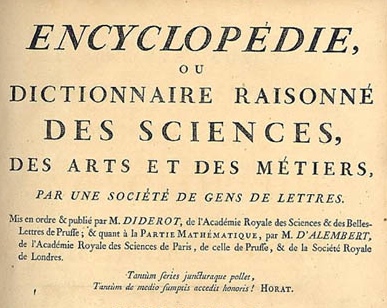
Perhaps d'Alembert's greatest contribution to the world was helping Denis Diderot 'change the way people think' by editing the great Encyclopédie, ou Dictionnaire raisonné des sciences, des arts et des métiers of 1751. There were many contributors, but d'Alembert was listed as co-editor on the title page (left). This book was an essential ingredient in spreading the Enlightenment across Europe, and d'Alembert was closely involved in the project for at least a decade. 

But that's not why he's in our list of great geophysicists. As I mentioned when I wrote about Euler, d'Alembert substantially progressed the understanding of waves, making his biggest breakthrough in 1747 in his work on vibrating strings. His paper was the first time the wave equation or its solution had appeared in print:

Though Euler and d'Alembert corresponded on waves and other matters, and strongly influenced each other, they eventually fell out. For example, Euler wrote to Lagrange in 1759:

d'Alembert has tried to undermine [my solution to the vibrating strings problem] by various cavils, and that for the sole reason that he did not get it himself... He thinks he can deceive the semi-learned by his eloquence. I doubt whether he is serious, unless perhaps he is thoroughly blinded by self-love. [See Morris Kline, 1972]

D'Alembert did little mathematics after 1760, as he became more involved in other academic matters. Later, ill health gradually took over. He lamented to Lagrange (evidently an Enlightenment agony aunt) in 1777, six years before his death:

What annoys me the most is the fact that geometry, which is the only occupation that truly interests me, is the one thing that I cannot do. [See Thomas Hankins, 1970]

I imagine he died feeling a little hollow about his work on waves, unaware of the future impact it would have—not just in applied geophysics, but in communication, medicine, engineering, and so on. For solving the wave equation, d'Alembert, we salute you.

References

Read more on Wikipedia and The MacTutor History of Mathematics.

D'Alembert, J-B (1747). Recherches sur la courbe que forme une corde tenduë mise en vibration. (Researches on the curve that a tense cord forms [when] set into vibration.) Histoire de l'académie royale des sciences et belles lettres de Berlin, vol. 3, pages 214–219. Read on Google Books, with its sister paper, 'Further researches...'.

Portrait is a pastel by Maurice Quentin de La Tour, 1704–88.