Tools for drawing geoscientific figures

This is a response to Boyan Vakarelov's useful post on LinkedIn about tools for creating geological figures. I especially liked his SketchUp tip.

It's a while since we wrote about our toolset, so I thought I'd document what we're currently using for making figures. You won't be surprised to hear that they're mostly open source. 

Our figure creation toolbox

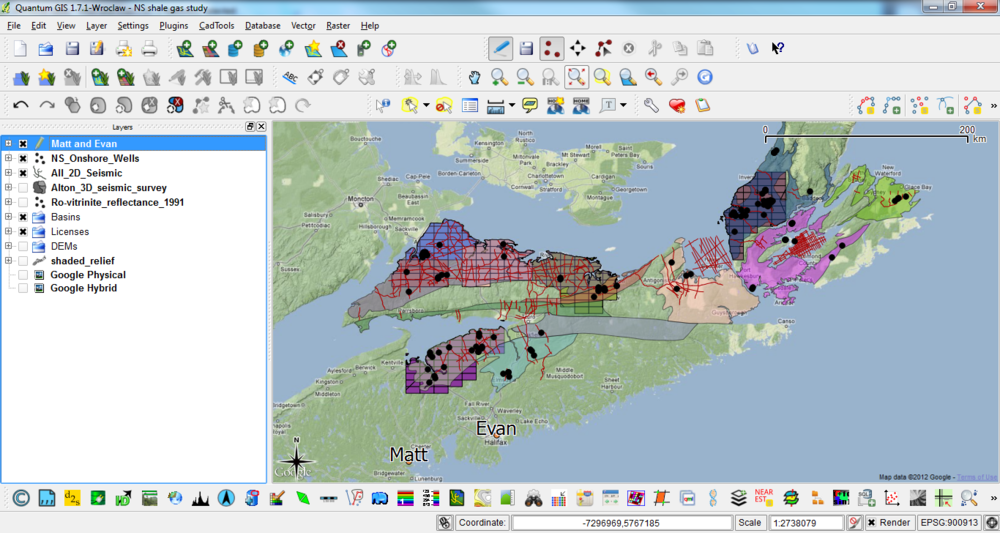
  • QGIS — if it's a map, you should make it in a GIS, it's as simple as that.
  • Inkscape — for most drawing and figure creation tasks. It's just as good as Illustrator.
  • GIMP — for raster editing tasks. Rasters are no good for editable figures or line art though.
  • TimeScale Creator — a little-known tool for making editable chronostratigraphic columns. Here's an example from way back on this very blog. The best thing: you can export SVG files, then edit them in Inkscape.
  • Python, R, etc. — the best way to make reproducible scientific figures is not to draw them at all. Instead, create data visualizations programmatically.

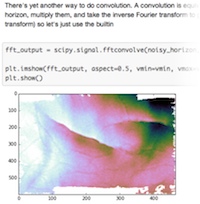
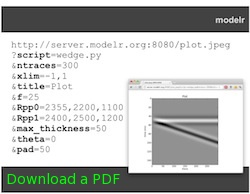
To really appreciate how fantastic the programmatic approach is, check out Sergey Fomel's treasure trove of reproducible documents, in which every figure is really just the output of a little program that anyone can run. Here's one of my own, adapted from a previous post and a sneak peek of an upcoming Leading Edge tutorial:

Different sample interpolation styles give different amplitudes for inter-sample positions, as shown at the red 'horizon' time pick. From upcoming tutorial in the April edition of The Leading Edge

Everything you wanted to know about images

Screenshots often form part of a figure, because they're so much easier than trying to figure out how to export an image, or trying to wrangle the data from scratch. If you find yourself grabbing a screenshot, and any time you're providing an image for someone else — especially if it's destined for print — you need to know all about image resolution. Read my post Save the samples for my advice. 

If you still save your images as JPEG, you also need to read my post about How to choose an image format. One day you might need the fidelity you are throwing away! Here's the short version: save everything as a PNG.

Last thing: know the difference between vector and raster graphics. Make vectors when you can.

Stop using PowerPoint!

The only bit of Boyan's post I didn't like was the bit about PowerPoint. I admit, fifteen years ago I was a bit of a slave to PowerPoint. I'd have preferred to use Illustrator at the time, but it was well beyond corporate IT's ken, and I hadn't yet discovered Inkscape. But I'm over it now — and just as well because it's a horrible drawing tool. The main limitation is not having layers, which is a show-stopper for me, but there's also the generic typography, simplistic spline editing, the inability to handle standard formats like SVG, and no scripting or plug-ins.

Getting good

If you want to learn about making effective scientific figures, I strongly recommend reading anything you can by Edward Tufte, Robert Kosara, Alberto Cairo, and Mike Bostock. For some quick inspiration check out the #dataviz hashtag on Twitter, or feast your eyes on this amazing collection of graphics, or Mike Bostock's interactive examples, or... there are too many resources to choose from.

How about you? Share your favourite tools in the comments or on Boyan's post.

Ask your employer about being more awesome

Opensource.gif

Open source software needs money to survive. If you work at a corporation with a positive bottom line, and you use open source software to help you maintain it, I'd urge you to consider asking your organization to help out. You can't imagine the difference it makes — these projects take serious resources to run: server hardware, infrastructure maintenance, professional developers, research and development, legal and marketing functions, educational outreach, work in developing countries,... just like commercial, closed-source, black-or-at-least-dark-grey-box software. 

(Come to think of it, the only thing they don't have is sales personnel driving to golf courses in a BMW 5 series. How many of those have you paid for with those license fees?)

Which projects need your company's help?

There are some fundamental projects, but they tend to be quite well funded already, both financially and in-kind. For example, software engineers at companies like IBM and Google make substantial contributions to the Linux kernel. Still, your company definitely depends on technology from the following projects:

  1. The Linux Foundation — responsible for the kernel of the Linux operating system.
  2. Free Software Foundation — the umbrella for a ridiculous number of software tools.
  3. The Apache Foundation — maintainers of the eponymous web server, and forerunners of the ongoing big data and machine learning revolutions and the tools that power them. 

These higher-level projects are closer to my heart, and do great working supporting the work of scientists:

  1. The Mozilla Foundation — check out the Mozilla Science Lab and Software Carpentry
  2. The WikiMedia Foundation — for Wikipedia, and the MediaWiki software that powers it (as well as AAPG's and SEG's wikis)
  3. NumFOCUS Foundation — all the better to help you wield scientific Python!

If money really isn't an option, consider working somewhere where it is an option. If that's not an option either, then there are plenty of other ways to make a difference:

  1. Use and champion open source software at your place of work.
  2. Submit tickets for the software you use, and engage with the community.
  3. If you can code, submit patches, documentation, or whatever you can.

Now, if we only had an Open Geoscience Foundation to help fund projects in geoscience...

The new open geophysics tools

The hackathon in Denver was more than 6 weeks ago. I kept thinking, "Oh, I must post a review of what went down" (beyond the quick wrap-up I did at the time), but while I'm a firm believer in procrastination six weeks seems unreasonable... Maybe it's taken this long to scrub down to the lasting lessons. Before those, I want to tell you who the teams were, what they did, and where you can find their (100% open source!) stuff. Enjoy!

Geophys Wiz

Andrew Pethick, Josh Poirier, Colton Kohnke, Katerina Gonzales, and Elijah Thomas — GitHub repo

This team had no trouble coming up with ideas — perhaps a reflection of their composition, which was more heterogeneous than the other teams. Josh is at NEOS, the consulting and software firm, and Andrew is a postdoc at Curtin in Perth, Australia, while the other 3 are students at Mines. The team eventually settled on building MT Black Box, a magnetotellurics modeling web application. 

Last thing: Don't miss Andrew Pethick's write-up of the event. 

Seemingly Concerned Neighbours

Elias Arias, Brent Putman, Thomas Rapstine, and Gabriel Martinez — Github repo

These four young geophysicists from the Colorado School of Mines impressed everyone with their work ethic. Their tight-knit team came in with a plan, and proceeded to scribble up the coolest-looking whiteboard of the weekend. After learning some Android development skills 'earlier this week', they pulled together a great little app for forward modeling magnetotelluric responses. 

Hackathon_well_tie_guys.jpg

Well tie guys

Michaël Montouchet, Graham Dawes, Mark Roberts

It was terrific to have pro coders Graham and Michaël with us — they flew from the UK to be with us, thanks to their employer and generous sponsor ffA GeoTeric. They hooked up with Mark, a Denver geophysicist and developer, and hacked on a well-tie web application, rightly identifying a gap in the open source market, so to speak (there is precious little out there for well-based workflows). They may have bitten off more than they could chew in just 2 days, so I hope we can get together with them again to finish it off. Who's up for a European hackathon? 

These two characters from UBC didn't get going till Sunday morning, but in just five hours they built a sweet web app for forward modeling the DC resistivity response of a buried disk. They weren't starting from scratch, because Rowan and others have spent months honing SimPEG, a rich open-source geophysical library, but minds were nonetheless blown.

Key takeaway: interactivity beyond sliders for the win.

Pick This!

Ben Bougher, Jacob Foshee, Evan Bianco, and an immiscible mixture of Chris Chalcraft and me — GitHub repo

Wouldn't you sometimes like to know how other people would interpret the section you're working on? This team, a reprise of the dream team from Houston in 2013, built a simple way to share images and invite others to interpret them. When someone has completed their interpretation, only then do they get to see the ensemble — everyone else's interpretations — in a heatmap. Not only did this team demo live software at pickthis.io, but the audience provided the first crowdsourced picks in real time. 

We'll be blogging more about Pick This soon. We're actively seeking ideas, images, interpreters, and financial support. Keep an eye out.

What I learned at this hackathon

  • Potential fields are an actual thing! OK, kidding, but three out of five teams built potential field modeling tools. I wasn't expecting that, and I think the judges were impressed at the breadth. 
  • 30 hours is easily enough time to build something pretty cool. Heck, 5 hours is enough if you're made of the right stuff. 
  • Students can happily build prototypes alongside professional developers, and even teach them a thing or two. And vice versa. Are hackathons a leveller of playing fields?
  • We need to remove the road blocks to more people enjoying this event. To help with this, next time there will be a 1-day bootcamp before the hackathon.
  • After virtually doubling in size from 2013 to 2014, it's clear that the 2015 Hackathon in New Orleans is going to be awesome! Mark your calendar: 17 and 18 October 2015.

Thank you!

Thank you to the creative, energetic geophysicists that came. It was a privilege to meet and hack with you!

Thank you to the judges who gave up their Sunday teatime to watch the demos and give precious feedback to the teams: Steve Adcock, Jamie Allison, Maitri Erwin, Dennis Cooke, Chris Krohn, Shannon Bjarnason, David Holmes, and Tracy Stark. Amazing people, one and all.

A final Thank You to our sponsors — dGB Earth Sciences, ffA GeoTeric, and OpenGeoSolutions. You guys are totally awesome! Seriously.

sponsors_white_noagile.png

Relentlessly practical

This is one of my favourite knowledge sharing stories.

A farmer in my community had a problem with one of his cows — it was seriously unwell. He asked one of the old local farmers about the symptoms, and was told, “Oh yes, one of my herd had the same thing last summer. I gave her a cup of brandy and four aspirins every night for a week.” The young farmer went off and did this, but the poor cow got steadily worse and died. When he saw the old farmer next he told him, more than a little accusingly, “I did what you said, and the cow died anyway.” The old geezer looked into the distance and just said, “Yep, so did mine.”

Incomplete information can be less useful than no information. Yet incomplete information has somehow become our specialty in applied geoscience. How often do we share methods, results, or case studies without the critical details that would make it useful information? That is, not just marketing, or resumé padding. Inded, I heard this week that one large US operator will not approve a publication that does include these critical details! And we call ourselves scientists...

Completeness mandatory

Thankfully, Last month The Leading Edge — the magazine of the SEG — started a new tutorial column, edited by me. Well, I say 'edited', I'm just the person that pesters prospective authors until they give in and send me a manuscript. Tad Smith, Don Herron, and Jenny Kucera are the people that make it actually happen. But I get to take all the credit.

When I was asked about it, I suggested two things:

  1. Make each tutorial reproducible by publishing the code that makes the figures.
  2. Make the words, the data, and the code completely open and shareable. 

To my delight and, I admit, slight surprise, they said 'Sure!'. So the words are published under an open license (Creative Commons Attribution-ShareAlike, the same license for re-use that most of Wikipedia has), the tutorials use open data for everything, and the code is openly available and free to re-use. Complete transparency.

There's another interesting aspect to how the column is turning out. The first two episodes tell part of the story in IPython Notebook, a truly amazing executable writing environment that we've written about before. This enables you to seamlessly stich together text, code, and plots (left). If you know a bit of Python, or want to start learning it right now this second, go give wakari.io a try. It's pretty great. (If you really like it, come and learn more with us!).

Read the first tutorial: Hall, M. (2014). Smoothing surfaces and attributes. The Leading Edge, 33(2), 128–129. doi: 10.1190/tle33020128.1. A version of it is also on SEG Wiki, and you can read the IPython Notebook at nbviewer.org.

Do you fancy authoring something for this column? Wonderful — please do! Here are the author instructions. If you have an idea for something, please drop me a line, let's talk about how to make it relentlessly practical.

Free software tips

Open source software is often called 'free' software. 'Free as in freedom, not free as in beer', goes the slogan (undoubtedly a strange way to put it, since beer is rarely free). But something we must not forget about free and open software: someone, a human, had to build it.

It's not just open source software — a lot of stuff is free to use these days. Here are a few of the things I use regularly that are free:

Wow. That list was easy to write; I bet I've barely scratched the surface.

It's clear that some of this stuff is not free, strictly speaking. The adage 'if you're not paying for it, then you're the product' is often true — Google places ads in my Gmail web view, Facebook is similarly ad driven, your LinkedIn account provides valuable data and a prospect to paying members, mostly in human resources. 

But it's also clear that a few individuals in the world are creating massive, almost unmeasurable (if you think about Linux or Wikipedia), value in the world... and then giving it away. Think about that. Think about what that enables in the world. It's remarkable, especially when I think about all the physical junk I pay for. 

Give something back

I won't pretend to be consistent or rigorous about this, but since I started Agile I've tried to pay people for the awesome things that I use every day. I donate to Wikimedia, Mozilla and Creative Commons, I pay for the (free) Ubuntu Linux distribution, I buy the paid version of apps, and I buy the basic level of freemium apps rather than using the free one. If some freeware helps me, I send the developer $25 (or whatever) via PayPal.

I wonder how many corporations donate to Wikipedia to reflect the huge contribution it makes to their employees' ability to perform their work? How would it compare with how much it spends on tipping restaurant servers and cab drivers every year in the US, even when the service was mediocre?

There are lots of ways for developers and other creators to get paid for work they might otherwise have done for free, or at great personal expense or risk. For example, Kickstarter and Indiegogo are popular crowdfunding platforms. And I recently read about a Drupal developer's success with Gittip, a new tipping protocol.

Next time you get real value from something that cost you nothing, think about supporting the human being that put it together. 

The image is CC-BY-SA and created by Wikimedia Commons user JIP.

Seismic texture attributes — in the open at last

I read Brian West's paper on seismic facies a shade over ten years ago (West et al., 2002, right). It's a very nice story of automatic facies classification in seismic — in a deep-water setting, presumably in the Gulf of Mexico. I have re-read it, and handed it to others, countless times.

Ever since, for over a decade, I've wanted to be able to reproduce this workflow. It's one of the frustrations of the non-programming geophysicist that such reproduction is so hard (or expensive!). So hard that you may never quite manage it. Indeed, it took until this year, when Evan implemented the workflow in MATLAB, for a geothermal project. Phew!

But now we're moving to SciPy for our scientific programming, so Evan was looking at building the workflow again... until Paul de Groot told me he was building texture attributes into OpendTect, dGB's awesome, free, open source seismic interpretation tool. And this morning, the news came: OpendTect 4.4.0e is out, and it has Haralick textures! Happy Christmas, indeed. Thank you, dGB.

Parameters

There are 4 parameters to set, other than selecting an attribute. Choose a time gate and a kernel size, and the number of grey levels to reduce the image to (either 16 or 32 — more options might be nice here). You also have to choose the dynamic range of the data — don't go too wide with only 16 grey levels, or you'll throw almost all your data into one or two levels. Only the time gate and kernel size affect the run time substantially, and you'll want them to be big enough to capture your textures. 

Reference
West, B, S May, J Eastwood, and C Rossen (2002). Interactive seismic faces classification using textural attributes and neural networks. The Leading Edge, October 2002. DOI: 10.1190/1.1518444

The seismic dataest is the F3 offshore Netherlands volume from the Open Seismic Repository, licensed CC-BY-SA.

The evolution of open mobile geocomputing

A few weeks ago I attended the EAGE conference in Copenhagen (read my reports on Day 2 and Day 3). I presented a paper at the open source geoscience workshop on the last day, and wanted to share it here. I finally got around to recording it:

As at the PTTC Open Source workshop last year (Day 1Day 2, and my presentation), I focused on mobile geocomputing — geoscience computing on mobile devices like phones and tablets. The main update to the talk was a segment on our new open source web application, Modelr. We haven't written about this project before, and I'd be the first to admit it's rather half-baked, but I wanted to plant the kernel of awareness now. We'll write more on it in the near future, but briefly: Modelr is a small web app that takes rock properties and model parameters, and generates synthetic seismic data images. We hope to use it to add functionality to our mobile apps, much as we already use Google's chart images. Stay tuned!

If you're interested in seeing what's out there for geoscience, don't miss our list of mobile geoscience apps on SubSurfWiki! Do add any others you know of.

Two decades of geophysics freedom

This year is the 20th anniversary of the release of Seismic Un*x as free software. It is six years since the first open software workshop at EAGE. And it is one year since the PTTC open source geoscience workshop in Houston, where I first met Karl Schleicher, Joe Dellinger, and a host of other open source advocates and developers. The EAGE workshop on Friday looked back on all of this, surveyed the current landscape, and looked forward to an ever-increasing rate of invention and implementation of free and open geophysics software.

Rather than attempting any deep commentary, here's a rundown of the entire day. Please read on...

Read More

The Agile toolbox

Some new businesses go out and raise millions in capital before they do anything else. Not us — we only do what we can afford. Money makes you lazy. It's technical consulting on a shoestring!

If you're on a budget, open source is your best friend. More than this, it's important an open toolbox is less dependent on hardware and less tied to workflows. Better yet, avoiding large technology investments helps us avoid vendor lock-in, and the resulting data lock-in, keeping us more agile. And there are two more important things about open source: 

  • You know exactly what the software does, because you can read the source code
  • You can change what the software does, becase you can change the source code

Anyone who has waited 18 months for a software vendor to fix a bug or add a feature, then 18 more months for their organization to upgrade the software, knows why these are good things.

So what do we use?

In the light of all this, people often ask us what software we use to get our work done.

Hardware  Matt is usually on a dual-screen Apple iMac running OS X 10.6, while Evan is on a Samsung Q laptop (with a sweet solid-state drive) running Windows. Our plan, insofar as we have a plan, is to move to Mac Pro as soon as the new ones come out in the next month or two. Pure Linux is tempting, but Macs are just so... nice.

Geoscience interpretation  dGB OpendTect, GeoCraftQuantum GIS (above). The main thing we lack is a log visualization and interpretation tool. Beyond this, we don't use them much yet but Madagascar and GMT are plugged right into OpendTect. For getting started on stratigraphic charts, we use TimeScale Creator

A quick aside, for context: when I sold Landmark's GeoProbe seismic interpretation tool, back in 2003 or so, the list price was USD140 000 per user, choke, plus USD25k per year in maintenance. GeoProbe is very powerful now (and I have no idea what it costs), but OpendTect is a much better tool that that early edition was. And it's free (as in speech, and as in beer).

Geekery, data mining, analysis  Our core tools for data mining are Excel, Spotfire Silver (an amazing but proprietary tool), MATLAB and/or GNU Octave, random Python. We use Gephi for network analysis, FIJI for image analysis, and we have recently discovered VISAT for remote sensing images. All our mobile app development has been in MIT AppInventor so far, but we're playing with the PhoneGap framework in Eclipse too. 

Writing and drawing  Google Docs for words, Inkscape for vector art and composites, GIMP for rasters, iMovie for video, Adobe InDesign for page layout. And yeah, we use Microsoft Office and OpenOffice.org too — sometimes it's just easier that way. For managing references, Mendeley is another recent discovery — it is 100% awesome. If you only look at one tool in this post, look at this.

Collaboration  We collaborate with each other and with clients via SkypeDropbox, Google+ Hangouts, and various other Google tools (for calendars, etc). We also use wikis (especially SubSurfWiki) for asynchronous collaboration and documentation. As for social media, we try to maintain some presence in Google+, Facebook, and LinkedIn, but our main channel is Twitter.

Web  This website is hosted by Squarespace for reliability and reduced maintenance. The MediaWiki instances we maintain (both public and private) are on MediaWiki's open source platform, running on Amazon's Elastic Compute servers for flexibility. An EC2 instance is basically an online Linux box, running Ubuntu and Bitnami's software stack, plus some custom bits and pieces. We are launching another website soon, running WordPress on Amazon EC2. Hover provides our domain names — an awesome Canadian company.

Administrative tools  Every business has some business tools. We use Tick to track our time — it's very useful when working on multiple projects, subscontractors, etc. For accounting we recently found Wave, and it is the best thing ever. If you have a small business, please check it out — after headaches with several other products, it's the best bean-counting tool I've ever used.

If you have a geeky geo-toolbox of your own, we'd love to hear about it. What tools, open or proprietary, couldn't you live without?

Open up

After a short trip to Houston, today I am heading to London, Ontario, for a visit with Professor Burns Cheadle at the University of Western Ontario. I’m stoked about the trip. On Saturday I’m running my still-developing course on writing for geoscientists, and tomorrow I’m giving the latest iteration of my talk on openness in geoscience. I’ll post a version of it here once I get some notes into the slides. What follows is based on the abstract I gave Burns.

A recent survey by APEGBC's Innovation magazine revealed that geoscience is not among the most highly respected professions. Only 20% of people surveyed had a ‘great deal of respect’ for geologists and geophysicists, compared to 30% for engineers, and 40% for teachers. This is far from a crisis, but as our profession struggles to meet energy demands, predict natural disasters, and understand environmental change, we must ask, How can we earn more trust? Perhaps more openness can help. I’m pretty sure it can’t hurt.

Many people first hear about ‘open’ in connection with software, but open software is just one point on the open compass. And even though open software is free, and can spread very easily in principle, awareness is a problem—open source marketing budgets are usually small. Open source widgets are great, but far more powerful are platforms and frameworks, because these allow geoscientists to focus on science, not software, and collaborate. Emerging open frameworks include OpendTect and GeoCraft for seismic interpretation, and SeaSeis and BotoSeis for seismic processing.

If open software is important for real science, then open data are equally vital because they promote reproducibility. Compared to the life sciences, where datasets like the Human Genome Project and Visible Human abound, the geosciences lag. In some cases, the pieces exist already in components like government well data, the Open Seismic Repository, and SEG’s list of open datasets, but they are not integrated or easy to find. In other cases, the data exist but are obscure and lack a simple portal. Some important plays, of global political and social as well as scientific interest, have little or no representation: industry should release integrated datasets from the Athabasca oil sands and a major shale gas play as soon as possible.

Open workflows are another point, because they allow us to accelerate learning, iteration, and failure, and thus advance more quickly. We can share easily but slowly and inefficiently by publishing, or attending meetings, but we can also write blogs, contribute to wikis, tweet, and exploit the power of the internet as a dynamic, multi-dimensional network, not just another publishing and consumption medium. Online readers respond, get engaged, and become creators, completing the feedback loop. The irony is that, in most organizations, it’s easier to share with the general public, and thus competitors, than it is to share with colleagues.

The fourth point of the compass is in our attitude. An open mindset recognizes our true competitive strengths, which typically are not our software, our data, or our workflows. Inevitably there are things we cannot share, but there’s far more that we can. Industry has already started with low-risk topics for which sharing may be to our common advantage—for example safety, or the environment. The question is, can we broaden the scope, especially to the subsurface, and make openness the default, always asking, is there any reason why I shouldn’t share this?

In learning to embrace openness, it’s important to avoid some common misconceptions. For example, open does not necessarily mean free-as-in-beer. It does not require relinquishing ownership or rights, and it is certainly not the same as public domain. We must also educate ourselves so that we understand the consequences of subtle and innocuous-seeming clauses in licences, for example those pertaining to non-commerciality. If we can be as adept in this new language as many of us are today in intellectual property law, say, then I believe we can accelerate innovation in energy and build trust among our public stakeholders.

So what are you waiting for? Open up!