How to load SEG-Y data

Yesterday I looked at the anatomy of SEG-Y files. But it's pathology we're really interested in. Three times in the last year, I've heard from frustrated people. In each case, the frustration stemmed from the same problem. The epic email trails led directly to these posts. Next time I can just send a URL!

In a nutshell, the specific problem these people experienced was missing or bad trace location data. Because I've run into this so many times before, I never trust location data in a SEG-Y file. You just don't know where it's been, or what has happened to it along the way — what's the datum? What are the units? And so on. So all you really want to get from the SEG-Y are the trace numbers, which you can then match to a trustworthy source for the geometry.

Easy as 1-2-3, er, 4

This is my standard approach to loading data. Your mileage will vary, depending on your software and your data. 

  1. Find the survey geometry information. For 2D data the geometry is usually in a separate navigation ('nav') file. For 3D you are just looking for cornerpoints, and something indicating how the lines and crosslines are numbered (they might not start at 1, and might not be oriented how you expect). This information may be in the processing report or, less reliably, in the EBCDIC text header of the SEG-Y file.
  2. Now define the survey geometry. You need a location for every trace for a 2D, and the survey's cornerpoints for a 3D. The geometry is a description of where the line goes on the earth, in surface coordinates, and where the starting trace is, how many traces there are, and what the trace spacing is. In other words, the geometry tells you where the traces go. It's variously called 'navigation', 'survey', or some other synonym.
  3. Finally, load the traces into their homes, one vintage (survey and processing cohort) at a time for 2D. The cross-reference between the geometry and the SEG-Y file is the trace or CDP number for a 2D, and the line and crossline numbers for a 3D.
  4. Check everything twice. Does the map look right? Is the survey the right shape and size? Is the line spacing right? Do timeslices look OK?

Where to get the geometry data?

So, where to find cornerpoints, line spacings, and so on? Sadly, the header cannot be trusted, even in newly-processed data. If you have it, the processing report is a better bet. It often helps to talk to someone involved in the acquisition and processing too. If you can corroborate with data from the acqusition planning (line spacings, station intervals, and so on), so much the better — but remember that some acquisition parameters may have changed during the job.

Of vital importance is some independent corroboration— a map, ideally —of the geometry and the shape and orientation of the survey. I can't count the number of back-to-front surveys I've seen. I even saw one upside-down (in the z dimension) once, but that's another story.

Next time, I'll break down the loading process a bit more, with some step-by-step for loading the data somewhere you can see it.

News of the month

Another month flies by, and it's time for our regular news round-up! News tips, anyone?

Knowledge sharing

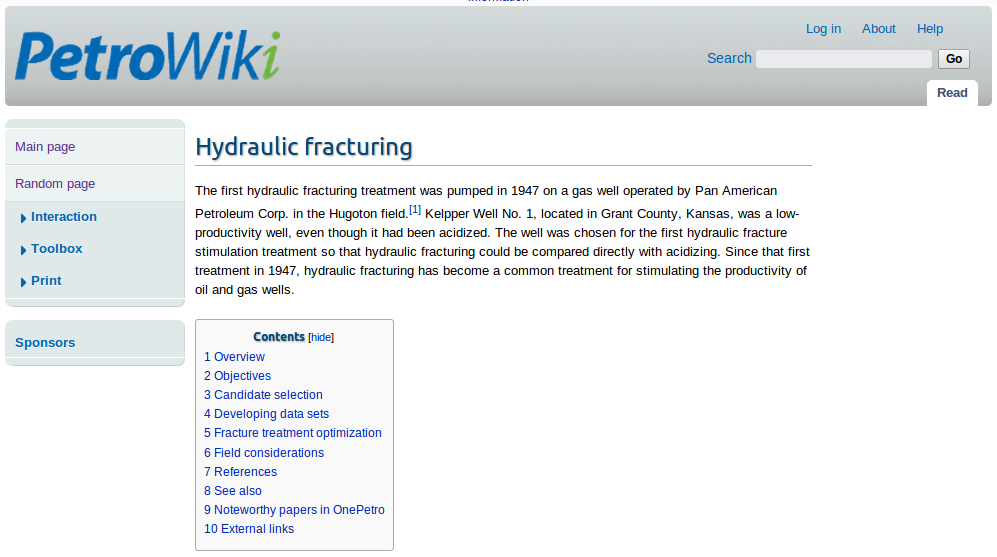
At the start of the month, SPE launched PetroWiki. The wiki has been seeded with one part of the 7-volume Petroleum Engineering Handbook, a tome that normally costs over $600. They started with Volume 2, Drilling Engineering, which includes lots of hot topics, like fracking (right). Agile was involved in the early design of the wiki, which is being built by Knowledge Reservoir

Agile stuff

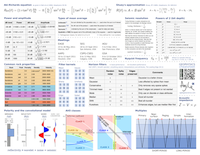
Our cheatsheets are consistenly some of the most popular things on our site. We love them too, so we've been doing a little gardening — there are new, updated editions of the rock physics and geophysics cheatsheets.

Thank you so much to the readers who've let us know about typos! 

Wavelets

Nothing else really hit the headlines this month — perhaps people are waiting for SEG. Here are some nibbles...

  • We just upgraded a machine from Windows to Linux, sadly losing Spotfire in the process. So we're on the lookout for another awesome analytics tool. VISAGE isn't quite what we need, but you might like these nice graphs for oil and gas.
  • Last month we missed the newly awarded exploration licenses in the inhospitable Beaufort Sea [link opens a PDF]. Franklin Petroleum of the UK might have been surprised by the fact that they don't seem to have been bidding against anyone, as they picked up all six blocks for little more than the minimum bid.
  • It's the SEG Annual Meeting next week... and Matt will be there. Look out for daily updates from the technical sessions and the exhibition floor. There's at least one cool new thing this year: an app!

This regular news feature is for information only. We aren't connected with any of these organizations, and don't necessarily endorse their products or services. 

M is for Migration

One of my favourite phrases in geophysics is the seismic experiment. I think we call it that to remind everyone, especially ourselves, that this is science: it's an experiment, it will yield results, and we must interpret those results. We are not observing anything, or remote sensing, or otherwise peering into the earth. When seismic processors talk about imaging, they mean image construction, not image capture

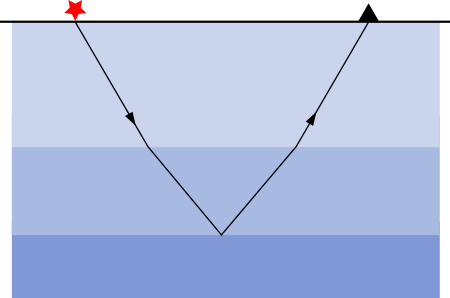
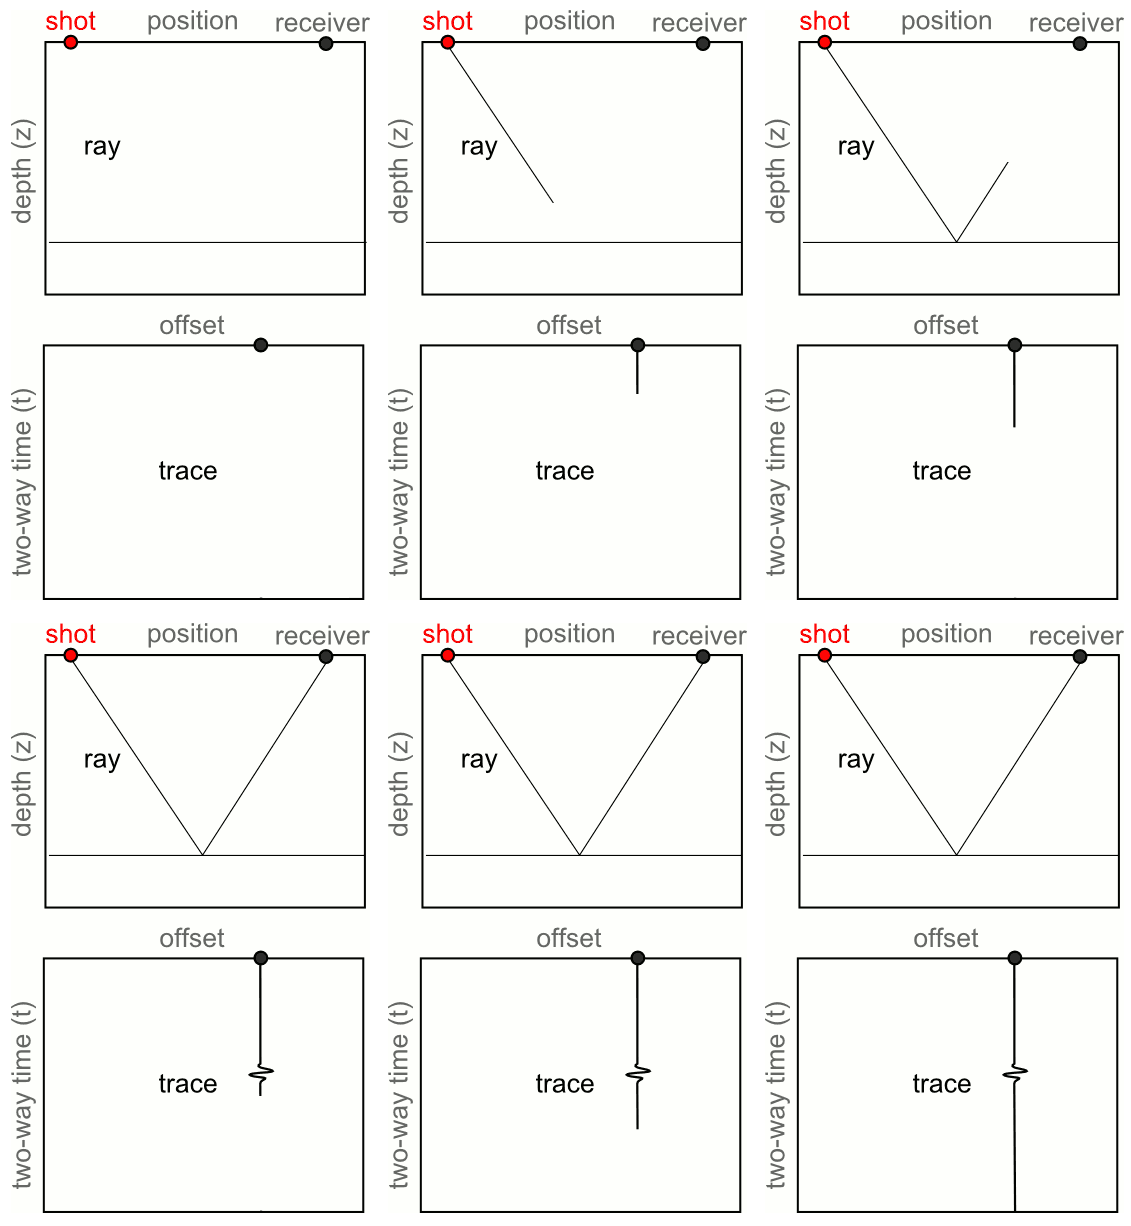
The classic cartoon of the seismic experiment shows flat geology. Rays go down, rays refract and reflect, rays come back up. Simple. If you know the acoustic properties of the medium—the speed of sound—and you know the locations of the source and receiver, then you know where a given reflection came from. Easy!

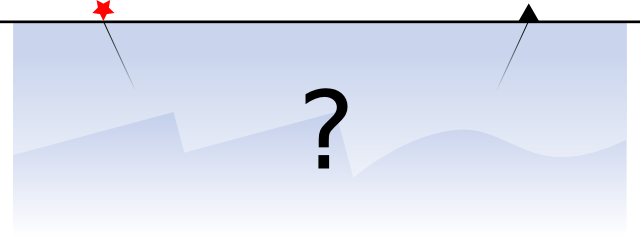
But... some geologists think that the rocks beneath the earth's surface are not flat. Some geologists think there are tilted beds and faults and big folds all over the place. And, more devastating still, we just don't know what the geometries are. All of this means trouble for the geophysicist, because now the reflection could have come from an infinite number of places. This makes choosing a finite number of well locations more of a challenge. 

What to do? This is a hard problem. Our solution is arm-wavingly called imaging. We wish to reconstruct an image of the subsurface, using only our data and our sharp intellects. And computers. Lots of those.

Imaging with geometry

Agile's good friend Brian Russell wrote one of my favourite papers (Russell, 1998) — an imaging tutorial. Please read it (grab some graph paper first). He walks us through a simple problem: imaging a single dipping reflector.

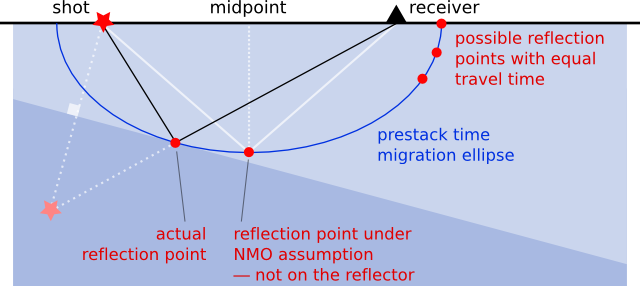
Remember that in the seismic experiment, all we know is the location of the shots and receivers, and the travel time of a sound wave from one to the other. We do not know the reflection points in the earth. If we assume dipping geology, we can use the NMO equation to compute the locus of all possible reflection points, because we know the travel time from shot to receiver. Solutions to the NMO equation — given source–receiver distance, travel time, and the speed of sound — thus give the ellipse of possible reflection points, shown here in blue:

Clearly, knowing all possible reflection points is interesting, but not very useful. We want to know which reflection point our recorded echo came from. It turns out we can do something quite easy, if we have plenty of data. Fortunately, we geophysicists always bring lots and lots of receivers along to the seismic experiment. Thousands usually. So we got data.

Now for the magic. Remember Huygens' principle? It says we can imagine a wavefront as a series of little secondary waves, the sum of which shows us what happens to the wavefront. We can apply this idea to the problem of the tilted bed. We have lots of little wavefronts — one for each receiver. Instead of trying to figure out the location of each reflection point, we just compute all possible reflection points, for all receivers, then add them all up. The wavefronts add constructively at the reflector, and we get the solution to the imaging problem. It's kind of a miracle. 

Try it yourself. Brian Russell's little exercise is (geeky) fun. It will take you about an hour. If you're not a geophysicist, and even if you are, I guarantee you will learn something about how the miracle of the seismic experiment. 

Reference
Russell, B (1998). A simple seismic imaging exercise. The Leading Edge 17 (7), 885–889. DOI: 10.1190/1.1438059

Big data in geoscience

Big data is what we got when the decision cost of deleting data became greater than the cost of storing it.
George Dyson, at Strata London

I was looking for something to do in London this week. Tempted by the Deep-water contintental margins meeting in Piccadilly, I instead took the opportunity to attend a different kind of conference. The media group O'Reilly, led by the inspired Tim O'Reilly, organizes conferences. They're known for being energetic, quirky, and small-company-friendly. I wanted to see one, so I came to Strata.

Strata is the conference for big data, one of the woolliest buzzwords in computer science today. Some people are skeptical that it's anything other than a new way to provoke fear and uncertainty in IT executives, the only known way to make them spend money. Indeed, Google "big data" and the top 5 hits are: Wikipedia (obvsly), IBM, McKinsey, Oracle, and EMC. It might be hype, but all this attention might lead somewhere good. 

We're all big data scientists

Geoscientists, especially geophysicists, are unphased by the concept of big data. The acquisition data from a 3D survey can easily require 10TB (10,240GB) or even 100TB of storage. The data must be written, read, processed, and re-written dozens of times during processing, then delivered, loaded, and interpreted. In geoscience, big data is normal data. 

So it's great that big data problems are being hacked on by thousands of developers, researchers, and companies that, until about a year ago, were only interested in games and the web. About 99% of them are not working on problems in geophysics or petroleum, but there will be insight and technology that will benefit our industry.

It's not just about data management. Some of the most creative data scientists in the world are at this conference. People are showing dense, and sometimes beautiful, visualizations of giant datasets, like the transport displays by James Cheshire's research group at UCL (right). I can't wait to show some of these people a SEG-Y or LAS file and, unencumbered by our curmudgeonly tradition of analog display metaphors, see how they would display it.

Would the wiggle display pass muster?

News of the month

A quick round-up of recent news. If you think we missed something, drop us a line!

EAGE gets more global

The annual EAGE conference and buzzword-fest in Copenhagen was the largest ever, with over 6200 delegates. The organization is getting ever more global, having just signed memorandums of understanding with both AAPG and SEG — getting this done was a big cap-feather for John Underhill, who stepped down as president at the end of the week.

The most popular session of the conference was Creativity & Boldness in Exploration, organized by Jean-Jacques Jarrige of Total. At least 800 people crammed into the auditorium, causing exhibition-floor vendors to complain that 'everything has gone quiet'.

Microsoft gets more social... maybe

Most of our knowledge sharing clients have dabbled with social media. Chat is more or less ubiquitous, wikis are extremely popular, and microblogging is taking off. Yammer is one of the disrupters here, and it seemed almost inevitable that they would be acquired. How dull to hear that Microsoft seems to be the main suitor. They need something to work in this space, but have struggled so far. 

Find your digital objects!

Science is benefitting every day from social media, as conversations happen on Twitter and elsewhere. Sharing data, methods, photos, and figures is fun and helps grow stronger communities. Figshare is a still-new place to share graphics and data, and its acquisition by Macmillan's Digital Science business gave it more clout earlier this year. It now offers a Digital Object Identifier, also known as a DOI, for every item you upload. This is as close to a guarantee of persistence as you can get on the web, and it's a step closer to making everything citable in tomorrow's scientific literature.

Forecast is for cloud

One of the buzzwords at EAGE was 'the cloud' as companies fall over each other trying to get in on the action. Halliburton has had a story for years, but we think the giants will struggle in this space—the ones to watch are the startups. FUSE are one of the more convincing outfits, dragging E&P data management into the 21st century.

In other news

Touch is coming to E&P. Those lovely interfaces on your phone and tablet are, slowly but surely, getting traction in subsurface geoscience as Schlumberger teams up with Perceptive Pixel to bring a 27" multi-touch interface to Petrel

Thank goodness you're a geoscientist! Geophysics is one of the most employable degrees, according to a report last year by Georgetown University that's been covered lots since. Our impression: the more quantitative you are, the more employable.

This regular news feature is for information only. We aren't connected with any of these organizations, and don't necessarily endorse their products or services. 

Two decades of geophysics freedom

This year is the 20th anniversary of the release of Seismic Un*x as free software. It is six years since the first open software workshop at EAGE. And it is one year since the PTTC open source geoscience workshop in Houston, where I first met Karl Schleicher, Joe Dellinger, and a host of other open source advocates and developers. The EAGE workshop on Friday looked back on all of this, surveyed the current landscape, and looked forward to an ever-increasing rate of invention and implementation of free and open geophysics software.

Rather than attempting any deep commentary, here's a rundown of the entire day. Please read on...

Read More

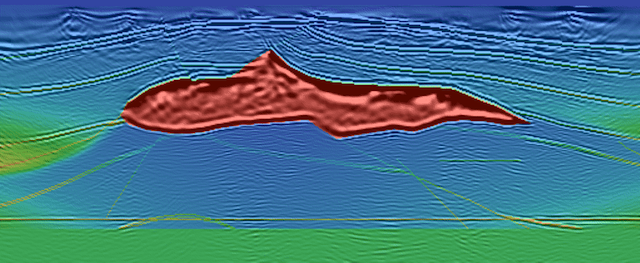
A mixing board for the seismic symphony

Seismic processing is busy chasing its tail. OK, maybe an over-generalization, but researchers in the field are very skilled at finding incremental—and sometimes great—improvements in imaging algorithms, geometric corrections, and fidelity. But I don't want any of these things. Or, to be more precise: I don't need any more. 

Reflection seismic data are infested with filters. We don't know what most of these filters look like, and we've trained ourselves to accept and ignore them. We filter out the filters with our intuition. And you know where intuition gets us.

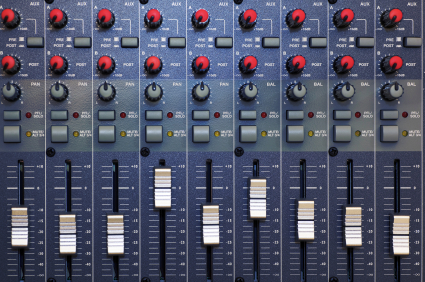
Mixing boardIf I don't want reverse-time, curved-ray migration, or 7-dimensional interpolation, what do I want? Easy: I want to see the filters. I want them perturbed and examined and exposed. Instead of soaking up whatever is left of Moore's Law with cluster-hogging precision, I would prefer to see more of the imprecise stuff. I think we've pushed the precision envelope to somewhere beyond the net uncertainty of our subsurface data, so that quality and sharpness of the seismic image is not, in most cases, the weak point of an integrated interpretation.

So I don't want any more processing products. I want a mixing board for seismic data.

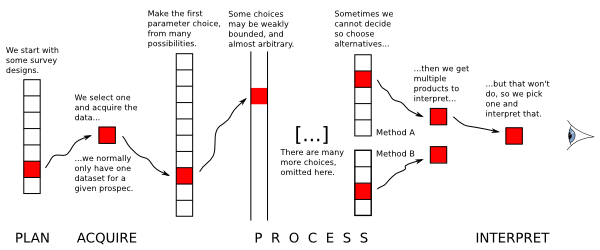
To fully appreciate my point of view, you need to have experienced a large seismic processing project. It's hard enough to process seismic, but if there is enough at stake—traces, deadlines, decisions, or just money—then it is almost impossible to iterate the solution. This is rather ironic, and unfortunate. Every decision, from migration aperture to anisotropic parameters, is considered, tested, and made... and then left behind, never to be revisited.

Linear seismic processing flow

But this linear model, in which each decision is cemented onto the ones before it, seems unlikely to land on the optimal solution. Our fateful string of choices may lead us to a lovely spot, with a picnic area and clean toilets, but the chances that it is the global maximum, which might lie in a distant corner of the solution space, seem slim. What if the spherical divergence was off? Perhaps we should have interpolated to a regularized geometry. Did we leave some ground roll in the data? 

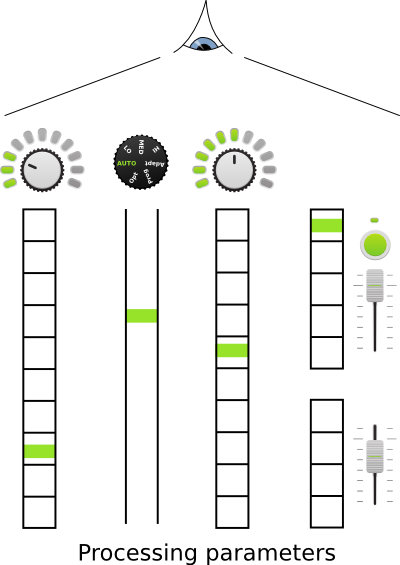
Seismic processing mixing boardLook, I don't know the answer. But I know what it would look like. Instead of spending three months generating the best-ever migration, we'd spend three months (maybe less) generating a universe of good-enough migrations. Then I could sit at my desk and—at least with first order precision—change the spherical divergence, or see if less aggressive noise attenuation helps. A different migration algorithm, perhaps. Maybe my multiples weren't gone after all: more radon!

Instead of looking along the tunnel of the processing flow, I want the bird's eye view of all the possiblities. 

If this sounds impossible, that's because it is impossible, with today's approach: process in full, then view. Why not just do this swath? Ray trace on the graphics card. Do everything in memory and make me buy 256GB of RAM. The Magic Earth mentality of 2001—remember that?

Am I wrong? Maybe we're not even close to good-enough, and we should continue honing, at all costs. But what if the gains to be made in exploring the solution space are bigger than whatever is left for image quality?

I think I can see another local maximum just over there...

Mixing board image: iStockphoto.

Please sir, may I have some processing products?

Just like your petrophysicist, your seismic processor has some awesome stuff that you want for your interpretation. She has velocities, fold maps, and loads of data. For some reason, processors almost never offer them up — you have to ask. Here is my processing product checklist:

A beautiful seismic volume to interpret. Of course you need a volume to tie to wells and pick horizons on. These days, you usually want a prestack time migration. Depth migration may or may not be something you want to pay for. But there's little point in stopping at poststack migration because if you ever want to do seismic analysis (like AVO for example), you're going to need a prestack time migration. The processor can smooth or enhance this volume if they want to (with your input, of course). 

Unfiltered, attribute-friendly data. Processors like to smooth things with filters like fxy and fk. They can make your data look nicer, and easier to pick. But they mix traces and smooth potentially important information out—they are filters after all. So always ask for the unfiltered data, and use it for attributes, especially for computing semblance and any kind of frequency-based attribute. You can always smooth the output if you want.

Limited-angle stacks. You may or may not want the migrated gathers too—sometimes these are noisy, and they can be cumbersome for non-specialists to manipulate. But limited-angle stacks are just like the full stack, except with fewer traces. If you did prestack migration they won't be expensive, get them exported while you have the processor's attention and your wallet open. Which angle ranges you ask for depends on your data and your needs, but get at least three volumes, and be careful when you get past about 35˚ of offset. 

Rich, informative headers. Ask to see the SEG-Y file header before the final files are generated. Ensure it contains all the information you need: acquisition basics, processing flow and parameters, replacement velocity, time datum, geometry details, and geographic coordinates and datums of the dataset. You will not regret this and the data loader will thank you.

Processing report. Often, they don't write this until they are finished, which is a shame. You might consider asking them to write up a shared Google Docs or a private wiki as they go. That way, you can ensure you stay engaged and informed, and can even help with the documentation. Make sure it includes all the acquisition parameters as well as all the processing decisions. Those who come after you need this information!

Parameter volumes. If you used any adaptive or spatially varying parameters, like anisotropy coefficients for example, make sure you have maps or volumes of these. Don't forget time-varying filters. Even if it was a simple function, get it exported as a volume. You can visualize it with the stacked data as part of your QC. Other parameters to ask for are offset and azimuth diversity.

Migration velocity field (get to know velocities). Ask for a SEG-Y volume, because then you can visualize it right away. It's a good idea to get the actual velocity functions as well, since they are just small text files. You may or may not use these for anything, but they can be helpful as part of an integrated velocity modeling effort, and for flagging potential overpressure. Use with care—these velocities are processing velocities, not earth measurements.

The SEG's salt model, with velocities. Image:Sandia National Labs.Surface elevation map. If you're on land, or the sea floor, this comes from the survey and should be very reliable. It's a nice thing to add to fancy 3D displays of your data. Ask for it in depth and in time. The elevations are often tucked away in the SEG-Y headers too—you may already have them.

Fold data. Ask for fold or trace density maps at important depths, or just get a cube of all the fold data. While not as illuminating as illumination maps, fold is nevertheless a useful thing to know and can help you make some nice displays. You should use this as part of your uncertainty analysis, especially if you are sending difficult interpretations on to geomodelers, for example. 

I bet I have missed something... is there anything you always ask for, or forget and then have to extract or generate yourself? What's on your checklist?

Curvelets, dreamlets, and a few tears

Day 3 of the SEG Annual Meeting came and went in a bit of a blur. Delegates were palpably close to saturation, getting harder to impress. Most were no longer taking notes, happy to let the geophysical tide of acoustic signal, and occasional noise, wash over them. Here's what we saw.

Gilles Hennenfent, Chevron

I (Evan) loved Gilles's talk Interpretive noise attenuation in the curvelet domain. For someone who is merely a spectator in the arena of domain transforms and noise removal techniques, I was surprised to find it digestable and well-paced. Coherent noise can be difficult to remove independently from coherent signal, but using dyadic partitions of the frequency-wavenumber (f-k) domain, sectors called curvelets can be muted or amplified for reducing noise and increasing signal. Curvelets have popped up in a few talks, because they can be a very sparse representation of seismic data.

Speaking of exotic signal decompositions, Ru-Shan Wu, University of California at Santa Clara, took his audience to new heights, or depths, or widths, or... something. Halfway through his description of the seismic wavefield as a light-cone in 4D Fourier time-space best characterized by drumbeat beamlets—or dreamlets—we realized that we'd fallen through a wormhole in the seismic continuum and stopped taking notes.

Lev Vernik, Marathon

Lev dished a delicious spread of tidbits crucial for understanding the geomechanical control on hydraulic fracture stimulations. It's common practice to drill parallel to the minimum horizontal stress direction to optimize fracture growth away from the well location. For isotropic linear elastic fracture behaviour, the breakdown pressure of a formation is a function of the maximum horizontal stress, the vertical stress, the pore pressure, and the fracture toughness. Unfortunately, rocks we'd like to frack are not isotropic, and need to be understood in terms of anisotropy and inelastic strains.

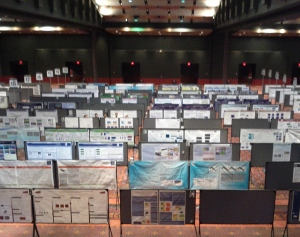
Lastly, we stopped in to look at the posters. But instead of being the fun-fest of awesome geoscience we were looking forward to (we're optimistic people), it was a bit of a downer and made us rather sad. Posters are often a bit unsatisfactory for the presenter: they are difficult to make, and often tucked away in a seldom-visited corner of the conference. But there was no less-frequented corner of San Antonio, and possibly the state of Texas, than the dingy poster hall at SEG this year. There were perhaps 25 people looking at the 400-or-so posters. Like us, most of them were crying.

More posts from SEG 2011.

G is for Gather

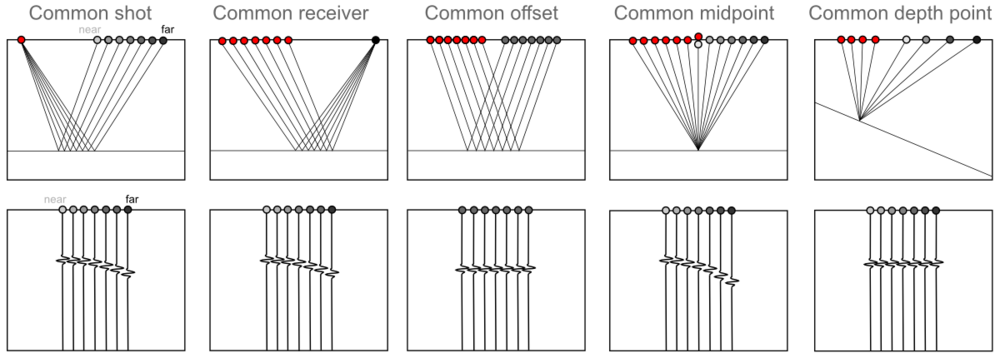
When a geophysicist speaks about pre-stack data, they are usually talking about a particular class of gather. A gather is a collection of seismic traces which share some common geometric attribute. The term gather usually refers to a common depth point (CDP) or common mid-point (CMP) gather. Gathers are sorted from field records in order to examine the dependence of amplitude, signal:noise, moveout, frequency content, phase, and other attributes that are important for data processing and imaging. 

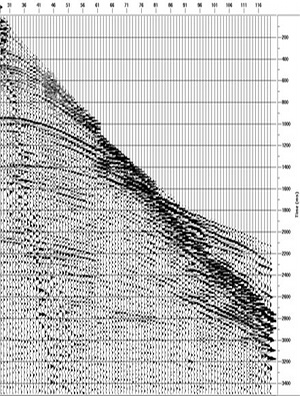
Common shot or receiver gather: Basic quality assessment tools in field acquistion. When the traces of the gather come from a single shot and many receivers, it is called a common shot gather. A single receiver with many shots is called a common receiver gather. It is very easy to inspect traces in these displays for bad receivers or bad shots. 

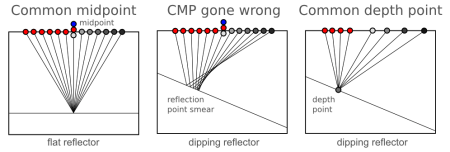
shot gatherImage: gamut.to.it CC-BY-NC-NDCommon midpoint gather, CMP: The stereotypical gather: traces are sorted by surface geometry to approximate a single reflection point in the earth. Data from several shots and receivers are combined into a single gather. The traces are sorted by offset in order to perform velocity analysis for data processing and hyperbolic moveout correction. Only shot–receiver geometry is required to construct this type of gather.

Common depth point gather, CDP: A more sophisticated collection of traces that takes dipping reflector geometry other subsurface properties into account. CDPs can be stacked to produce a structure stack, and could be used for AVO work, though most authors recommend using image gathers or CIPs [see the update below for a description of CIPs]A priori information about the subsurface, usually a velocity model, must be applied with the shot–receiver geometry in order to construct this type of gather. [This paragraph has been edited to reflect the update below].

Common offset gather, COFF: Used for basic quality control, because it approximates a structural section. Since all the traces are at the same offset, it is also sometimes used in AVO analysis; one can quickly inspect the approximate spatial extent of a candidate AVO anomaly. If the near offset trace is used for each shot, this is called a brute stack.

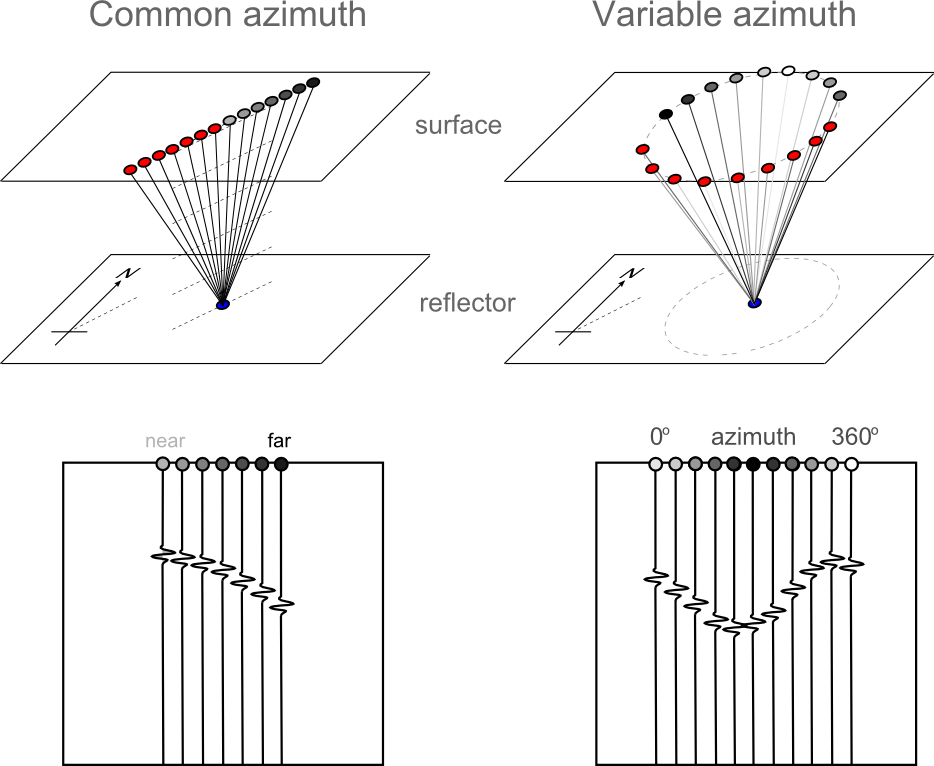
Variable azimuth gather: If the offset between source and receiver is constant, but the azimuth is varied, the gather can be used to study variations in travel-time anisotropy from the presence of elliptical stress fields or reservoir fracturing. The fast and slow traveltime directions can be mapped from the sinsoidal curve. It can also be used as a pre-stack data quality indicator. 

Check out the wiki page for more information. Are there any gather types or applications that we have missed?

Find other A to Z posts