News of the month

Like the full moon, our semi-regular news round-up has its second outing this month. News tips?

New software releases

QGIS, our favourite open source desktop GIS too, moves to v1.8 Lisboa. It gains pattern fills, terrain analysis, layer grouping, and lots of other things.

Midland Valley, according to their June newsletter, will put Move 2013 on the Mac, and they're working on iOS and Android versions too. Multi-platform keeps you agile. 

New online tools

The British Geological Survey launched their new borehole viewer for accessing data from the UK's hundreds of shallow holes. Available on mobile platforms too, this is how you do open data, staying relevant and useful to people.

Joanneum Research, whose talk at EAGE I mentioned, is launching their seismic attributes database seismic-attribute.info as a €6000/year consortium, according to an email we got this morning. Agile* won't be joining, we're too in love with Mendeley's platform, but maybe you'd like to — enquire by email.

Moar geoscience jobs

Neftex, a big geoscience consulting and research shop based in Oxford, UK, is growing. Already with over 80 people, they expect to hire another 50 or so. That's a lot of geologists and geophysicists! And Oxford is a lovely part of the world.

Ikon Science, another UK subsurface consulting and research firm, is opening a Calgary office. We're encouraged to see that they chose to announce this news on Twitter — progressive!

This regular news feature is for information only. We aren't connected with any of these organizations, and don't necessarily endorse their products or services. Except QGIS, which we definitely do endorse, cuz it's awesome. 

News of the month

Welcome to our more-or-less regular new post. Seen something awesome? Get in touch!

Convention time!

Next week is Canada's annual petroleum geoscience party, the CSPGCSEGCWLS GeoConvention. Thousands of applied geoscientists will descend on Calgary's downtown Telus Convention Centre to hear about the latest science and technology in the oilfield, and catch up with old friends. We're sad to be missing out this year — we hope someone out there will be blogging!

GeoConvention highlights

There are more than fifty technical sessions at the conference this year. For what it's worth, these are the presentations we'd be sitting in the front row for if we were going:

Now run to the train and get to the ERCB Core Research Centre for...

Guided fault interpretation

We've seen automated fault interpretation before, and now Transform have an offering too. A strongly tech-focused company, they have a decent shot at making it work in ordinary seismic data — the demo shows a textbook example:

GPU processing on the desktop

On Monday Paradigm announced their adoption of NVIDIA's Maximus technology into their desktop applications. Getting all gooey over graphics cards seems very 2002, but this time it's not about graphics — it's about speed. Reserving a Quadro processor for graphics, Paradigm is computing seismic attributes on a dedicated Tesla graphics processing unit, or GPU, rather than on the central processing unit (CPU). This is cool because GPUs are massively parallel and are much, much faster at certain kinds of computation because they don't have the process management, I/O, and other overheads that CPUs have. This is why seismic processing companies like CGGVeritas are adopting them for imaging. Cutting edge stuff!

In other news...

This regular news feature is for information only. We aren't connected with any of these organizations, and don't necessarily endorse their products or services. 

News of the month

A few bits of news about geology, geophysics, and technology in the hydrocarbon and energy realm. Do drop us a line if you hear of something you think we ought to cover.

All your sequence strat

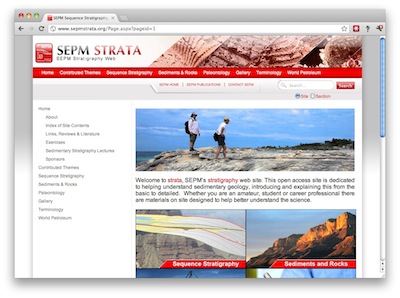
The SEPM, which today calls itself the Society for Sedimentary Geology (not the Society of Economic Palaeontologists and Mineralogists, which is where the name comes from, IIRC), has upgraded its website. It looks pretty great (nudge nudge, AAPG!). The awesome SEPM Strata, a resource for teaching and learning sequence stratigraphy, also got a facelift. 

Hat-tip to Brian Romans for this one.

Giant sand volcano

Helge Løseth of Statoil, whom we wrote about last week in connection with the Source Rocks from Seismic workflow, was recently in the news again. This time he and his exploration team were describing the Pleistocene extrusion of more than 10 km3 of sand onto the sea-floor in the northern North Sea, enough to bury Manhattan in 160 m of sand.

The results are reported in Løseth, H, N Rodrigues, and P Cobbold (2012) and build on earlier work by the same team (Rodrigues et al. 2009). 

Tape? There's still tape??

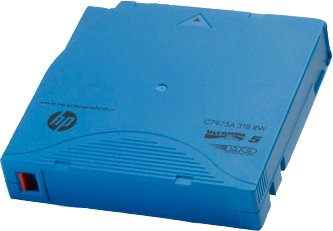
Yes, there's still tape. This story just caught my eye because I had no idea people were still using tape. It turns out that the next generation of tape, Ultrium LTO-6, will be along in the second half of 2012. The specs are pretty amazing: 8 TB (!) of compressed data, and about 200 MB/s (that's megabytes) transfer rates. The current generation of cartridges, LTO-5, cost about $60 and hold 3 TB — a similar-performing hard drive will set you back more than double that. 

The coolest cluster

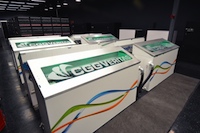
Physics enables geophysics in lots of cool ways. CGGVeritas is using a 600 kW Green Revolution Cooling CarnotJet liquid cooling system to refrigerate 24 cluster racks in GRC's largest installation to date. In the video below, you can see an older 100 kW system. The company claims that these systems, in which the 40°C racks sit bathed in non-conductive oil, reduce the cost of cooling a supercomputer by about 90%... pretty amazing.

Awesomer still, this server is using Supermicro's SuperServer GPU-accelerated servers. GPUs, or graphics processing units, have massively parallel architectures (over 1000 cores per server), and can perform some operations much faster than ordinary CPUs, which are engineered to perform 'executive' functions as well as just math.

This regular news feature is for information only. We aren't connected with any of these organizations, and don't necessarily endorse their products or services. The cartridge image is licensed CC-BY-SA by Wikimedia Commons user andy_hazelbury. The CarnotJet image is from grcooling.com and thought to be fair use.

News of the week

This news feature has settled down into a fortnightly groove. News of the week sounds good, though, so we'll keep the name. Filtered geoscience tech news, every other Friday. Got tips?

Is it hot in here?

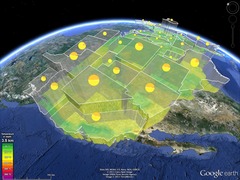
Google's philanthropic arm, Google.org, sponsored a major study at Southern Methodist University into the geothermal potential of the United States, and the results are in. This was interesting to us, because we've just spent a couple of weeks working our first geothermal project. Characterizing hot rocks is a fascinating and fairly new application of seismic technology, so it's been as much research exercise as interpretation project. From the looks of this beautiful map—which you must see in Google Earth—seismic may see wide application in the future. 

And the possibilties in Google Earth, along with Google SketchUp, for presenting geospatial data shouldn't go unnoticed!

CLAS arrives in OpendTect

A log analysis plug-in for dGB Earth Science's open-source integrated interpretation tool OpendTect was announced at EAGE conference earlier this year, and now it's available. The tool was developed by Geoinfo, a small Argentinian geoscience tech shop, in partnership with dGB. So now you can compute all your seismic petrophysics right in OpendTect.

On a sort-of-related note, Bert Bril, one of dGB's founders, just launched his blog, I can't believe it's not SCRUM, about agile software development. He even posts about geophysics. Yay!

Agile* apps

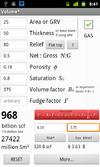
We're still regularly updating our completely free apps for Android. If you have an Android phone or tablet, go ahead and give them a spin. Volume* (right) is on version 3.1 already, and now does gas volumetrics, including Bg computation, and can grab any of the major crude oil benchmark prices for a quick-look value. And AVO* is just about to get a boost in functionality with an LMR plot; watch this space. Don't hold back if you've got requests. 

This regular news feature is for information only. We aren't connected with any of these people or organizations, and don't necessarily endorse their products or services. Unless we say we think they're great.

News of the week

Help us stay on top of the latest and greatest: if you hear about something that might make geophysics even awesomer for all of us, drop us a line! In the meantime, here's some news that caught our attention...

Free software goodness

Innovative Australian software shop DownUnder GeoSolutions, aka DUG, is now offering DUG Insight to students for free! As if one amazing free (as in beer) seismic visualization and interpretation tool wasn't enough—you do have OpendTect, right?—now there's another. Just email them a copy of your student ID, and they'll get you started. 

NEWSFLASH  Hard-up students might also like this: Nature Geoscience for $10 a year! 

S-ray vision

OK, it doesn't sound quite as cool as X-ray vision, but S-band microwaves really can see through walls. Sort of. Boffins at MIT demonstrate their claims in this video... it's not geophysics, but another hard inverse imaging problem.

Petrophysics for Dummies

Occasionally while wandering lost in the interweb you stumble on gold. This is gold. Graham Davies was a geoscientist at Enterprise Oil, the plucky British independent exploration company I did my first internship at. He's been recording petrophysics tutorials, and they're 100% brilliant. "Even if you've never heard of petrophysics before," claims Davis.

What the heck is the geoblogosphere?

Not really a geotechnical story, but some readers might be interested to know more about geoscience blogs. A recent research paper, Geißler et al 2011, is a good place to start. The authors, who include übergeoblogger Callan Bentley of the structural geology blog Mountain Beltway, do a terrific job of exploraing the reasons for blogging, the perceptions of employers and supervisors, and every other angle you can think of. 

NEWSFLASH The 315th Where on (Google) Earth geomorphological puzzle went unsolved for 11 days, but was finally solved this morning. Congratulations to Ron Schott, the next episode is yours to host.

This regular news feature is for information only. We aren't connected with any of these people or organizations, and don't necessarily endorse their products or services. 

News of the week

Some news and views from the world of geoscience this last fortnight.

Open source GIS on a thumb drive

If you ever wanted to get into open source geospatial software but didn't know where to start, check this out. Last month OSGeo, the open source geospatial foundation, released version 5 of their OSGeo-Live project. This is a bootable disk image containing 47 pieces of free software, including several full GIS, world maps, and quick-start guides. Amazing!

Probability and panic

The L'Aquila earthquake of April 2009 killed 308 people. Six seismologists are now on trial for manslaughter, not so much because they failed to predict the quake, but because they allegedly downplayed the risk of a severe event. Most geoscientists believe that we cannot predict earthquakes today; these seismologists are effectively accused of trying to predict a non-earthquake. We don't know, but suspect their intent was misinterpreted—always a danger when specialists communicate with non-specialists. There is no daily coverage of the trial that we are aware of, but there are occasional reports in the press. In this short video, Giustino Parisse explains why he is one of the plaintiffs.

Magical geobloggery

If you're new to blogs—maybe you got a tablet recently and are discovering how easy it is to read the web these days—you might not be aware that there's a lot of geology in the blogosphere. Finding writers you want to read isn't easy though. You could scroll down this page and look for our BLOGROLL for some leads, or head over to Highly Allochthonous and read the latest Accretionary Wedge, a regular meta-post. This month: practical advice for the lifelong learner. 

Communicating rocks

We recently learned of this terrific new book from University of Houston professor Peter Copeland (thanks to his colleague, Rob Stewart, for the tip!). We haven't actually got our hands on it yet, but the Amazon preview has whet our appetites for geo-communication tips galore. The publisher, Prentice Hall, has kept the price to a reasonable amount, close to $35. Get your copy now!

This regular news feature is for information only. We aren't connected with any of these organizations, and don't necessarily endorse their products or services. Public domain map image from the USGS. 

News of the week

A quick round up of geosciencey tech news at the end of a busy week at SEG.

Mmm, open source

Visualization company Kitware, makers of open source viz software Paraview, have released a new version of VTK, their toolkit for developers. Version 5.8 has new and improved Python wrappers and support for openGL inside documents. They are also offering free online courses for much of their technology. If you don't know their stuff, now's the time to check it out!

Real-time data toolbox

Twitter and geophysics? Maybe: they announced some open source goodness this week with their Storm library for real-time analysis of massive data streams. They developed it for analysing breaking news and global events, but we think it might have application in all kinds of real-time data processing problems like microseismic and production monitoring. Find the project on GitHub.

Not just another software company?

Dynamic Graphics, a small California company, caught our eye. Their low profile seems about to change, as their 'quantitative visualization' software looks ready to compete with anyone. Their focus on 4D and well-planning pits them against outfits like Transform Software, Down Under GeoSolutions, and of course all the usual suspects.

Learn Python!

Enthought are the leaders in scientific programming and especially support for Python, as well as on-demand development. They now offer a regular Python programming course just for geophysicists, and tour all over the world with it. The next edition is in Houston, 2–4 November. If you ever wanted to dabble with code, this is your chance: Python is easy to learn and very powerful.

This regular news feature is for information only. We aren't connected with any of these organizations, and don't necessarily endorse their products or services. Python is a trademark of the Python Software Foundation. ParaView and VTK are trademarks of Kitware. Storm is a trademark of Twitter, Inc.

News of the week

Dips from pics

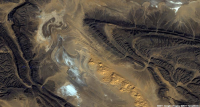
Algeria foldsIn collaboration with the Geological Survey of Canada, Pangaea Software have built a very nifty tool, Orion, for computing dip from satellite images and digital elevation models. With these two pieces of data, and some assumptions about scale, it's possible to deduce the dip of strata without getting your boots muddy. Matt heard all about this tool from the GSC collaborator, Paul Budkewitsch, at the 3P Arctic conference in Halifax last week; here's their abstract

CGGV Trilobit nodeOcean bottom investment

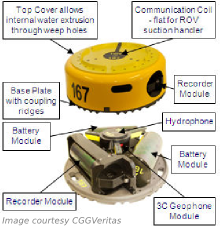
CGGVeritas has made a commitment to manufacture 800 new Trilobit four-component deepwater nodes for seismic acquisition, to add to its existing pool. The device has three oriented accelerometers plus a hydrophone in addition to an onboard battery and recording system. This all-in-one design can be deployed on the seabed by most ROVs, making it easy to place near platforms and other infrastructure that towed streamer and cable systems cannot access. 

Arguably the industry leader in cableless systems is FairfieldNodal, who are already deploying more than a thousand nodes. It's great to see a big player like CGGVeritas coming to compete with this potentially transformative technology.

Update for Insight Earth

Colorado-based software company TerraSpark has just announced the release of Insight Earth 1.6, an integrated volume interpretation tool. Enhancements include a more interactive data import and export interface, improved velocity modeling, and upgrades to the automated fault extraction. In a January post, Evan highlighted an article by Stan Hammon of TerraSpark on the computational and psychological factors affecting intellegent design. It's inspired stuff.

Re-introducing SubSurfWiki

AgileWiki is now SubSurfWiki, at subsurfwiki.org. Please change your bookmarks! We felt that it was a little too Agile-centric and want to appear as open web-space for anything subsurface. We want it to grow, deepen and diversify, and above all be useful. So check it out and let us know if you have any feedback on utility, appearance and content.

More news... If you like this, check out previous news posts from Agile*

Orion is a trademark of Pangaea Software. Insight Earth is a trademark of TerraSpark. SubSurfWiki is a trademark of Agile Geoscience. The satellite image is copyright of Google. This regular news feature is for information only. We aren't connected with any of these organizations, and don't necessarily endorse their products or services.

Beyond the experts

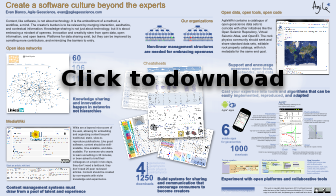
I presented a poster at the 1IWRP, and it was certainly a change in tone from the technical rigor of most other talks. Since I had a good discussion at the break with a number of people, I thought I would make a video out of it. If you've got six minutes, you can check it out:

In the video I make reference to a few other topics we've touched on earlier on the blog:

I hope to be getting into making more videos soon, so let me know if you like the format, and if you have any suggestions. 

Tuning geology

It's summer! We will be blogging a little less often over July and August, but have lots of great posts lined up so check back often, or subscribe by email to be sure not to miss anything. Our regular news feature will be a little less regular too, until the industry gets going again in September. But for today... here's the motivation behind our latest app for Android devices, Tune*.

Geophysicists like wedges. But why? I can think of only a few geological settings with a triangular shape; a stratigraphic pinchout or an angular unconformity. Is there more behind the ubiquitous geophysicist's wedge than first appears?

Seismic interpretation is partly the craft of interpreting artifacts, and a wedge model illustrates several examples of artifacts found in seismic data. In Widess' famous paper, How thin is a thin bed? he set out a formula for vertical seismic resolution, and constructed the wedge as an aid for quantitative seismic interpretation. Taken literally, a synthetic seismic wedge has only a few real-world equivalents. But as a purely quantitative model, it can be used to calibrate seismic waveforms and interpret data in any geological environment. In particular, seismic wedge models allow us to study how the seismic response changes as a function of layer thickness. For fans of simplicity, most of the important information from a wedge model can be represented by a single function called a tuning curve.
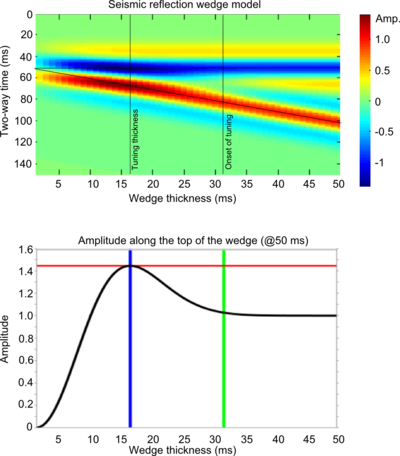
In this figure, a seismic wedge model is shown for a 25 Hz Ricker wavelet. The effects of tuning (or interference) are clearly seen as variations in shape, amplitude, and travel time along the top and base of the wedge. The tuning curve shows the amplitude along the top of the wedge (thin black lines). Interestingly, the apex of the wedge straddles the top and base reflections, an apparent mis-timing of the boundaries.

On a tuning curve there are (at least) two values worth noting; the onset of tuning, and the tuning thickness. The onset of tuning (marked by the green line) is the thickness at which the bottom of the wedge begins to interfere with the top of the wedge, perturbing the amplitude of the reflections, and the tuning thickness (blue line) is the thickness at which amplitude interference is a maximum.

For a Ricker wavelet the amplitude along the top of the wedge is given by:

where R is the reflection coefficient at the boundary, f is the dominant frequency and t is the wedge thickness (in seconds). Building the seismic expression of the wedge helps to verify this analytic solution.

Wedge artifacts

The synthetic seismogram and the tuning curve reveal some important artifacts that the seismic interpreter needs to know about, because they could be pitfalls, or they could provide geological information:

Bright (and dim) spots: A bed thickness equal to the tuning thickness (in this case 15.6 ms) has considerably more reflective power than any other thickness, even though the acoustic properties are constant along the wedge. Below the tuning thickness, the amplitude is approximately proportional to thickness.

Mis-timed events: Below 15 ms the apparent wedge top changes elevation: for a bed below the tuning thickness, and with this wavelet, the apparent elevation of the top of the wedge is actually higher by about 7 ms. If you picked the blue event as the top of the structure, you'd be picking it erroneously too high at the thinnest part of the wedge. Tuning can make it challenging to account for amplitude changes and time shifts simultaneously when picking seismic horizons.

Limit of resolution: For a bed thinner than about 10 ms, the travel time between the absolute reflection maxima—where you would pick the bed boundaries—is not proportional to bed thickness. The bed appears thicker than it actually is.

Bottom line: if you interpret seismic data, and you are mapping beds around 10–20 ms thick, you should take time to study the effects of thin beds. We want to help! On Monday, I'll write about our new app for Android mobile devices, Tune*. 

Reference

Widess, M (1973). How thin is a thin bed? Geophysics, 38, 1176–1180.