News of the week

CCGVeritas moves towards a million channels
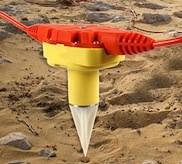
DSU1 receiverSercel, a subsidiary of CGGVeritas, has introduced new data transmission technology, Giga Transverse, an add-on to the 428XL land acquisition system. The technology increases the maximum channels per line from 10 000 to 100 000, and brings them a big step closer to the possiblity of one million channels on a single job. It will immediately benefit their UltraSeis offering for high-density point-receiver land acquisition. They also refreshed the DSU1 receiver (left), making it smaller and sharper. Young geophysicists must be salivating over the data they will be processing and interpreting in the decades to come.

Petrophysics coming to OpendTect

dGB has a built a comprehensive software suite for the seismic world, but OpendTect is a little light on petrophysics and log analysis. Not anymore! There's a new plugin coming to OpendTect, from Argentinian company Geoinfo: CLAS, or Computer Log Analysis Software. This will make the software attractive to a wider spread of the subsurface spectrum. dGB are on a clear path to creating a full-featured, deeply integrated platform. And OpendTect is open source, so petrophysicists may enjoy creating their own programs and plugins for working with well log data.

Petrel 2011 incorporates knowledge sharing

In Petrel, Schlumberger is introducing a multi-faceted knowledge environment for the entire spectrum of subsurface specialists. The announced improvements for the 2011 version include coordinate conversion for seismic data, better seismic flattening, more interpretation functions, and, most interesting of all, introduces the Studio™ environment. Geoscientists and engineers can search and browse projects, select data, and customize their screens by creating personal collections of often-used processes. It doesn't sound as interactive or social as the awaited Convofy for GeoGraphix, but it is good to see software companies thinking about large-scale, long-term knowledge issues, and it already exists!

Open source vizualization virtualization
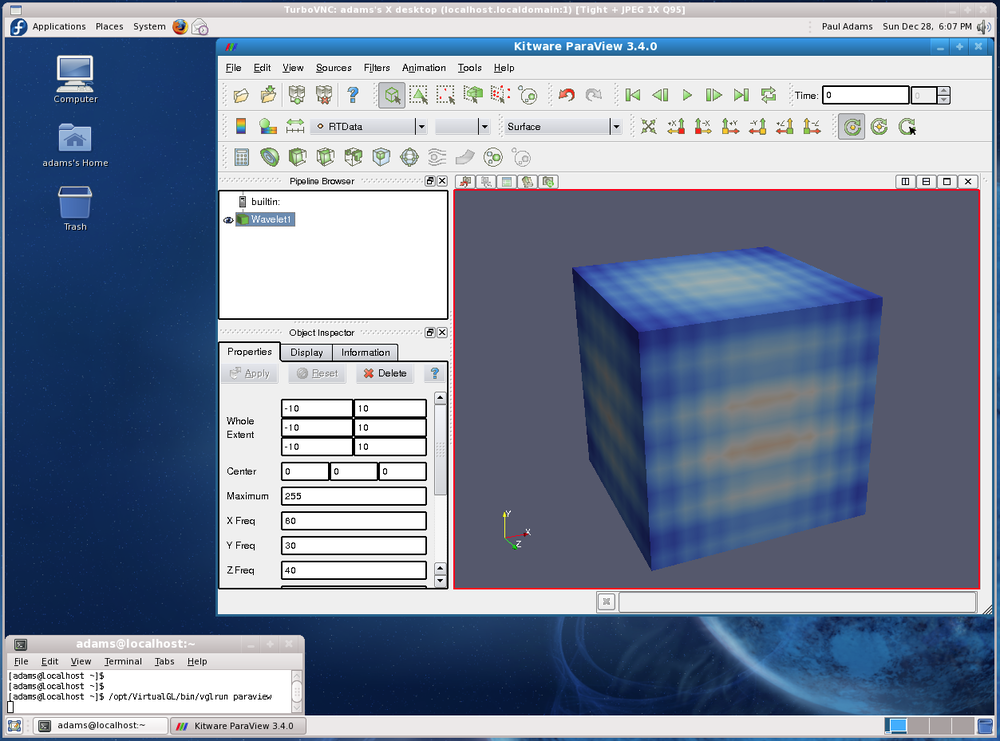
High-end visualizaiton performance on a laptop... perhaps even a tablet! TurboVNC in action in the US government. Image: US Data Analysis & Assessment Center wiki.Australian E&P company Santos Ltd recently won the 2011 Red Hat Innovator of the Year award. From the award submission: "Santos has been burnt in the past by hanging its hat on proprietary solutions only to have them rendered uneconomical through being acquired by bigger fish. So for Santos, the move to open source—and to Red Hat—also proved to be a security blanket, as they could be assured that no one could walk in and take its solution away".  Borne out of an explosion of geo-computing costs, and their desire to push the limits of technology, the company sponsored the TurboVNC and VirtualGL projects. The result: users can interpret from anywhere using a standard issue laptop (with dual 24" monitors when at their desks), achieving better performance than traditional workstations. Great foresight! What are you doing about your geo-computing problems?

This regular news feature is for information only. We aren't connected with any of these organizations, and don't necessarily endorse their products or services. Petrel and Studio are trademarks of Schlumberger. Giga Transverse is a trademark of Sercel. Low res DSU1 image from Sercel marketing material.

News of the week

A geoscience and technology news round-up. If you spot anything we can highlight next week, drop us a line!

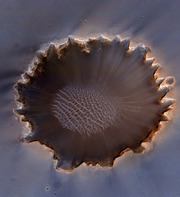
Using meteorite impacts as seismic sources on Mars

On Earth and Mars alike, when earthquakes (or Marsquakes) occur, they send energy into the planet's interior that can be used for tomographic imaging. Because the positions of these natural events is never known directly, several recording stations are required to locate these data by triangulation. The earth has an amazing array of stations but not Mars. 

Nick Teanby and James Wookey, geophysicists at the University of Bristol, UK (@UOBEarthScience on Twitter), invvestigated whether meteorite impacts on Mars provide a potentially valuable seismic signal for seeing into the interior of the planet. Because new craters can be resolved precisely from orbital photographs, accurate source positions can be determined without triangulation, and thus used in imaging. 

Investigation showed that seismicity induced by most meteorites is detectable, but only at short ranges, and good for investigating the near surface. Only the largest impacts, which only happen about once every ten years, are strong enough for deep imaging. Read more in their Physics of the Earth and Planetary Interiors paper here. Image credit: NASA/JPL.

Geomage acquires Petro Trace 

Seismic processing company, Geomage, has joined forces with Petro Trace Services in a move to become a full-workflow seismic processing service shop. The merging of these two companies will likely make them the largest geophysical service provider in Russia. Geomage has a proprietary processing technology called Multifocusing, and uses Paradigm's software for processing and interpretation. Click here to read more about the deal.

New bathymetric data for Google Earth

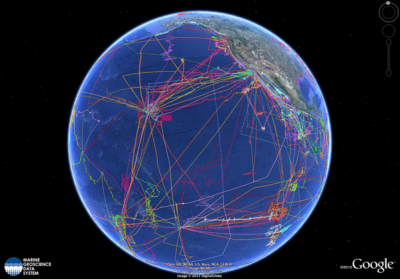
Google Earth now contains bathymetric data from more than two decades of seafloor scanning expeditions. The update was released on World Oceans Day, and represents 500 different surveys covering the size of North America. This new update will allow you to plan your next virtual underwater adventure or add more flair to your envrionmental impact assessment. Google Earth might have to seriously reconsider adapting their streetview name to what,... fishview? Wired.com has a nice demo to get you started. Image: Google Earth.

Workshop: open source software in geophysics

The AAPG's Petroleum Technology Transfer Council, PTTC, is having a workshop on open source software next week. The two-day workshop is on open software tools and reproducibility in geophysics, and will take place at the Houston Research Center in west Houston. Matt will be attending, and is talking about mobile tools on the Friday afternoon. There are still places, and you can register on the University of Texas at Austin website; the price is only $300, or $25 for students. The organizer is Karl Schleicher of UT and BEG.

This regular news feature is for information only. We aren't connected with any of these organizations, and don't necessarily endorse their products or services. Image of Mars credit: NASA/JPL-caltech/University of Arizona. Image of Earth: Google, TerraMetrics, DigitalGlobe, IBCAO.

Volumetrics on the back of a digital envelope

A few weeks ago we launched our first mobile app, Volume*, now available in the Android Market (you can jump right to it with the barcode on the right). If you have an Android phone or tablet, please check it out! Today, I thought I'd write a bit more about I built the app, show you some of the gory details, and tell you about the latest update.

Read More

The core of the conference

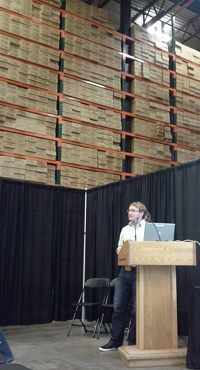
Andrew Couch of Statoil answering questions about his oil sands core, standing in front of a tiny fraction of the core collection at the ERCBToday at the CSPG CSEG CWLS convention was day 1 of the core conference. This (unique?) event is always well attended and much talked-about. The beautiful sunshine and industry-sponsored lunch today helped (thanks Weatherford!).

One reason for the good turn-out is the incredible core research facility here in Calgary. This is the core and cuttings storage warehouse and lab of the Energy Resources Conservation Board, Alberta's energy regulator. I haven't been to a huge number of core stores around the world, but this is easily the largest, cleanest, and most efficient one I have visited. The picture gives no real indication of the scale: there are over 1700 km of core here, and cuttings from about 80 000 km of drilling. If you're in Calgary and you've never been, find a way to visit. 

Ross Kukulski of the University of Calgary is one of Stephen Hubbard's current MSc students. Steve's students are consistently high performers, with excellent communication and drafting skills; you can usually spot their posters from a distance. Ross is no exception: his poster on the stratigraphic architecture of the Early Cretaceous Monach Formation of NW Alberta was a gem. Ross has integrated data from about 30 cores, 3300 (!) well logs, and outcrop around Grand Cache. While this is a fairly normal project for Alberta, I was impressed with the strong quantitative elements: his provenance assertions were backed up with Keegan Raines' zircon data, and channel width interpretation was underpinned by Bridge & Tye's empirical work (2000; AAPG Bulletin 84).

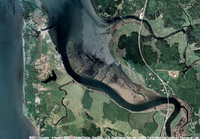
The point bar in Willapa Bay where Jesse did his coring. Image from Google Earth. Jesse Schoengut is a MSc student of Murray Gingras, part of the ichnology powerhouse at the University of Alberta. The work is an extension of Murray's long-lived project in Willapa Bay, Washington, USA. Not only had the team collected vibracore along a large point bar, but they had x-rayed these cores, collected seismic profiles across the tidal channel, and integrated everything into the regional dataset of more cores and profiles. The resulting three-dimensional earth model is helping solve problems in fields like the super-giant Athabasca bitumen field of northeast Alberta, where the McMurray Formation is widely interpreted to be a tidal estuary somewhat analogous to Willapa. 

Greg Hu of Tarcore presented his niche business of photographing bitumen core, and applying image processing techniques to complement and enhance traditional core descriptions and analysis. Greg explained that unrecovered core and incomplete sampling programs result in gaps and depth misalignment—a 9 m core barrel can have up to several metres of lost core which can make integrating core information with other subsurface information intractable. To help solve this problem, much of Tarcore's work is depth-correcting images. He uses electrical logs and FMI images to set local datums on centimetre-scale beds, mud clasts, and siderite nodules. Through color balancing, contrast stretching, and image analysis, shale volume (a key parameter in reservoir evaluation) can be computed from photographs. This approach is mostly independent of logs and offers much higher resolution.

It's awesome how petroleum geologists are sharing so openly at this core workshop, and it got us thinking: what would a similar arena look like for geophysics or petrophysics? Imagine wandering through a maze of 3D seismic volumes, where you can touch, feel, ask, and learn.

Don't miss our posts from day 1 of the convention, and from days 2 and 3.

Noise, sampling, and the Horn River Basin

Some highlights from day 1 of GeoCon11, the CSPG CSEG CWLS annual convention in Calgary.

Malcolm Lansley of Sercel, with Peter Maxwell of CGGVeritas, presented a fascinating story of a seismic receiver test in a Maginot Line bunker in the Swiss Alps. The goal was to find one of the quietest places on earth to measure the sensitivity to noise at very low frequencies. The result: if signal is poor then analog geophones outperform MEMS accelerometers in the low frequency band, but MEMS are better in high signal:noise situations (for example, if geological contrasts are strong).

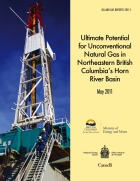
Click for the reportWarren Walsh and his co-authors presented their work mapping gas in place for the entire Horn River Basin of northeast British Columbia, Canada. They used a stochastic approach to simulate both free gas (held in the pore space) and adsorbed gas (bound to clays and organic matter). The mean volume: 78 Tcf, approximately the same size as the Hugoton Natural Gas Area in Kansas, Texas, and Oklahoma. Their report (right) is online

RECON Petrotechnologies showed results from an interesting physical experiment to establish the importance of well-log sample rate in characterizing thin beds. They constructed a sandwich of gyprock, between slices of aluminium and magnesium, then pulled a logging tool through a hole in the middle of the sandwich. An accurate density measurement in a 42-cm thick slice of gyprock needed 66 samples per metre, much higher than the traditional 7 samples per metre, and double the so-called 'high resolution' rate of 33 samples per metre. Read their abstract

Carl Reine at Nexen presented Weighing in on seismic scale, exploring the power law relationship of fracture lengths in Horn River shales. He showed that the fracture system has no characteristic scale, and fractures are present at all lengths. Carl used two independent seismic techniques for statistically characterizing fracture lengths and azimuths, which he called direct and indirect. Direct fault picking was aided by coherency (a seismic attribute) and spectral decomposition; indirect fault picking used 3D computations of positive and negative curvature. Integrating these interpretations with borehole and microseismic data allowed him to completely characterize fractures in a reservoir model. (See our post about crossing scales in interpretation.)

Evan and Matt are tweeting from the event, along with some other attendees; follow the #geocon11 hashtag to get the latest.


What changes sea-level?

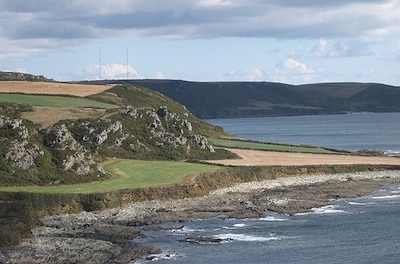
Relative sea-level is complicated. It is measured from some fixed point in the sediment pile, not a fixed point in the earth. So if, for example, global sea-level (eustasy) stays constant but there is local subsidence at a fault, say, then we can say that relative sea-level has increased. Another common cause is isostatic rebound during interglacials, causing a fall in relative sea-level and a seaward regression of the coastline. Because the system didn't build out into the sea by itself, this is sometimes called a forced regression. Here's a nice example of a raised beach formed this way, from Langerstone Point, near Prawle in Devon, UK:

Image: Tony Atkin, licensed under CC-BY-SA-2.0. From Wikimedia Commons

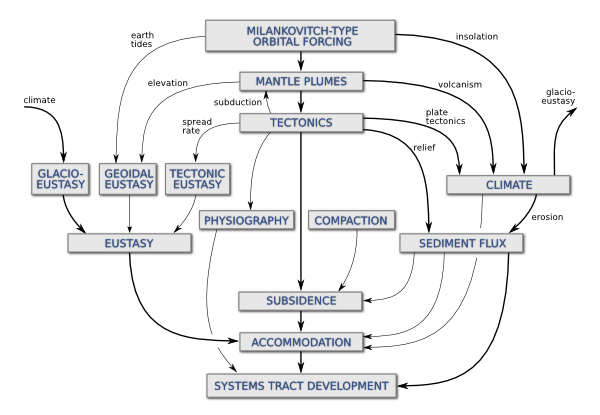
Two weeks ago I wrote about some of the factors affecting relative sea-level, and the scales on which those processes operate. Before that, I had mentioned my undergraduate fascination with Milankovitch cyclicity and its influence on a range of geological processes. Complexity and interaction were favourite subjects of mine, and I built on this a bit in my graduate studies. To try to visualize some of the connectedness of the controls on sea-level, I drew a geophantasmagram that I still refer to occasionally:

Accommodation refers to the underwater space available for sediment deposition; it is closely related to relative sea-level. The end of the story, at least as far as gross stratigraphy is concerned, is the development of stratigraphic package, like a shelf-edge delta or a submarine fan. Systems tracts is just a jargon term for these packages when they are explicitly related to changes in relative sea-level. 

I am drawn to making diagrams like this; I like mind-maps and other network-like graphs. They help me think about complex systems. But I'm not sure they always help anyone other than the creator; I know I find others' efforts harder to read than my own. But if you have suggestions or improvements to offer, I'd love to hear from you.

Best online geological maps

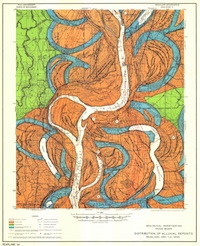
Fisk map of Mississippi RiverOne of Fisk's beautiful maps of the Mississippi River, near Readland, Arkansas. Click the map to see more detail.Like most earth scientists I know, I love maps. As a child, I pored over the AA Atlas of Britain on long car journeys. As a student, I spent hours making my first geological map. As an orienteer I learned to read maps running through rhododendron bushes in the rain. As a professional geoscientist, my greatest pleasure is still producing a fine map.

When I worked on the McMurray Formation of Alberta, my colleague came across Harold Fisk's incredible maps of the Mississippi River. These maps have to be seen to be believed, and for me they show how far computers have to go before they can be considered to have replaced paper. The effort and commitment is palpable. If I ever produce anything half as beautiful in my career, I will consider myself privileged. Even more marvellously, since they were made by the Army Corps of Engineers, they are all downloadable for free.

This resource made me wonder what other maps are out there on the web. Not surprisingly, there are lots, and some are quite special. Here's a list of my favourites:

No doubt I have missed some. If you have a favourite of your own, please add it to the comments or drop me a line and I'll be happy to post a follow-up.

Scales of sea-level change

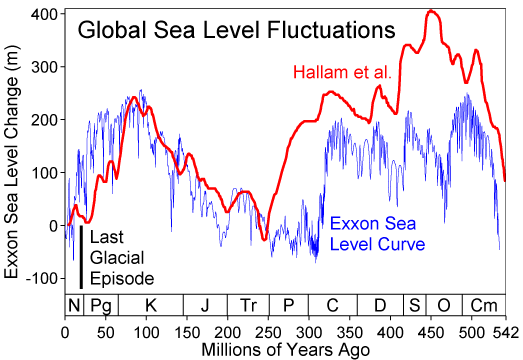
Relative sea-level curve for the PhanerozoicClick to read about sea level on Wikipedia. Image prepared by Robert Rohde and licensed for public use under CC-BY-SA.Sea level changes. It changes all the time, and always has (right). It's well known, and obvious, that levels of glaciation, especially at the polar ice-caps, are important controls on the rate and magnitude of changes in global sea level. Less intuitively, lots of other effects can play a part: changes in mid-ocean ridge spreading rates, the changing shape of the geoid, and local tectonics.

A recent paper in Science by Petersen et al (2010) showed evidence for mantle plumes driving the cyclicity of sedimentary sequences. This would be a fairly local effect, on the order of tens to hundreds of kilometres. This is important because some geologists believe in the global correlatability of these sequences. A fanciful belief in my view—but that's another story.

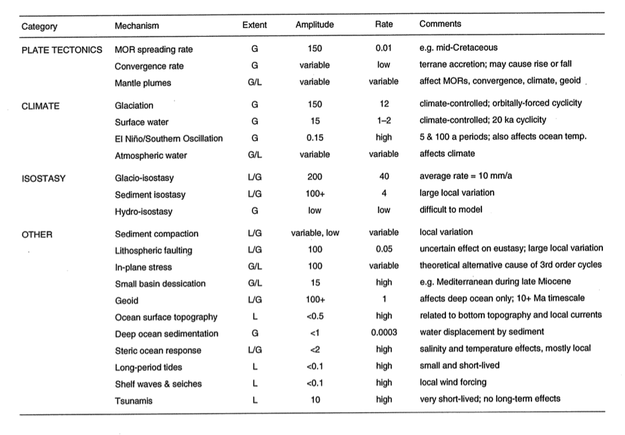
The paper reminded me of an attempt I once made to catalog the controls on sea level, from long-term global effects like greenhouse–icehouse periods, to short-term local effects like fault movement. I made the table below. I think most of the data, perhaps all of it, were from Emery and Aubrey (1991). It's hard to admit, because I don't feel that old, but this is a rather dated publication now; I think it's solid enough for the sort of high-level overview I am interested in. 

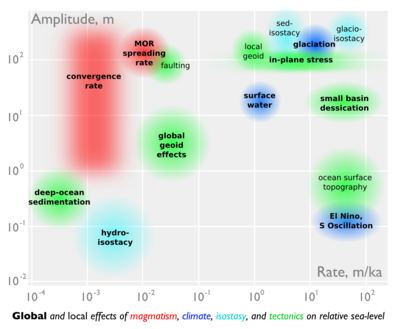
After last week's doodling, the table inspired me to try another scale-space cartoon. I put amplitude on the y-axis, rate on the x-axis. Effects with global reach are in bold, those that are dominantly local are not. The rather lurid colours represent different domains: magmatic, climatic, isostatic, and (in green) 'other'. The categories and the data correspond to the table.
Infographic: scales of sea level changeIt is interesting how many processes are competing for that top right-hand corner: rapid, high-amplitude sea level change. Clearly, those are the processes we care about most as sequence stratigraphers, but also as a society struggling with the consequences of our energy addiction.

References
Emery, K & D Aubrey (1991). Sea-levels, land levels and tide gauges. Springer-Verlag, New York, 237p.
Petersen, K, S Nielsen, O Clausen, R Stephenson & T Gerya (2010). Small-scale mantle convection produces stratigraphic sequences in sedimentary basins. Science 329 (5993) p 827–830, August 2010. DOI: 10.1126/science.1190115

The scales of geoscience

Helicopter at Mount St Helens in 2007. Image: USGS.Geoscientists' brains are necessarily helicoptery. They can quickly climb and descend, hover or fly. This ability to zoom in and out, changing scale and range, develops with experience. Thinking and talking about scales, especially those outside your usual realm of thought, are good ways to develop your aptitude and intuition. Intuition especially is bound to the realms of your experience: millimetres to kilometres, seconds to decades. 

Being helicoptery is important because processes can manifest themselves in different ways at different scales. Currents, for example, can result in sorting and rounding of grains, but you can often only see this with a hand-lens (unless the grains are automobiles). The same environment might produce ripples at the centimetre scale, dunes at the decametre scale, channels at the kilometre scale, and an entire fluvial basin at another couple of orders of magnitude beyond that. In moments of true clarity, a geologist might think across 10 or 15 orders of magnitude in one thought, perhaps even more.

A couple of years ago, the brilliant web comic artist xkcd drew a couple of beautiful infographics depicting scale. Entitled height and depth (left), they showed the entire universe in a logarithmic scale space. More recently, a couple of amazing visualizations have offered different visions of the same theme: the wonderful Scale of the Universe, which looks at spatial scale, and the utterly magic ChronoZoom, which does a similar thing with geologic time. Wonderful.

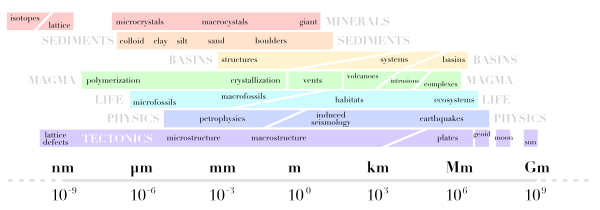
These creations inspired me to try to map geological disciplines onto scale space. You can see how I did below. I do like the idea but I am not very keen on my execution. I think I will add a time dimension and have another go, but I thought I'd share it at this stage. I might even try drawing the next one freehand, but I ain't no Randall Munroe.

I'd be very happy to receive any feedback about improving this, or please post your own attempts!

What is shale?

Until four or five years ago, it was enough just to know that shale is that dark grey stuff in between the sands. Being overly fascinated with shale was regarded as a little, well, unconventional. To be sure, seals and source rocks were interesting and sometimes critical, but always took a back seat to reservoir characterization.

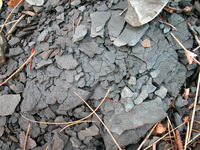
Well, now the shale is the reservoir. So how do we characterize shale? We might start by asking: what is shale, really? Is it enough to say, "I don't know, but I know it when I see it"? No: sometimes you need to know what to call something, because it affects how it is perceived, explored for, developed, and even regulated.

Alberta government

Section 1.020(2)(27.1) of the Oil and Gas Conservation Regulations defines shale:

a lithostratigraphic unit having less than 50% by weight organic matter, with less than 10% of the sedimentary clasts having a grain size greater than 62.5 micrometres and more than 10% of the sedimentary clasts having a grain size less than 4 micrometres.
ERCB Bulletin 2009-23

This definition seems quite strict, but it open to interpretation. 'Ten percent of the sedimentary clasts' might be a very small volumetric component of the rock, much less than 10%, if those 'clasts' are small enough. I am sure they meant to write '...10% of the bulk rock volume comprising clasts having a grain size...'.

Read More