Why do wavelets have sidelobes?

Brian Romans (a geology professor at Virginia Tech) asked a great question in the Software Underground’s Slack earlier this month:

I was teaching my Seismic Stratigrapher course the other day and a student asked me about the origin of ‘side lobes’ on the Ricker wavelet. I didn’t have a great answer [...] what is a succinct explanation for the side lobes?

Questions like this are fantastic because they really aren’t easy to answer. There’s usually a breadcrumb trail of concepts that lead to an answer, but the trail might be difficult to navigate, and some of those breadcrumbs will lead to more questions… and soon you’ve written a textbook on signal processing.

Here’s how I attempted, rather long-windedly, to help Brian’s student (edited a bit for brevity):

Wavelets measure displacement, or velocity, or acceleration (or some proxy for these things like voltage or capacitance), but eventually we can compute a signal that represents displacement. (In seismic reflection surveys, we don't care about the units.)

The Ricker wavelet represents an impulsive signal (the 'bang' of dynamite or the 'pop' of an airgun; let's leave Vibroseis out of it for now). The impulse is bandlimited ('band' as in radio band) — in other words, it doesn't contain all frequencies. Unfortunately, you need a lot of frequencies to represent very sudden or abrupt (short in time) things like bangs and pops, otherwise they spread out in time. Since our wavelet is restricted to a band of frequencies (eg 10 to 80 Hz), it must be (infinitely) spread out in time.

Additionally, since the frequencies don't contain what we call a 'DC' signal (0 Hz, in other words a bias or shift), it must return to zero when displaced. So it starts and ends on zero amplitude.

So the wavelet is spread out, and it starts and ends on zero amplitude. Why does it wiggle? In other words, why is seismic oscillatory? It's not the geophone: although it contains a spring (or something like one), its specially chosen/tuned to be able to move freely at the frequencies we're trying to record. So it's the stiffness of the earth itself which causes the oscillation, dissipating the vibrational energy (as heat) and damping the signal. At least, this explains why it dies out, but not really why it oscillates... Physics! Simple harmonic motion! Or something.

Yeah, I guess I’m a bit hazy on the micro-mechanics of wave propagation. Evan came to my rescue (see below), but I had a couple more things to say first:

The other thing is that classic wavelets like the Ricker are noncausal, aka non-realizable, because they have energy at negative time (i.e. they are centered around t = 0) and there’s no such thing as negative time. This is a clue that a zero-phase wavelet is a geological convenience contrived during processing, not a physical thing. The field seismic data would contain a so-called 'minimum phase' wavelet, which looks more like what you'd expect a recording of a dynamite blast to look like (see below).

To try to make up for the fact that I trailed off at ‘simple harmonic motion’, Evan offered this:

If you imagine the medium being made up of a bunch of particles, then propagating a wave means causing a stress (say, sudden compression at the surface) and then stretching and squeezing those particles to accommodate that stress. A compression (which we may measure or draw as a peak) does not come without a stretching (a dilation or trough) of particles on either side. So a side lobe (or a dilation) has to exist in a way: the particles are connected together and stretch and squeeze when they feel pressure.

Choice of wavelet matters

There was more from Doug McClymont, who’s always up for some chat about wavelets. He pointed out that although high-bandwidth Ormsby wavelets have more sidelobes, they generally have lower amplitudes than a Ricker wavelet, whose sidelobes always have the same ampitude (exactly \( 2 \mathrm{e}^{-3/2} \)). He added:

I tend not to use Ricker wavelets for very much as you can't control the bandwidth of them (just the peak frequency) so they tend to be very narrow-band and have quite high (and constant) amplitude side lobes. As I work a lot with broadband seismic data I use Ormsby wavelets much more for any well-ties and seismic modelling.

Good reasons to use an Ormsby wavelet as your analaytic wavelet of choice! Check out this other post all about Ormsby wavelets and how to make them.

What do you think? Do you have an intuitive explanation for why wavelets have sidelobes? Ideally shorter than mine!

Rocks in the Playground

It’s debatable whether neural networks should feature in an introductory course on machine learning. But it’s hard to avoid at least mentioning them, and many people are attracted to machine learning courses because they have heard so much about deep learning. So, reluctantly, we almost always get into neural nets in our Machine learning for geoscientists classes.

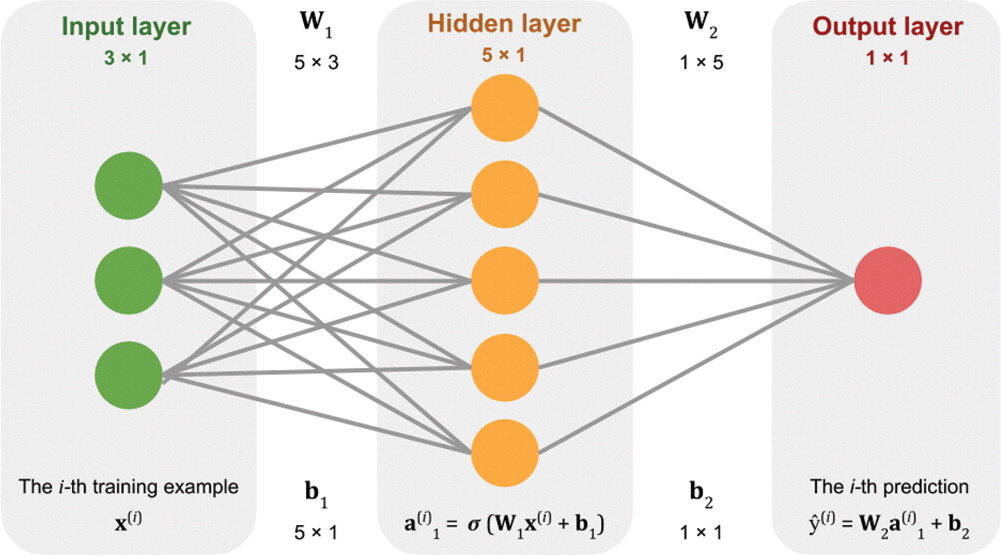
Our approach is to build a neural network from scratch, using only standard Python and NumPy data structures — that is, without using a specialist deep-learning framework. The code is all adapted from Gram Ganssle’s awesome Leading Edge tutorial from 2018. I like it because it lays out the components — the data, the activation function, the cost function, the forward pass, and all the steps involved in backpropagation — then combines them into a working neural network.

Figure 2 from Gram Ganssle’s 2018 tutorial in the Leading Edge. Licensed CC BY.

Figure 2 from Gram Ganssle’s 2018 tutorial in the Leading Edge. Licensed CC BY.

One drawback of our approach is that it would be quite fiddly to change some aspects of the network. For example, adding regularization, which almost all networks use, or even just adding another layer, are both beyond the scope of the class. So I like to follow it up with getting the students to build the same network using the scikit-learn library’s multilayer perceptron model. Then we build the same network using the PyTorch framework. (And one could do it in TensorFlow too, of course.) All of these libraries make it easier to play with the various options.

Introducing the Rocky Playground

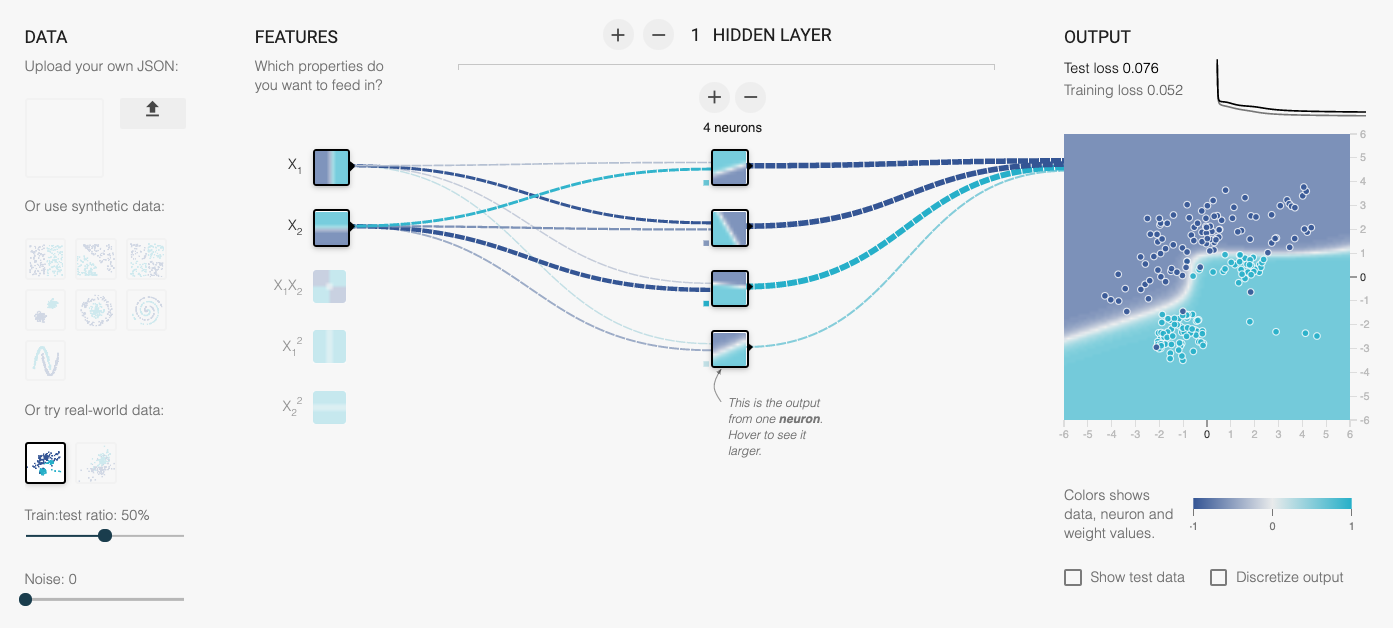
Now we have another tool — one that makes it even easier to change parameters, add layers, use regularization, and so on. The students don’t even have to write any code! I invite you to play with it too — check out the Rocky Playground, an interactive deep neural network you can see inside.

Part of the user interface. Click on the image to visit the site.

Part of the user interface. Click on the image to visit the site.

This tool is a fork of Google’s well-known Neural Network Playground, as described at the bottom of our tool’s page. We made a few changes:

  • Added several new real and synthetic datasets, with descriptions.

  • There are more activation functions to try, including ELU and Swish.

  • You can change the regularization during training and watch the weights.

  • Anyone can upload their own dataset! (These stay on your computer, they are not uploaded anywhere.)

  • We added an the expression of the network in Python code.

One of the datasets we added is the same shear-sonic prediction dataset we use in the neural network class. So students can watch the same neural net they built (more or less) learn the task in real time. It’s really very cool.

I’ve written before about different expressions of mathematical ideas — words, symbols, annotations, code, etc. — and this is really just a natural extension of that thought. When people can hear and see the same idea in three — or five, or ten — different ways, it sticks. Or at least has a better chance of sticking.

What do you think? Do this tool help you? Could you use it for teaching? If you have suggestions feel free to drop them here in the comments, or submit an issue to the tool’s repo. We’d love your help to make it even more useful.

New virtual training for digital geoscience

Looking to skill up before 2022 hits us with… whatever 2022 is planning? We have quite a few training classes coming up — don’t miss out! Our classes use 100% geoscience data and examples, and are taught exclusively by earth scientists.

We’re also always happy to teach special classes in-house for you and your colleagues. Just get in touch.

Special classes for CSEG in Calgary

Public classes with timing for Americas

  • Geocomputing: week of 22 November

  • Machine Learning: week of 6 December

Public classes with timing for Europe, Africa and Middle East

  • Geocomputing: week of 27 September

  • Machine Learning: week of 8 November

So far we’ve taught 748 people on the Geocomputing class, and 445 on the Machine Learning class — this wave of new digital scientists is already doing fascinating new work and publishing new research. I’m very excited to see what unfolds over the next year or two!

Find out more about Agile’s public classes by clicking this big button:

Are virtual conferences... awful?

Yeah, mostly. But that doesn’t mean that we just need to get back to ‘normal’ conferences — those are broken too, remember?

Chris Jackson, now at Manchester, started a good thread the other day:

This led, in a roundabout way, to some pros and cons — some of which are just my own opinions:

Good things about LIVE conferences

  • You get to spend a week away from work.

  • When you’re there, you’re fully focused.

  • You’re somewhere cool or exotic, or in Houston.

  • You get to see old friends again.

  • (Some) early career people get to build their networks. You know which ones.

  • There is technical content.

BAD things about LIVE conferences

  • You’re away from your home for a week.

  • You have to travel to a remote location.

  • You’re trapped in a conference centre.

  • The networking events are lame.

  • Well, maybe ECRs can make connections… sorry, who’s your supervisor again?

  • There’s so much content, and some of it is boring.

Good things about VIRTUAL conferences

  • Take part — and meet people — from anywhere!

  • The cost is generally low and more accessible.

  • You’re not away from work or home.

  • They are much easier to organize.

  • Live-streaming or posting to YouTube is easy-peasy.

  • No-one needs to give millions of research dollars to airline and hotel companies.

Bad things about VIRTUAL conferences

  • You don’t actually get to meet anyone.

  • Tech socs don’t make money from free webinars.

  • So many distractions!

  • The technology is a hassle to deal with.

  • If you’re in the wrong timezone, too bad for you.

  • The content is the same as live conferences, and some of it is even worse as a digital experience. And we’re all exhausted from all-day Zoom. And…

My assertion is that most virtual conferences are poor because all most organizers have really done is transpose a poor format, which was at least half-optimized for live events, to a pseudodigital medium. And — surprise! — the experience sucks.

So what now?

What now is that it’s beyond urgent to fix damn conferences. A huge part of the problem — and the fundamental reason why most virtual conferences are so bad — is that most of the technical societies completely failed to start experimenting with new, more accessible, more open formats a decade ago. This, in spite of the fact that, to a substantial extent, the societies are staffed by professional event organizers! These professionals weren’t paying attention to digital technology, or openness and reproducibility in science, or accessibility to disadvantaged and underrepresented segments of the community. I don’t know what they were paying attention to (okay, I do know), but it wasn’t primarily the needs of the scientific community.

Okay okay, sheesh, actually what now?

Sorry. Anyway, the thing to do is to focus on the left-hand columns in those lists up there, and try to eliminate the things on the right. So here are some things to start experimenting with. When? Ideally 2012 (the year, not the time). But tomorrow will do just fine. In no particular order:

  • Focus on the outcomes — conferences are supposed to serve their community of practice. So ask the community — what do you need? What big unsolved problems can we solve to move our science forward? What social or community problems are stopping us from doing our best work? Then design events to move the needle on that.

  • Distributed events — Local chapters hire awesome, interesting, cool spaces for local face-to-face events. People who can get to these locations are encouraged to show up at them — because there are interesting humans there, the coffee is good, and the experience is awesome.

  • Virtually connected — The global event is digitally connected, so that when we want to do global things with lots of people, we can. This also means being timezone agnostic by recording or repeating important bits of the schedule.

  • Small is good — You’re experimenting, don’t go all-in on your first event. Small is less stress, lower risk, more sustainable, and probably a better experience for participants. Want more reach? There are other ways.

  • Dedicated to open, accessible participation — We need to seize the idea that events should accommodate anyone who wants to participate, wherever they are and whatever their means. Someone asking, “How do we make sure the right people are there?” is a huge warning sign.

  • Meaningful networking — Gathering people in a Hilton ballroom with cheap beer, frozen canapés, and a barbershop quartet is not networking, it’s a bad wedding party. Professionals want to forge lasting connections by collaborating with each other on deep or valuable problems. I don’t think non-technical event organizers realize that we actually love our work and technical collaboration is fun. Create the conditions for that kind of work, and the socializing will happen.

  • Diversity as a superpower — Focus on increasing every dimension of diversity at your events, and good things will follow. For example: stop talking about hackathons as ‘great for students’ — no wonder ECRs need networking opportunities if you create events that seal them off from everyone! How do you do this? Increase the diversity of your organizing task force.

  • Stop doing the following things — endless talks (settle down, some talks are fine), digital posters, panels of any kind, ‘discussion’ that involves one person talking at a time, and all the other broken models of collaboration. Not sure what to replace them with? Read about open space technology, world cafe, unconferences, unsessions, hackathons, datathons, lightning talks, birds of a feather, design charettes, idea jams. General rule, if most of the people in an event can be described as ‘audience’ and not ‘participants’, you’re doing it wrong. Conversation, not discussion.

  • Stop trying to control the whole experience — most conference organizers seem to think they have to organize every aspect of a conference. In fact, the task is to create the conditions for the community to organize itself — bring its own content, make its own priorities, solve its own problems.

I know it probably looks like I’m proposing to burn everything down, but I’m really not proposing that we shred everything and only organize wacky events from now on. Some traditional formats may, in some measure, be fit for purpose. My point is that we need to experiment with new things, as soon as possible. Experiment, pay attention, adjust, repeat. (And it takes at least three iterations to learn about something.)

If you’re interested in doing more with conferences and scientific events in general, I’ve compiled a lot of notes over the years since Agile has been experimenting with formats. Here they are — please use and share and contribute back if you wish.

I’m also always happy to brainstorm events with you, no strings attached! Just get in touch: matt@agilescientific.com

Last thing: We try to organize meetings like this in the Software Underground. Join us!

100 years of seismic reflection

Where would we be without seismic reflection? Is there a remote sensing technology that is as unlikely, as difficult, or as magical as the seismic reflection method? OK, maybe neutrino tomography. But anyway, seismic has contributed a great deal to society — helping us discover and describe hydrocarbon resources, aquifers, geothermal anomalies, sea-floor hazards, and plenty more besides.

It even indirectly led to the integrated circuit, but that’s another story.

Depending on who you ask, 9 August 2021 may or may not be the 100th anniversary of the seismic reflection method. Or maybe 5th August. Or maybe it was June or July. But there’s no doubt that, although the first discovery with seismic did not happen until several years later, 1921 was the year that the seismic reflection method was invented.

Ryan, Karcher and Haseman in the field, August 1921. Badly colourized by an AI.

Ryan, Karcher and Haseman in the field, August 1921. Badly colourized by an AI.

The timeline

I’ve tried to put together a timeline by scouring a few sources. Several people — Clarence Karcher (a physicist), William Haseman (a physicist), Irving Perrine (a geologist), William Kite (a geologist) at the University of Oklahoma, and later Daniel Ohern (a geologist) — conducted the following experiments:

  • 12 April 1919 — Karcher recorded the first exploration seismograph record near the National Bureau of Standards (now NIST) in Washington, DC.

  • 1919 to 1920 — Karcher continues his experimentation.

  • April 1921 — Karcher, whilst working at the National Bureau of Standards in Washington, DC, designed and constructed apparatus for recording seismic reflections.

  • 4 June 1921 — the first field tests of the refleciton seismograph at Belle Isle, Oklahoma City, using a dynamite source.

  • 6 June until early July — various profiles were acquired at different offsets and spacings.

  • 14 July 1921 — Testing in the Arbuckle Mountains. The team of Karcher, Haseman, Ohern and Perrine determined the velocities of the Hunton limestone, Sylvan shale, and Viola limestone.

  • Early August 1921 — The group moves to Vines Branch where “the world’s first reflection seismograph geologic section was measured”, according to a commemorative plaque on I-35 in Oklahoma. That plaque claims it was 9 August, but there are also records from 5 August. The depth to the Viola limestone is recorded and observed to change with geological structure.

  • 1 September 1921 — Karcher, Haseman, and Rex Ryan (a geologist) conduct experiments at the Newkirk Anticline near Ponca City.

  • 13 September 1921 — a survey was begun for Marland Oil Company and continues into October. Success seems mixed.

So what did these physicists and geologists actually do? Here’s an explanation from Bill Dragoset in his excellent review of the history of seismic from 2005:

Using a dynamite charge as a seismic source and a special instrument called a seismograph, the team recorded seismic waves that had traveled through the subsurface of the earth. Analysis of the recorded data showed that seismic reflections from a boundary between two underground rock layers had been detected. Further analysis of the data produced an image of the subsurface—called a seismic reflection profile—that agreed with a known geologic feature. That result is widely regarded as the first proof that an accurate image of the earth’s subsurface could be made using reflected seismic waves.
— Bill Dragoset, A Historical Reflection on Reflections

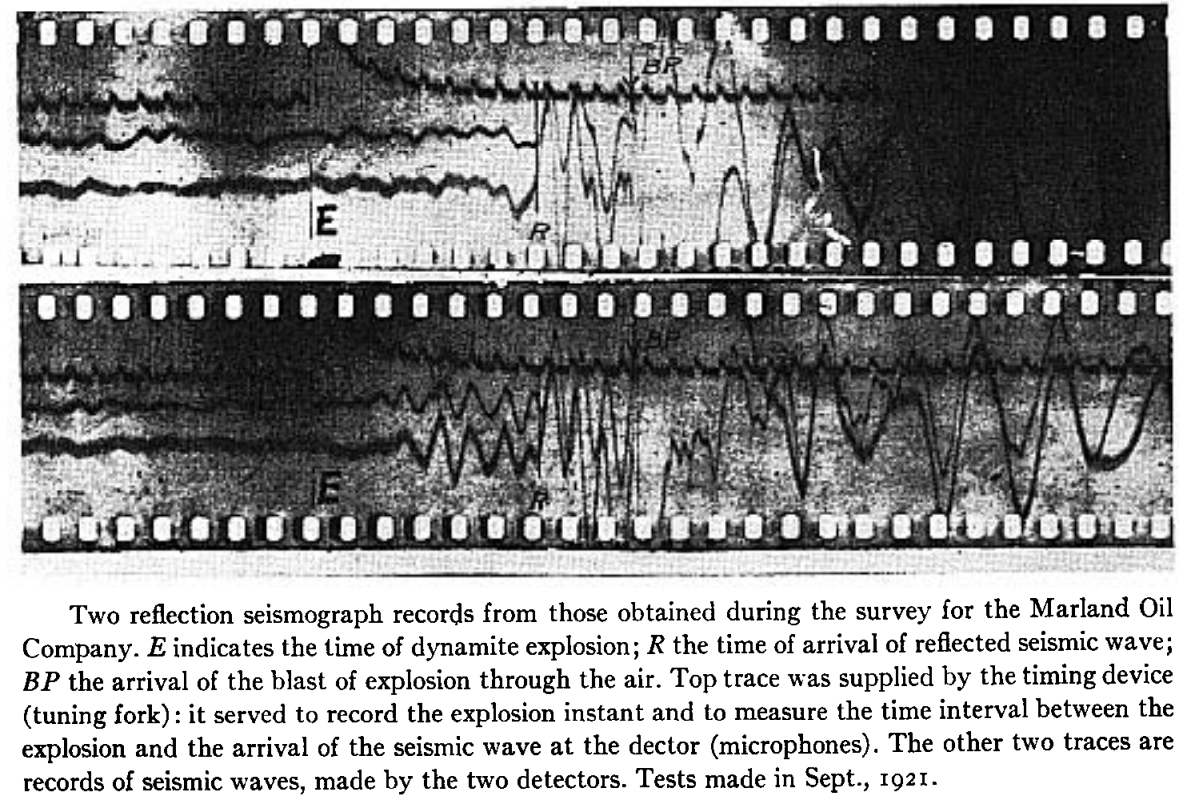
The data was a bit hard to interpret! This is from William Schriever’s paper:

Marland_seismic.png

Nonetheless, here’s the section the team managed to draw at Vine Creek. This is the world’s first reflection seismograph section — 9 August 1921:

The method took a few years to catch on — and at least a few years to be credited with a discovery. Karcher founded Geophysical Research Corporation (now Sercel) in 1925, then left and founded Geophysical Service International — which later spun out Texas Instruments — in 1930. And, eventually, seismic reflection turned into an idsutry worth tens of billions of dollars per year. Sometimes.

References

Bill Dragoset, (2005), A historical reflection on reflections, The Leading Edge 24: s46-s70. https://doi.org/10.1190/1.2112392

Clarence Karcher (1932). DETERMINATION OF .SUBSURFACE FORMATIONS. Patent no. 1843725A. Patented 2 Feb 1932.

William Schriever (1952). Reflection seismograph prospecting; how it started; contributions. Geophysics 17 (4): 936–942. doi: https://doi.org/10.1190/1.1437831

B Wells and K Wells (2013). American Oil & Gas Historical Society. American Oil & Gas Historical Society. Exploring Seismic Waves. Last Updated: August 7, 2021. Original Published Date: April 29, 2013.

More ways to make models

A few weeks ago I wrote about a new feature in bruges for making wedge models. This new feature makes it really easy to make wedge models, for example:

 
import bruges as bg import matplotlib.pyplot as plt strat = [(0, 1, 0), (2, 3, 2, 3, 2), (4, 5, 4)] wedge, *_ = bg.models.wedge(strat=strat, conformance=’top’) plt.imshow(wedge)

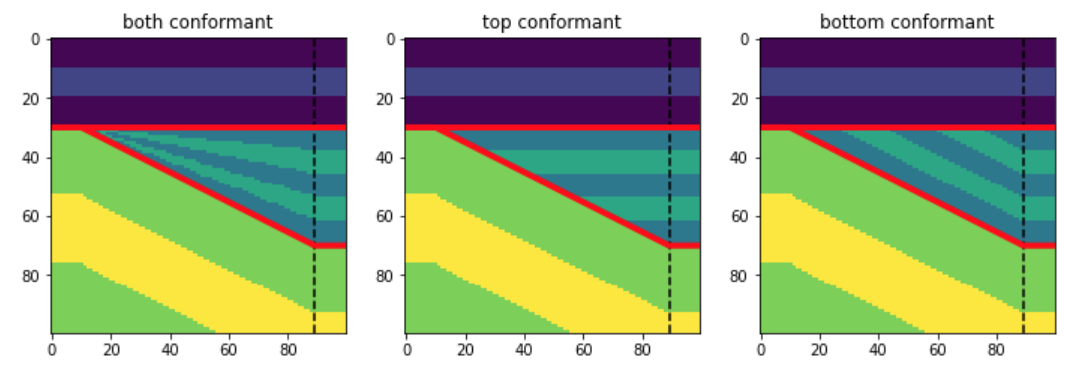
And here are some examples of what this will produce, depending on the conformance argument:

wedge_conformance.png

What’s new

I thought it might be interesting to be able to add another dimension to the wedge model — in and out of the screen in the models shown above. In that new dimension — as long as there are only two rock types in there — we could vary the “net:gross” of the wedge.

So if we have two rock types in the wedge, let’s say 2 and 3 as in the wedges shown above, we’ll end up with a lot of different wedges. At one end of the new dimension, we’ll have a wedge that is all 2. At the other end, it’ll be all 3. And in between, there’ll be a mixture of 2 and 3, with the layers interfingering in a geometrically symmetric way.

Let’s look at those 3 slices in the central model shown above:

bruges_wedge_slices.png

We can also see slices in that other dimension, to visualize the net:gross variance across the model. These slices are near the thin end of the wedge, the middle, and the thick end:

bruges_netgross_slices.png

To get 3D wedge models like this, just make a binary (2-component) wedge and add breadth=100 (the number of slices in the new dimension).

These models are admittedly a little mind-bending. Here’s what slices in all 3 orthogonal directions look like, along with (very badly) simulated seismic through this 3D wedge model:

bruges_all_the_slices.png

New wedge shapes!

As well as the net-to-gross thing, I added some new wedge shapes, so now you can have some steep-sided alternatives to the linear and sigmoidal ramps I had in there originally. In fact, you can pass in a wedge shape function of your own, so there’s no end to what you could implement.

bruges_new_wedge_shapes.png

You can read about these new features in this notebook. Please note that you will need the latest version of bruges to use these new features, so run pip install —upgrade bruges in your environment, then you’ll be all set. Share your models, I’d love to see what you make!

An open source wish list

After reviewing a few code-dependent scientific papers recently, I’ve been thinking about reproducibility. Is there a minimum requirement for scientific code, or should we just be grateful for any code at all?

The sky’s the limit

Click to enlarge

I’ve come to the conclusion that there are a few things that are essential if you want anyone to be able to do more than simply read your code. (If that’s all you want, just add a code listing to your supplementary material.)

The number one thing is an open licence. (I recently wrote about how to choose one). Assuming the licence is consistent with everything you have used (e.g. you haven’t used a library with the GPL, then put an Apache licence on it), then you are protected by the indeminity clauses and other people can re-use your code on your terms.

After that, good practice is to improve the quality of your code. Most of us write horrible code a lot of the time. But after bit of review, some refactoring, some input from colleagues, you will have something that is less buggy, more readable, and more reusable (even by you!).

If this was a one-off piece of code, providing figures for a paper for instance, you can stop here. But if you are going to keep developing this thing, and especially if you want others to use it to, you should keep going.

Best practice is to start using continuous integration, to help ensure that the code stays in good shape as you continue to develop it. And after that, you can make your tool more citable, maybe write a paper about it, and start developing a user/contributor community. The sky’s the limit — and now you have help!

Other models

When I shared this on Twitter, Simon Waldman mentioned that he had recently co-authored a paper on this topic. Harrison et al (2021) proposed that there are three priorities for scientific software: to be correct, to be reusable, and to be documented. From there, they developed a hierachy of research software projects:

  • Level 0 — Barely repeatable: the code is clear and tested in a basic way.

  • Level 1 — Publication: code is tested, readable, available and ideally openly licensed.

  • Level 2 — Tool: code is installable and managed by continuous integration.

  • Level 3 — Infrastructure: code is reviewed, semantically versioned, archived, and sustainable.

There are probably still other models out there.— if you know if a good one, please drop it in the Comments.

References

Sam Harrison, Abhishek Dasgupta, Simon Waldman, Alex Henderson & Christopher Lovell (2021, May 14). How reproducible should research software be? Zenodo. DOI: 10.5281/zenodo.4761867

Equinor should change its open data licence

This is an open letter to Equinor to appeal for a change to the licence used on Volve, Northern Lights, and other datasets. If you wish to co-sign, please add a supportive comment below. (Or if you disagree, please speak up too!)


Open data has had huge impact on science and society. Whether the driving purpose is innovation, transparency, engagement, or something else, open data can make a difference. Underpinning the dataset itself is its licence, which grants permission to others to re-use and distribute open data. Open data licences are licences that meet the Open Definition.

In 2018, Equinor generously released a very large dataset from the decommissioned field Volve. Initially it was released with no licence. Later in 2018, a licence was added but it was a non-open licence, CC BY-NC-SA (open licences cannot be limited to non-commercial use, which is what the NC stands for). Then, in 2020, the licence was changed to a modified CC BY licence, which you can read here.

As far as I know, Volve and other projects still carry this licence. I’ll refer to this licence as “the Equinor licence”. I assume it applies to the collection of data, and to the contents of the collection (where applicable).

There are 3 problems with the licence as it stands:

  1. The licence is not open.

  2. Modified CC licences have issues.

  3. The licence is not clear and exposes licencees to risk of infringement.

Let's look at these in turn.

The licence is not open

The Equinor licence is not an open licence. It does not meet the Open Definition, section 2.1.2 of which states:

The license must allow redistribution of the licensed work, including sale, whether on its own or as part of a collection made from works from different sources.

The licence does not allow sale and therefore does not meet this criterion. Non-open licences are not compatible with open licences, therefore these datasets cannot be remixed and re-used with open content. This greatly limits the usefulness of the dataset.

Modified CC licences have issues

The Equinor licence states:

This license is based on CC BY 4.0 license 

I interpret this to mean that it is intended to act as a modified CC BY licence. There are two issues with this:

  1. The copyright lawyers at Creative Commons strongly advises against modifying (in particular, adding restrictions to) their licences.

  2. If you do modify one, you may not refer to it as a CC BY licence or use Creative Commons trademarks; doing so violates their trademarks.

Both of these issues are outlined in the Creative Commons Wiki. According to that document, these issues arise because modified licences confuse the public. In my opinion (and I am not a lawyer, etc), the Equinor licence is confusing, and it appears to violate the Creative Commons organization's trademark policy.

Note that 'modify' really means 'add restrictions to' here. It is easier to legally and clearly remove restrictions from CC licences, using the CCPlus licence extension pattern

The licence is not clear

The Equinor licence contains five restrictions:

  1. You may not sell the Licensed Material.

  2. You must give Equinor and the Volve license partners credit, and provide a link to these terms and conditions, as well as a copyright notice if applicable.

  3. You may not share Adapted Material under a license that prevents recipients from complying with these terms and conditions.

  4. You shall not use the Licensed Material in a manner that appears misleading nor present the Licensed Material in a distorted or incorrect manner. 

  5. The license covers all data in the dataset whether or not it is by law covered by copyright.

Looking at the points in turn:

Point 1 is, I believe, the main issue for Equinor. For some reason, this is paramount for them.

Point 2 seems like a restatement of the BY restriction that is the main feature of the CC-BY licence and is extensively described in Section 3.a of that licence

Point 3 is already covered by CC BY in Section 3.a.4.

Point 4 is ambiguous and confusing. Who is the arbiter of this potentially subjective criterion? How will it be applied? Will Equinor examine every use of the data? The scenario this point is trying to prevent seems already to be covered by standard professional ethics and 'errors and omissions'. It's a bit like saying you can't use the data to commit a crime — it doesn't need saying because commiting crimes is already illegal. 

Point 5 is strange. I don’t know why Equinor wants to licence material that no-one owns, but licences are legal contracts, and you can bind people into anything you can agree on. One note here — the rights in the database (so-called 'database rights') are separate from the rights in the contents: it is possible in many jurisdictions to claim sui generis rights in a collection of non-copyrightable elements; maybe this is what was intended? Importantly, Sui generis database rights are explicitly covered by CC BY 4.0.

Finally, I recently received an email communication from Equinor that stated the following:

[...] nothing in our present licencing inhibits the fair and widespread use of our data for educational, scientific, research and commercial purposes. You are free to download the Licensed Material for non-commercial and commercial purposes. Our only requirement is that you must add value to the data if you intend to sell them on.

The last sentence (“Our only requirement…”) states that there is only one added restriction. But, as I just pointed out, this is not what the licence document states. The Equinor licence states that one may not sell the licensed material, period. The email states that I can sell it if I add value. Then the questions are, "What does 'add value' mean?", and "Who decides?". (It seems self-evident to me that it would be very hard to sell open material if one wasn't adding value!)

My recommendations

In its current state, I would not recommend anyone to use the Volve or Northern Lights data for any purpose. I know this sounds extreme, but it’s important to appreciate the huge imbalance in the relationship between Equinor and its licensees. If Equinor's future counsel — maybe in a decade — decides that lots of people have violated this licence, what happens next could be quite unjust. Equinor can easily put a small company out of business with a lawsuit. I know that might seem unlikely today, but I urge you to read about GSI's extensive lawsuits in Canada — this is a real situation that cost many companies a lot of money. You can read about it in my blog post, Copyright and seismic data.

When it comes to licences, and legal contracts in general, I believe that less is more. Taking a standard licence and adding words to solve problems you don’t have but can imagine having — and lawyers have very good imaginations — just creates confusion.

I therefore recommend the following:

  • Adopt an unmodifed CC BY 4.0 licence for the collection as a whole.

  • Adopt an unmodifed CC BY 4.0 licence for the contents of the collection, where copyrightable.

  • Include copyright notices that clearly state the copyright owners, in all relevant places in the collection (e.g. data folders, file headers) and at least at the top level. This way, it's clear how attribution should be done.

  • Quell the fear of people selling the dataset by removing as many possible barriers to using the free version as possible, and generally continuing to be a conspicuous champion for open data.

If Equinor opts to keep a version of the current licence, I recommend at least removing any mention of CC BY, it only adds to the confusion. The Equinor licence is not a CC BY licence, and mentioning Creative Commons violates their policy. We also suggest simplifying the licence if possible, and clarifying any restrictions that remain. Use plain language, give examples, and provide a set of Frequently Asked Questions.

The best path forward for fostering a community around these wonderful datasets that Equinor has generously shared with the community, is to adopt a standard open licence as soon as possible.

How can technical societies support openness?

spe-logo-blue.png__314x181_q85_subsampling-2.png

There’s an SPE conference on openness happening this week. Around 60 people paid the $400 registration fee — does that seem like a lot for a virtual conference? — and it’s mostly what you’d expect: talks and panel discussions. But there’s 20 minutes per day for open discussion, and we must be grateful for small things! For sure, it is always good to see the technical societies pay attention to open data, open source code, and open access content.

But what really matters is action, and in my breakout room today I asked about SPE’s role in raising the community’s level of literacy around openness. Someone asked in turn what sorts of things the organization could do. I said my answer needed to be written down 😄 so here it is.

To save some breath, I’m going to use the word openness to talk about open access content, open source code, and open data. And when I say ‘open’, I mean that something meets the Open Definition. In a nutshell, this states:

“Open data and content can be freely used, modified, and shared by anyone for any purpose

Remember that ‘free’ here means many things, but not necessarily ‘free of charge’.

So that we don’t lose sight of the forest for the tree, my advice boils down to this: I would like to see all of the technical societies understand and embrace the idea that openness is an important way for them to increase their reach, improve their accessibility, become more equitable, increase engagement, and better serve their communities of practice.

No, ‘increase their revenue’ is not on that list. Yes, if they do those things, their revenue will go up. (I’ve written about the societies’ counterproductive focus on revenue before.)

Okay, enough preamble. What can the societies do to better serve their members? I can think of a few things:

  • Advocate for producers of the open content and technology that benefits everyone in the community.

  • Help member companies understand the role openness plays in innovation and help them find ways to support it.

  • Take a firm stance on expectations of reproducibility for journal articles and conference papers.

  • Provide reasonable, affordable options for authors to choose open licences for their work (and such options must not require a transfer of copyright).

  • When open access papers are published, be clear about the licence. (I could not figure out the licence on the current most read paper in SPE Journal, although it says ‘open access’.)

  • Find ways to get well-informed legal advice about openness to members (this advice is hard to find; most lawyers are not well informed about copyright law, nevermind openness).

  • Offer education on openness to members.

  • Educate editors, associate editors, and meeting convenors on openness so that they can coach authors, reviewers., and contributors.

  • Improve peer review machinery to better support the review of code and data submissions.

  • Highlight exemplary open research projects, and help project maintainers improve over time. (For example, what would it take to accelerate MRST’s move to an open language? Could SPE help create those conditions?)

  • Recognize that open data benchmarks are badly needed and help organize labour around them.

  • Stop running data science contests that depend on proprietary data.

  • Put an open licence on PetroWiki. I believe this was Apache’s intent when they funded it, hence the open licences on AAPG Wiki and SEG Wiki. (Don’t get me started on the missed opportunity of the SEG/AAPG/SPE wikis.)

  • Allow more people from more places to participate in events, with sympathetic pricing, asynchronous activities, recorded talks, etc. It is completely impossible for a great many engineers to participate in this openness workshop.

  • Organize more events around openness!

I know that SPE, like the other societies, has some way to go before they really internalize all of this. That’s normal — change takes time. But I’m afraid there is some catching up to do. The petroleum industry is well behind here, and none of this is really new — I’ve been banging on about it for a decade and I think of myself as a newcomer to the openness party. Jon Claerbout and Paul de Groot must be utterly exhausted by the whole thing!

The virtual conference this week is an encouraging step in the right direction, as are the recent SPE datathons (notwithstanding what I said about the data). Although it’s a late move — making me wonder if it’s an act of epiphany or of desperation — I’m cautiously encouraged. I hope the trend continues and picks up pace. And I’m looking forward to more debate and inspiration as the week goes on.

Projects from the Geothermal Hackathon 2021

geothermal_skull_thumb.png

The second Geothermal Hackathon happened last week. Timed to coincide with the Geosciences virtual event of the World Geothermal Congress, our 2-day event brought about 24 people together in the famous Software Underground Chateau (I’m sorry if I missed anyone!). For comparison, last year we were 13 people, so we’re going in the right direction! Next time I hope we’re as big as one of our ‘real world’ events — maybe we’ll even be able to meet up in local clusters.

Here’s a rundown of the projects at this year’s event:

Induced seismicity at Espoo, Finland

Alex Hobé, Mohsen Bazagan and Matteo Niccoli

Alex’s original workflow for creating dynamic displays of microseismic events was to create thousands of static images then stack them into a movie, so the first goal was something more interactive. On Day 1 Alex built a Plotly widget with a time zoomer/slider in a Jupyter Notebook. On day 2 he and Matteo tried Panel for a dynamic 3D plot. Alex then moved the data into LLNL Visit for fully interactive 3D plots. The team continues to hack on the idea.

geothermal_hack_2021_seismic.png

Fluid inclusions at Coso, USA

Diana Acero-Allard, Jeremy Zhao, Samuel Price, Lawrence Kwan, Jacqueline Floyd, Brendan, Gavin, Rob Leckenby and Martin Bentley

Diana had the idea of a gas analysis case study for Coso Field, USA. The team’s specific goal was to develop visualization tools for interetpaton of fluid inclusion gas data to identify fluid types, regions of permeability, and geothermal processes. They had access to analyses from 29 wells, requiring the usual data science workflow: find and load the data, clean the data, make some visualizations and maps, and finally analyse the permeability. GitHub repo here.

geothermal_hack_2021_fluid-incl.png

Utah Forge data pipeline

Andrea Balza, Evan Bianco, and Diego Castañeda

Andrea was driven to dive into the Utah FORGE project. Navigating the OpenEI data portal was a bit hit-and-miss, having to download files to get into ZIP files and so on (this is a common issue with open data repositories). The team eventually figured out how to programmatically access the files to explore things more easily — right from a Jupyter Notebook. Their code for any data on the OpenEI site, not just Utah FORGE, so it’s potentially a great research tool. GitHub repo here.

geothermal_hack_2021_forge.png

Pythonizing a power density estimation tool

Irene Wallis, Jan Niederau, Hannah Wood, Will Middlebrook, Jeff Jex, and Bill Cummings

Like a lot of cool hackathon projects, this one started with spreadsheet that Bill created to simplify the process of making power density estimates for geothermal fields under some statistical assumptions. Such a clear goal always helps focus the mind and the team put together some Python notebooks and then a Streamlit app — which you can test-drive here! From this solid foundation, the team has plenty of plans for new directions to take the tool. GitHub repo here.

geothermal_hack_2021_streamlit2.png
geothermal_hack_2021_streamlit1.png

Computing boiling point for depth

Thorsten Hörbrand, Irene Wallis, Jan Niederau and Matt Hall

Irene identified the need for a Python tool to generate boiling-point-for-depth curves, accommodating various water salinities and chemistries. As she showed during her recent TRANSFORM tutorial (which you must watch!), so-called BPD curves are an important part of geothermal well engineering. The team produced some scripts to compute various scenarios, based on corrections in the IAPWS standards and using the PHREEQC aqueous geochemistry modeling software. GitHub repo here.

geothermal_hack_2021_bpd-curves.png

A big Thank You to all of the hackers that came along to this virtual event. Not quite the same as a meatspace hackathon, admittedly, but Gather.town + Slack was definitely an improvement over Zoom + Slack. At least we have an environment in which people can arrive and immediately get a sense of what is happening in the event. When you realize that people at the tables are actually sitting in Canada, the US, the UK, Switzerland, South Africa, and Auckland — it’s clear that this could become an important new way to collaborate across large distances.

geothermal_hack_2021_chateau.png

Do check out all these awesome and open-source projects — and check out the #geothermal channel in the Software Underground to keep up with what happens next. We’ll be back in the future — perhaps the near future! — with more hackathons and more geothermal technology. Hopefully we’ll see you there! 🌋