Noise, sampling, and the Horn River Basin

Some highlights from day 1 of GeoCon11, the CSPG CSEG CWLS annual convention in Calgary.

Malcolm Lansley of Sercel, with Peter Maxwell of CGGVeritas, presented a fascinating story of a seismic receiver test in a Maginot Line bunker in the Swiss Alps. The goal was to find one of the quietest places on earth to measure the sensitivity to noise at very low frequencies. The result: if signal is poor then analog geophones outperform MEMS accelerometers in the low frequency band, but MEMS are better in high signal:noise situations (for example, if geological contrasts are strong).
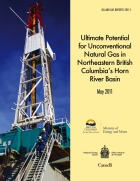
Click for the reportWarren Walsh and his co-authors presented their work mapping gas in place for the entire Horn River Basin of northeast British Columbia, Canada. They used a stochastic approach to simulate both free gas (held in the pore space) and adsorbed gas (bound to clays and organic matter). The mean volume: 78 Tcf, approximately the same size as the Hugoton Natural Gas Area in Kansas, Texas, and Oklahoma. Their report (right) is online

RECON Petrotechnologies showed results from an interesting physical experiment to establish the importance of well-log sample rate in characterizing thin beds. They constructed a sandwich of gyprock, between slices of aluminium and magnesium, then pulled a logging tool through a hole in the middle of the sandwich. An accurate density measurement in a 42-cm thick slice of gyprock needed 66 samples per metre, much higher than the traditional 7 samples per metre, and double the so-called 'high resolution' rate of 33 samples per metre. Read their abstract

Carl Reine at Nexen presented Weighing in on seismic scale, exploring the power law relationship of fracture lengths in Horn River shales. He showed that the fracture system has no characteristic scale, and fractures are present at all lengths. Carl used two independent seismic techniques for statistically characterizing fracture lengths and azimuths, which he called direct and indirect. Direct fault picking was aided by coherency (a seismic attribute) and spectral decomposition; indirect fault picking used 3D computations of positive and negative curvature. Integrating these interpretations with borehole and microseismic data allowed him to completely characterize fractures in a reservoir model. (See our post about crossing scales in interpretation.)

Evan and Matt are tweeting from the event, along with some other attendees; follow the #geocon11 hashtag to get the latest.


Seeing red

Temperature is not often a rock property given a lot of attention by geoscientists. Except in oil sands. Bitumen is a heavily biodegraded oil greater than 10 000 cP and less than 10˚API. It is a viscoelastic solid at room temperature, and flows only when sufficiently heated. Operators inject steam (through a process called SAGD), as opposed to hot water, because steam carrys a large portion of its energy as latent heat. When steam condenses against the chamber walls, it transfers heat into the surrounding reservoir. This is akin to the pain you'd feel when you place your hand over a pot of rolling water.

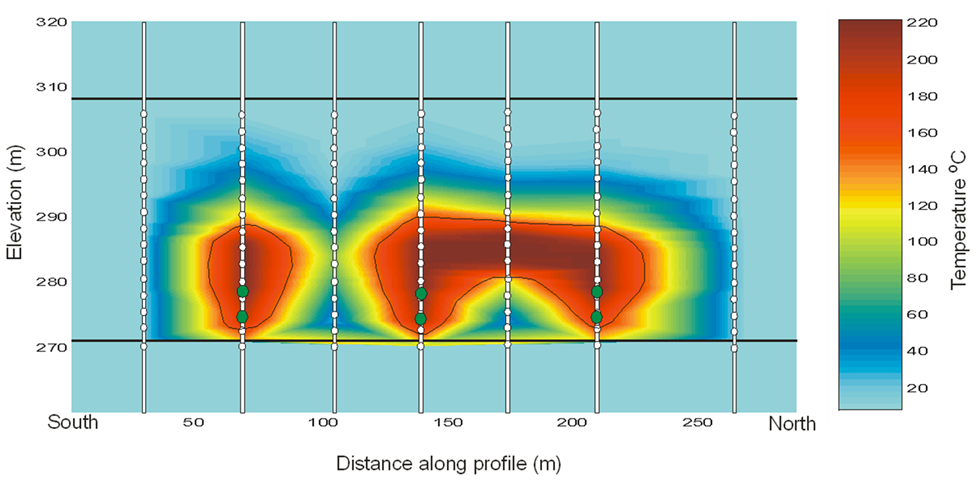
This image is a heat map across 3 well pairs (green dots) at the Underground Test Facility (UTF) in the Early Cretaceous McMurray Formation in the Athabasca oil sands of Alberta. This data is from downhole thermocouple measurements, shown in white dots, the map was made by doing a linear 2D interpolation.

Rather than geek out on the physics and processes taking place, I'd rather talk about why I think this is a nifty graphic.

What I like about this figure

Colour is intiutive – Blue for cold, red for hot, it doesn't get much more intuitive than that. A single black contour line delineates the zone of stable steam and a peripheral zone being heated.  

Unadulterated interpolation – There are many ways of interpolating or filling-in where there is no data. In this set, the precision of each measurement is high, within a degree or two, but the earth is sampled irregularly. There is much higher sampling in the vertical direction than the x,y direction, and this presents, somewhat unsightly, as horizontal edges on the interpolated colours. To smooth the interpolation, or round its slightly jagged edges would, in my opinion, degrade the information contained in the graphic. It's a display of the sparseness of the measurements. 

Sampling is shown – You see exactly how many points make up the data set. Fifteen thermocouples in each of 7 observation wells. It makes the irregularities in the contours okay, meaningful even. I wouldn’t want to smooth it. I think map makers and technical specialists too readily forget about where their data comes from. Recognize the difference between hard data and interpolation, and recognize the difference between observation and interpretation.

Sampling is scale – Imagine what this image would look like if we took the first, third, fifth, and seventh observation well away. Our observations and thus physical interpretation would be dramatically different. Every data point is accurate, but resolution depends on sample density.

Layers of context – Visualizing data enables heightened interpretation. Interpreting the heated zone is a simply a temperature contour (isotherm). Even though this is just a heat map, you can infer that one steam chamber is isolated, and two have joined into one another. Surely, more can be understood by adding more context, by integrating other subsurface observations.

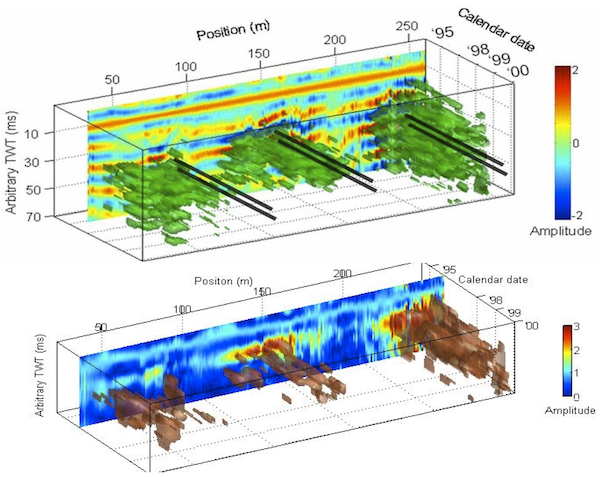
In commercial scale oil sands operations, it is rare to place observation wells so close to each other. But if we did, and recorded the temperature continuously, would we even need time lapse seismic at all? (see right) 

If you are making a map or plot of any kind, I encourage you to display the source data. Both its location and its value. It compels the viewer to ask questions like, Can we make fewer measurements in the next round? Do we need more? Can we drill fewer observation wells and still infer the same resolution? Will this cost reduction change how we monitor the depletion process?

Our next experiment: AgileWiki

We're excited to announce AgileWiki, a publicly editable encyclopedia of the subsurface, especially for the energy industry. You are unlikely to find how-to's on seismic interpretation in Wikipedia, or tutorials on basic concepts in Schlumberger's glossary, but this is exactly the sort of thing you'll find in AgileWiki.

If you're thinking: 'Great, but the last thing I need is another wiki...' then, fair enough, we sympathize. But here's why we think AgileWiki should have a role in your professional life:

  • It's only about the subsurface of the earth
  • It's only about the science and industry of energy
  • It's licensed CC-BY, which means you can re-purpose its content however you like, with due credit

We don't want to give the impression that AgileWiki is finished, or even very useful yet — it's very much early days and it has a long way to go. This is the Agile way: release early and update often. We think doing things like this in public is the best way to ensure it is relevant and useful. Evan and I are using the wiki already, so it is already growing organically.

A wiki is really just a website that anyone can edit (after you create an account; I have disabled anonymous edits). Please don't feel like you have to use it just as an encyclopedia. Here are some other ways to use AgileWiki:

  • As a way to share notes: next time you want to share something of general interest and email doesn't quite suit, feel free to document it in the wiki and simply send a URL.
  • As a personal and open notebook: You can store anything you want on your User page, which is automatically created when you create your account. 
  • As a source for non-proprietary content for an in-house or corporate wiki. Feel free to push generic content of your own back to us!

If you're not ready to jump into editing just yet but you'd like to see how this experiment can help you, why not try requesting an article? We're not promising to deliver overnight, but we want to help create content you want. So make a wish-list and let us know about it, on the wiki or in the comments below.

Last thing: please consider the ownership and possible confidentiality of whatever you want to share. By putting your material in the wiki, you agree to share it with others under the terms of its license.