Where on Google Earth #252

Felix Bossert stumped us with one of the most unusual geomorphologies on the planet with WoGE #251 last week. The  sub-parallel elongate low-sinuosity (OK, wormy) features, reminiscent of a fingerprint, turned out to be the acidic dregs of a salt lake in Western Australia. 

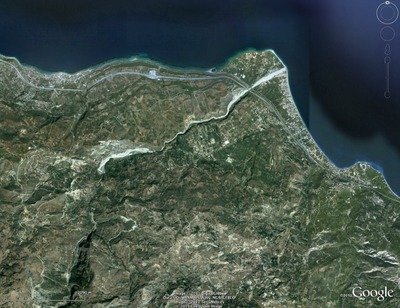
Where on Google Earth, the brilliant brainchild of clasticdetritus, is the best use of satellite imagery since looking at homes and gardens of the rich and famous. If you are new to the game, it is easy to play. The winner is the first person to examine the picture below, find the location (name, link, or lat-long), and give a brief explanation of its geological interest. Please post your answer in the comments. Thanks to the Schott Rule, which I hereby invoke, newbies have a slight edge: previous winners must wait one hour for each previous win before playing.

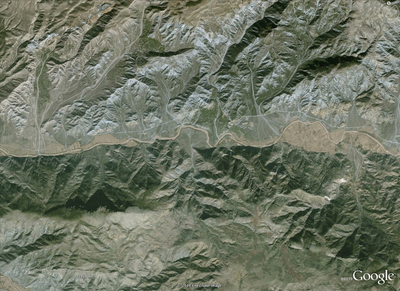
Where and what on Google's blue earth is this?

Basic cheatsheet

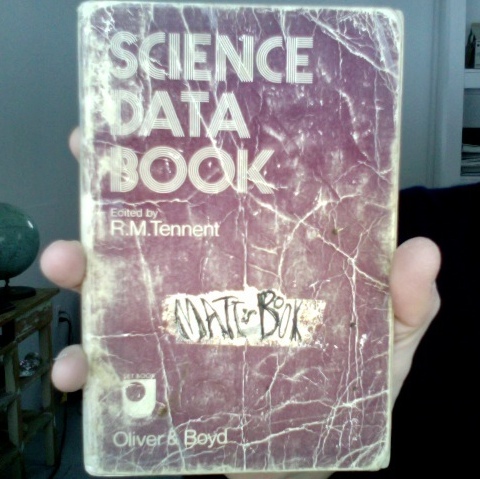
When I was a spotty schoolboy my favourite book was the Science Data Book. This amazing little book, which fit in my jacket pocket (we wore suits to school), went everywhere with me. Everywhere at school, I mean, I'm not that much of a nerd.

It contains some really handy stuff: the Greek alphabet, SI unit definitions, the periodic table, the fundamental constants, handy formulae like the Maclaurin series, (remember that?), and even a very nice table of isotopes (did you know that the half-life of vanadium-50 is 400 trillion years?).

Amazingly, there are some used copies of that little book on Amazon

You might think that in these days of smartphones and WiFi everywhere there's no need for such things. But have you never sat in a meeting or lecture and just couldn't remember how many acres in a hectare (2.47), or when the Silurian was (417 Ma BP)? Usually it's too much hassle to pull out my phone, then find Wikipedia and the one piece of data I need. Especially when tapping away on a cell phone looks like you're texting someone 'So bored, please get me out of this meeting, call me in 5 mins?'.

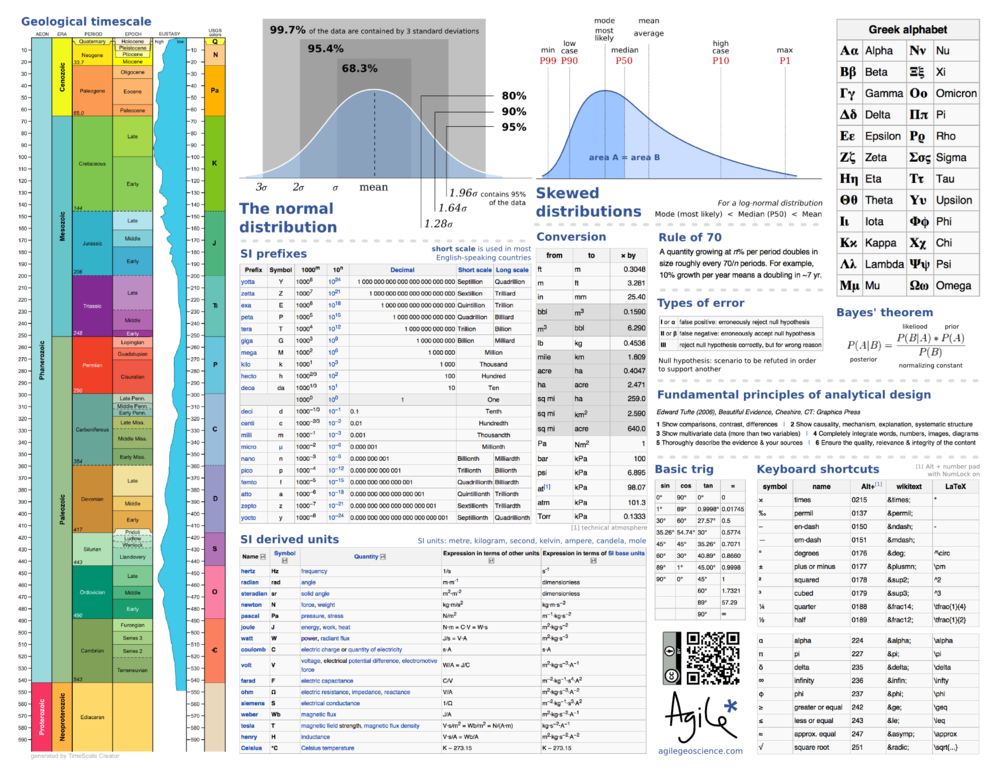
So, I give you the first in a series of cheatsheets. This one has mostly basic stuff on it; future editions will have more geoscience-related content. Print it out and stick in your notebook, or maybe on your wall, right next to Signs & Symbols.

If you use it, please let me know what you like or dislike, so I can improve it. Have I missed anything you're always looking up?

← Click on the image for the PDF

Tell more about me

I thought a neat way to highlight my experience and career interests would be to make up a word cloud from the text in my resume. It's a map of the significant words describing my professional life. Try it out on yourself, and who knows, you might learn to look at yourself in a whole new way :)

When I look at this map, I wish a few words were bigger: business, value-adding, variety. However, I think they are growing!  Developed, is past tense.  I wish to continue to develop and innovate more and technologies and resources.  Problem-Solving; I feel like that is under-represented. Seismic and scholarship seem to be disporportionately large, but I guess I will have to grow other words to catch up with them. This word cloud has omitted places where I have done geoscience; Offshore Australia, Central Alberta, Athabasca Oil Sands, Finland, North SeaAtlantic Canada.  Words missing altogether; enthusiastic, creative, resourceful, a little geeky?

In Our Time

When I lived in Calgary I walked 25 minutes to and from work every day. Melvyn Bragg's weekly BBC radio programme was always one of my favourite things to listen to on the way. Every show has the same format: an informal forty-minute discussion with three academics. But the quintessence of In Our Time is its diversity of topics: Avicenna to Yeats to the Aeneid to Zoroastrianism.

Over the years, Bragg and his guests have covered lots of geological subjects. The wonderful BBC keeps the archive completely open, so you can listen to any show any time. Here are the most geoscientiferous ones I can find in the archive:


Here are some others, less directly related to geoscience:


Tomorrow's programme is on random and pseudo-randomness. Can't wait!

Rock physics and steam

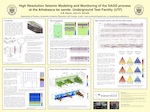
Over the last few weeks, I have been revisiting and reminiscing over some past work, and found this poster I made for the 2007 SEG Development & Production Forum on the geophysics of heavy oil. A few months ago, the organizers of the workshop made a book out of many great articles that followed. Posters, however, often get printed only once, but that doesn't mean they need only be viewed once.

The poster illustrates the majority of my MSc thesis on the rock physics of steam injection in Canadian oil sands. You might be interested in this if you are interested in small scale seismic monitoring experiments, volume visualization, and novel seismic attributes for SAGD projects. For all you geocomputing enthusiasts, you'll recognize that all the figures were made with MathWorks MATLAB (something I hope to blog about later). It was a fun project, because it merged disparate data types, rock physics, finite-difference modeling, time-lapse seismic, and production engineering. There are a ton of subsurface problems that still need to be solved in oil sands, many opportunities to work across disciplines, and challenge the limits of our geoscience creativity. 

Here's the full reference: Bianco, E & D Schmitt (2007). High resolution modeling and monitoring of the SAGD process at the Athabasca tar sands: Underground Test Facility (UTF), 2007 SEG D&P Forum, Edmonton, Canada. If you prefer, you can grab these slides which I gave as an oral presentation on the same material, or flip to chapter 6 in the book.

Where on Google Earth #249

Elisabeth Kosters, who correctly identified the Bay of Fundy in WoGE #248, asked me to host her challenge for the next instalment. So here we are again. Welcome to WoGE #249.

Where on Google Earth is the best use of a high-speed internet connection since e-journals. If you are new to the game, it is easy to play. The winner is the first person to examine the picture below, find the location (name, link, or lat-long), and give a brief explanation of its geological interest. Please post your answer in the comments below. And thanks to the Schott Rule, which Elisabeth is invoking, newbies have a slight edge: previous winners must wait one hour for each previous win before playing.

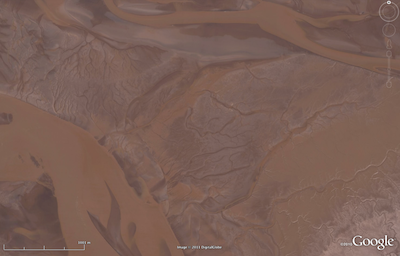
So: where and what on Google earth is this?

Create better time scales

If you ever find yourself drawing geological time scales in Microsoft PowerPoint (embarrassingly enough, this has happened to me), or trying to build a hackish database of geological events in Microsoft Excel, then you need TimeScale Creator. This free, Java-based application runs on any platform (because it's Java), and is fully extensible with your own stratigraphic data. You can also buy a Pro version ($500 for non-commerical use, or $1500 for commercial purposes). The upgrade gets you various stratigraphic data packs and other perks like better export functionality. 

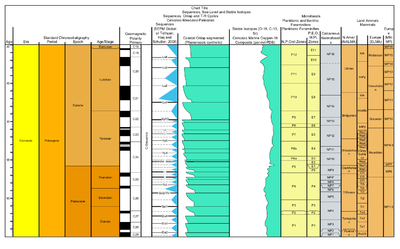
To give you a flavour of what this little app can do, I made a quick column for part of the Palaeogene. I picked the interval more or less at random, and haven't changed any of the defaults except the columns to display, but this took me about 60 seconds to make. The data I'm showing here are all included in the free version, and all ratified by the International Commission on Stratigraphy. And I can export it as an SVG file (scalable vector graphics), which I can edit freely in Inkscape or any of several other vector graphics editors. applications. Here it is:

You can download the software by following this link. If you have any tips for using the software, or other ways to make timescales, please leave them in the comments!

Note, TimeScale Creator is a trademark of the Geologic TimeScale Foundation. I am not connected with the software or its creators in any way. Microsoft PowerPoint and Excel are trademarks of Microsoft Corporation. Java is a trademark of Oracle Corporation.

Where on Google Earth #248

Where on Google Earth is the best use of a coffee break since reading geoblogs. Despite not knowing much about the last one (no-one really knows how mima mounds form, even at Mima Mounds Natural Area, in Washington, USA), I happened to know where it was. So it is my honour, nay duty, to present WoGE #248. 

If you are new to the game, it is easy to play. The winner is the first person to examine the picture below, find the location (name, link, or lat-long), and give a brief explanation of its geological interest. Please post your answer in the comments below. And thanks to the Schott Rule, which I am invoking, newbies have a slight edge: previous winners must wait one hour for each previous win before playing. This seems punitive, given how quickly some WoGE's have been solved recently, but there it is. 

So crack open your favourite virtual globe, and good luck!

The integration gap

Agile teams have lots of ways to be integrated. They need to be socially integrated: they need to talk to each other, know what team-mates are working on, and have lots of connections to other agile teams and individuals. They need to be actively integrated: their workflows must complement one another's. If the geologist is working on new bulk density curves, the geophysicist uses those curves for the synthetic seismograms; if the geophysicist tweaks the seismic inversion result, the geomodeller uses that volume for the porosity distribution.

But the agile team also needs to be empirically integrated: the various datasets need to overlap somehow so they can be mutually calibrated and correlated. But if we think about the resolution of subsurface data, both spatially, in the (x,y) plane, and vertically, on the z axis, we reveal a problem—the integration gap.

Scales_of_measurement.png

This picks up again on scale (see previous post). Geophysical data is relatively low-resolution: we can learn all about large, thick features. But we know nothing about small things, about a metre in size, say. Conversely, well-based data can tell us lots about small things, even very small things indeed. A vertical well can tell us about thick things, but not spatially extensive things. A horizontal well can tell us a bit more about spatially large things, but not about thick things. And in between this small-scale well data and the large-scale seismic data? A gap. 

This little gap is responsible for much of the uncertainty we encounter in the subsurface. It is where the all-important well-tie lives. It leads to silos, un-integrated behaviour, and dysfunctional teams. And it's where all the fun is!

† I've never thought about it before, but there doesn't seem to be an adjectival form of the word 'data'. 


UPDATE This figure was updated later:

Scales_of_measurement_complete.png

Will this change anything?

Stubborn as it is, I often neglect to check the weather forecast before I go out in the morning. I live within walking distance to most things, and I can bear extreme cold for a few minutes (and even run if I have to). So for me, searching for a weather forecast the night before or the first thing won't actually change my morning routine. And that is to say nothing of the reliability of the forecasts!

Every one of us can pick and choose how much information to use in our daily lives. On one end of the spectrum is no information, where uncertainty and ambiguity reigns. On the other end is total information, which can be unwieldy and noisy. One way to hone in the appropriate balance is to ask the question, "will this change anything?"

When deciding whether to run a fancy diagnostic borehole tool, say, or to redo a structure map to include new well data, the wrong thing to ask is "what will this information do for me?", or even, "will this technology or method work?" Instead, we should be asking, "will this change anything?" 

Will adding (or excluding) this ingredient change the taste or outcome of my meal?

If the drilling engineer on your team is on the ball, cost conscious, and able to drill at 40 metres per hour, then LWD (logging-while-drilling) information may not actually allow you to steer the well on the fly. It's nice data to have after the fact, but it won't change how you drill the well. If your team's strategy is to drill relative time structural highs, then re-doing a velocity model for more accurate depth maps may be a waste of time. 

When we talk about how information might change our plans, or change our understanding, we are talking about it's value.  Asking, "will this change anything?" is really trying to pin down, "how much do I value this information?" The weather channel might be more valuable to you than it is to me, but how valuable is it? Will it change anything if you have to get on without it?