The Scottish hackathon
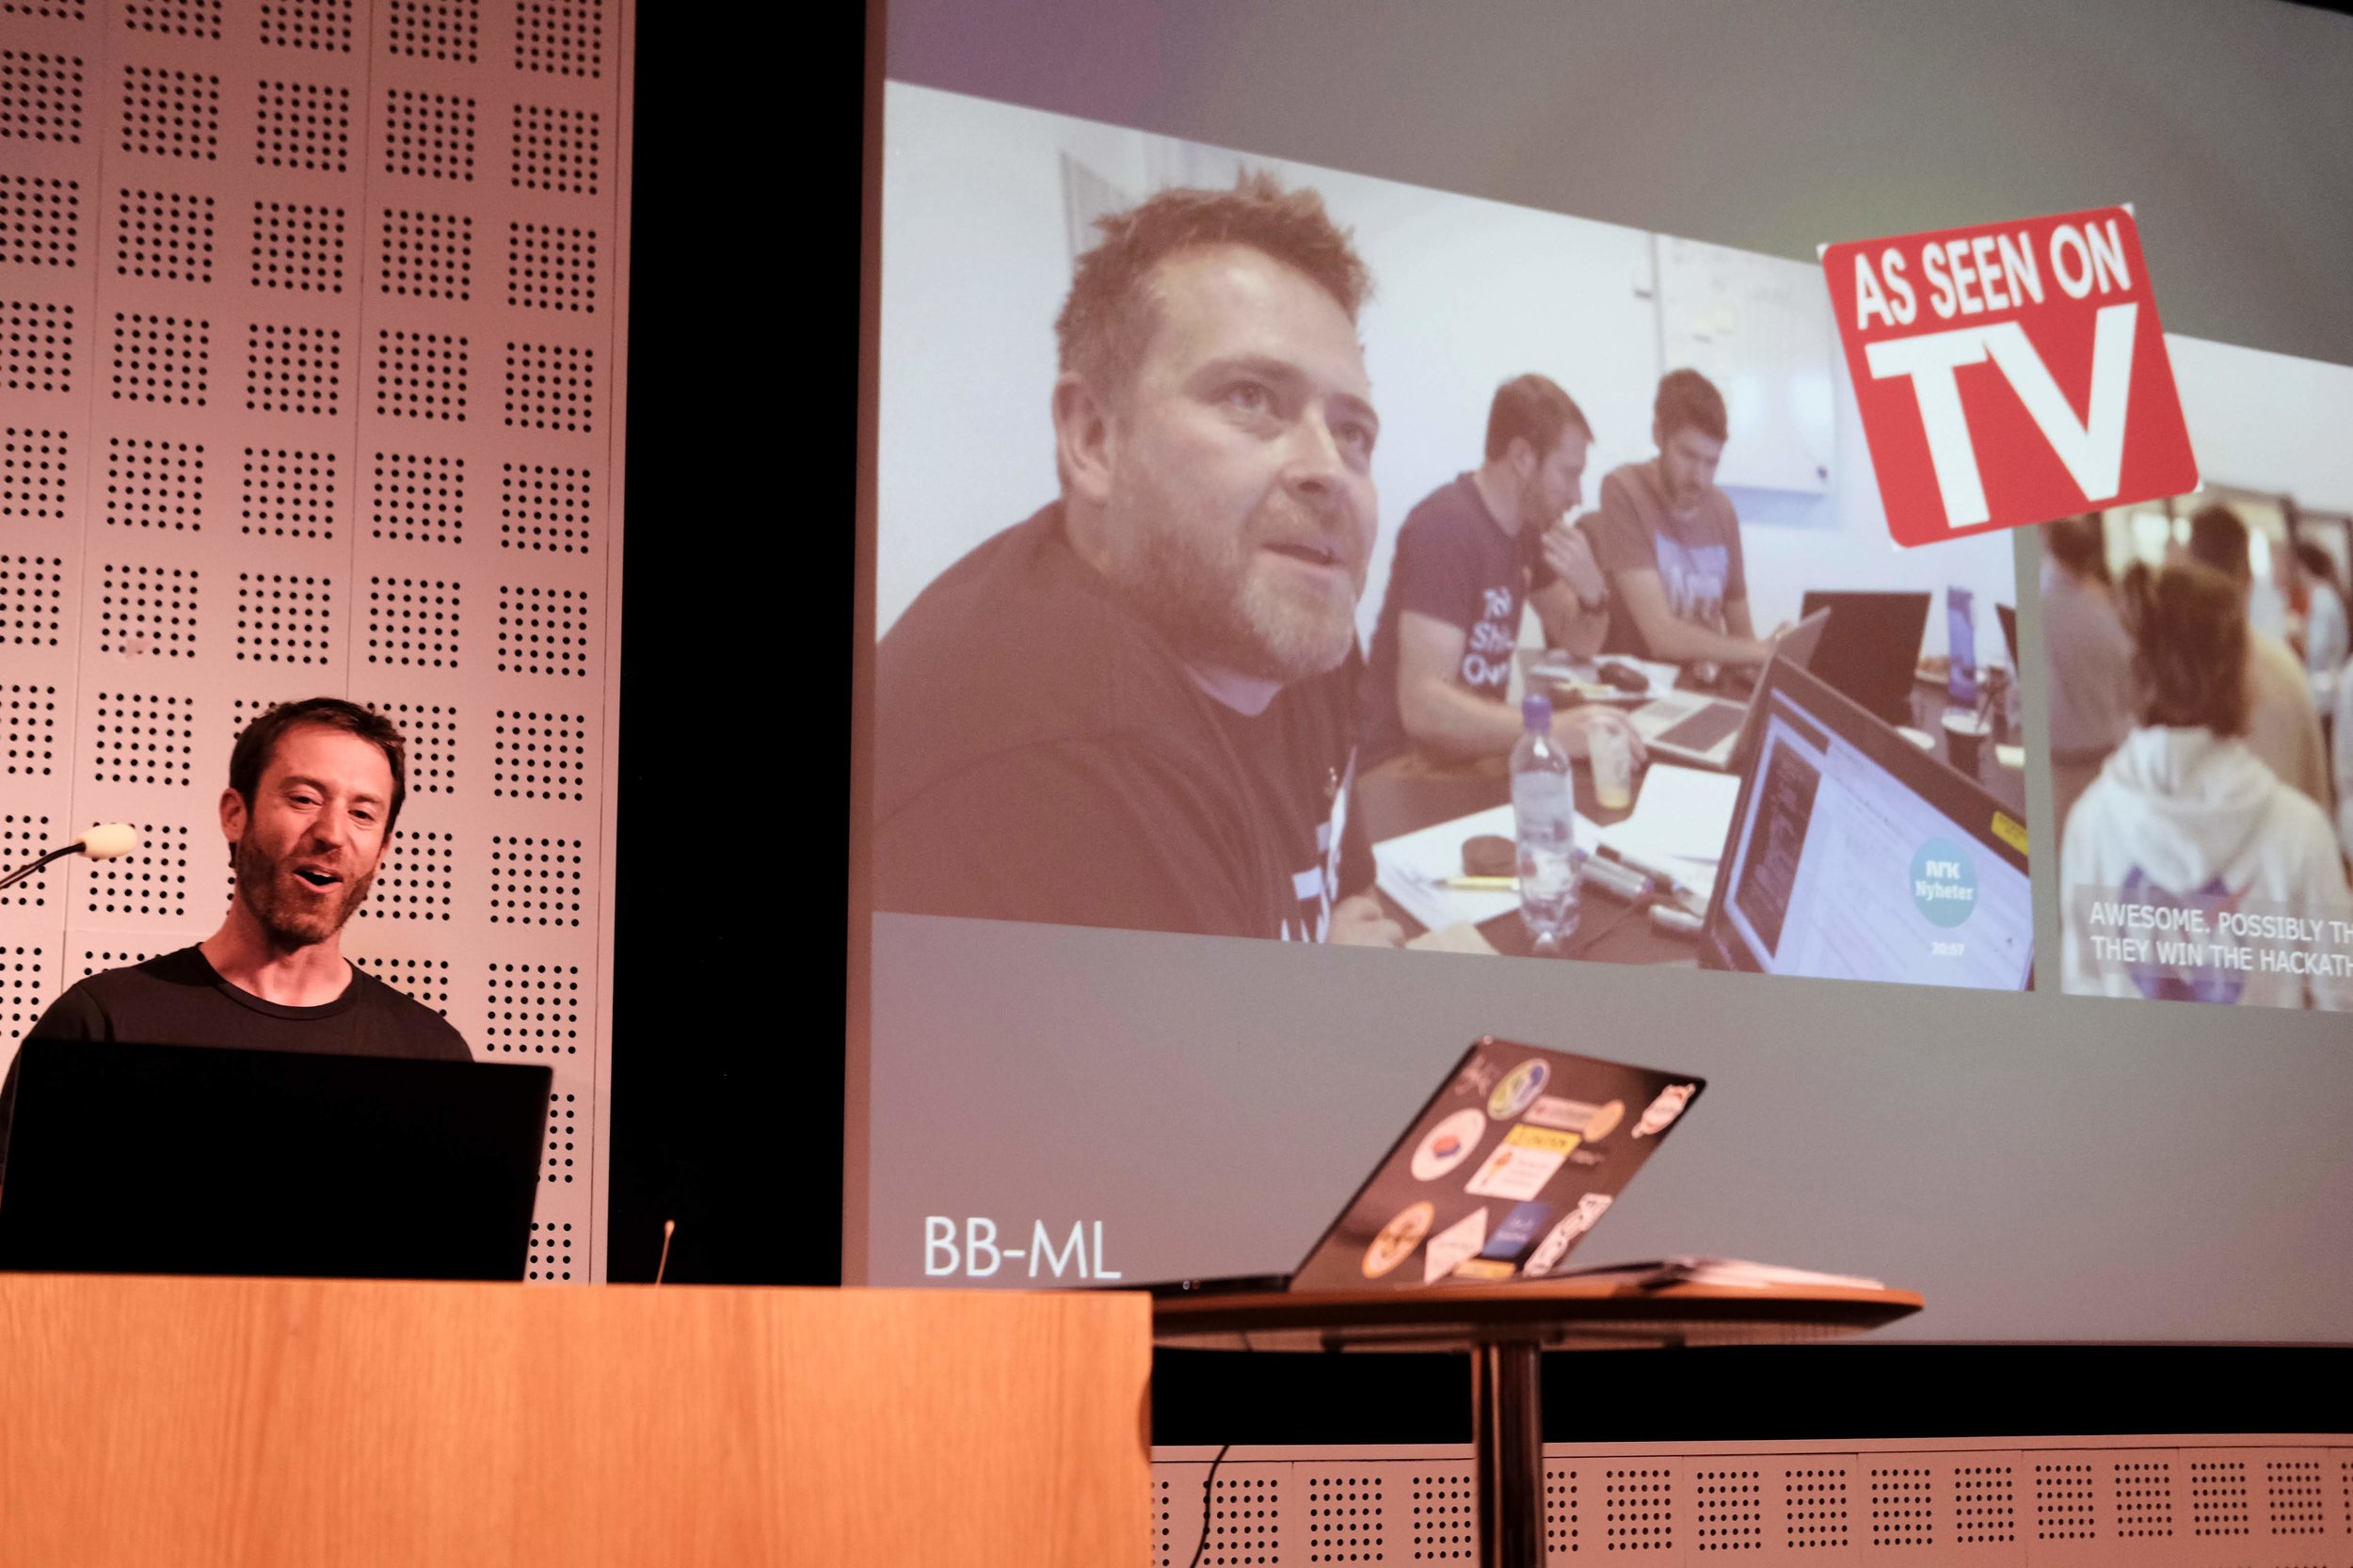
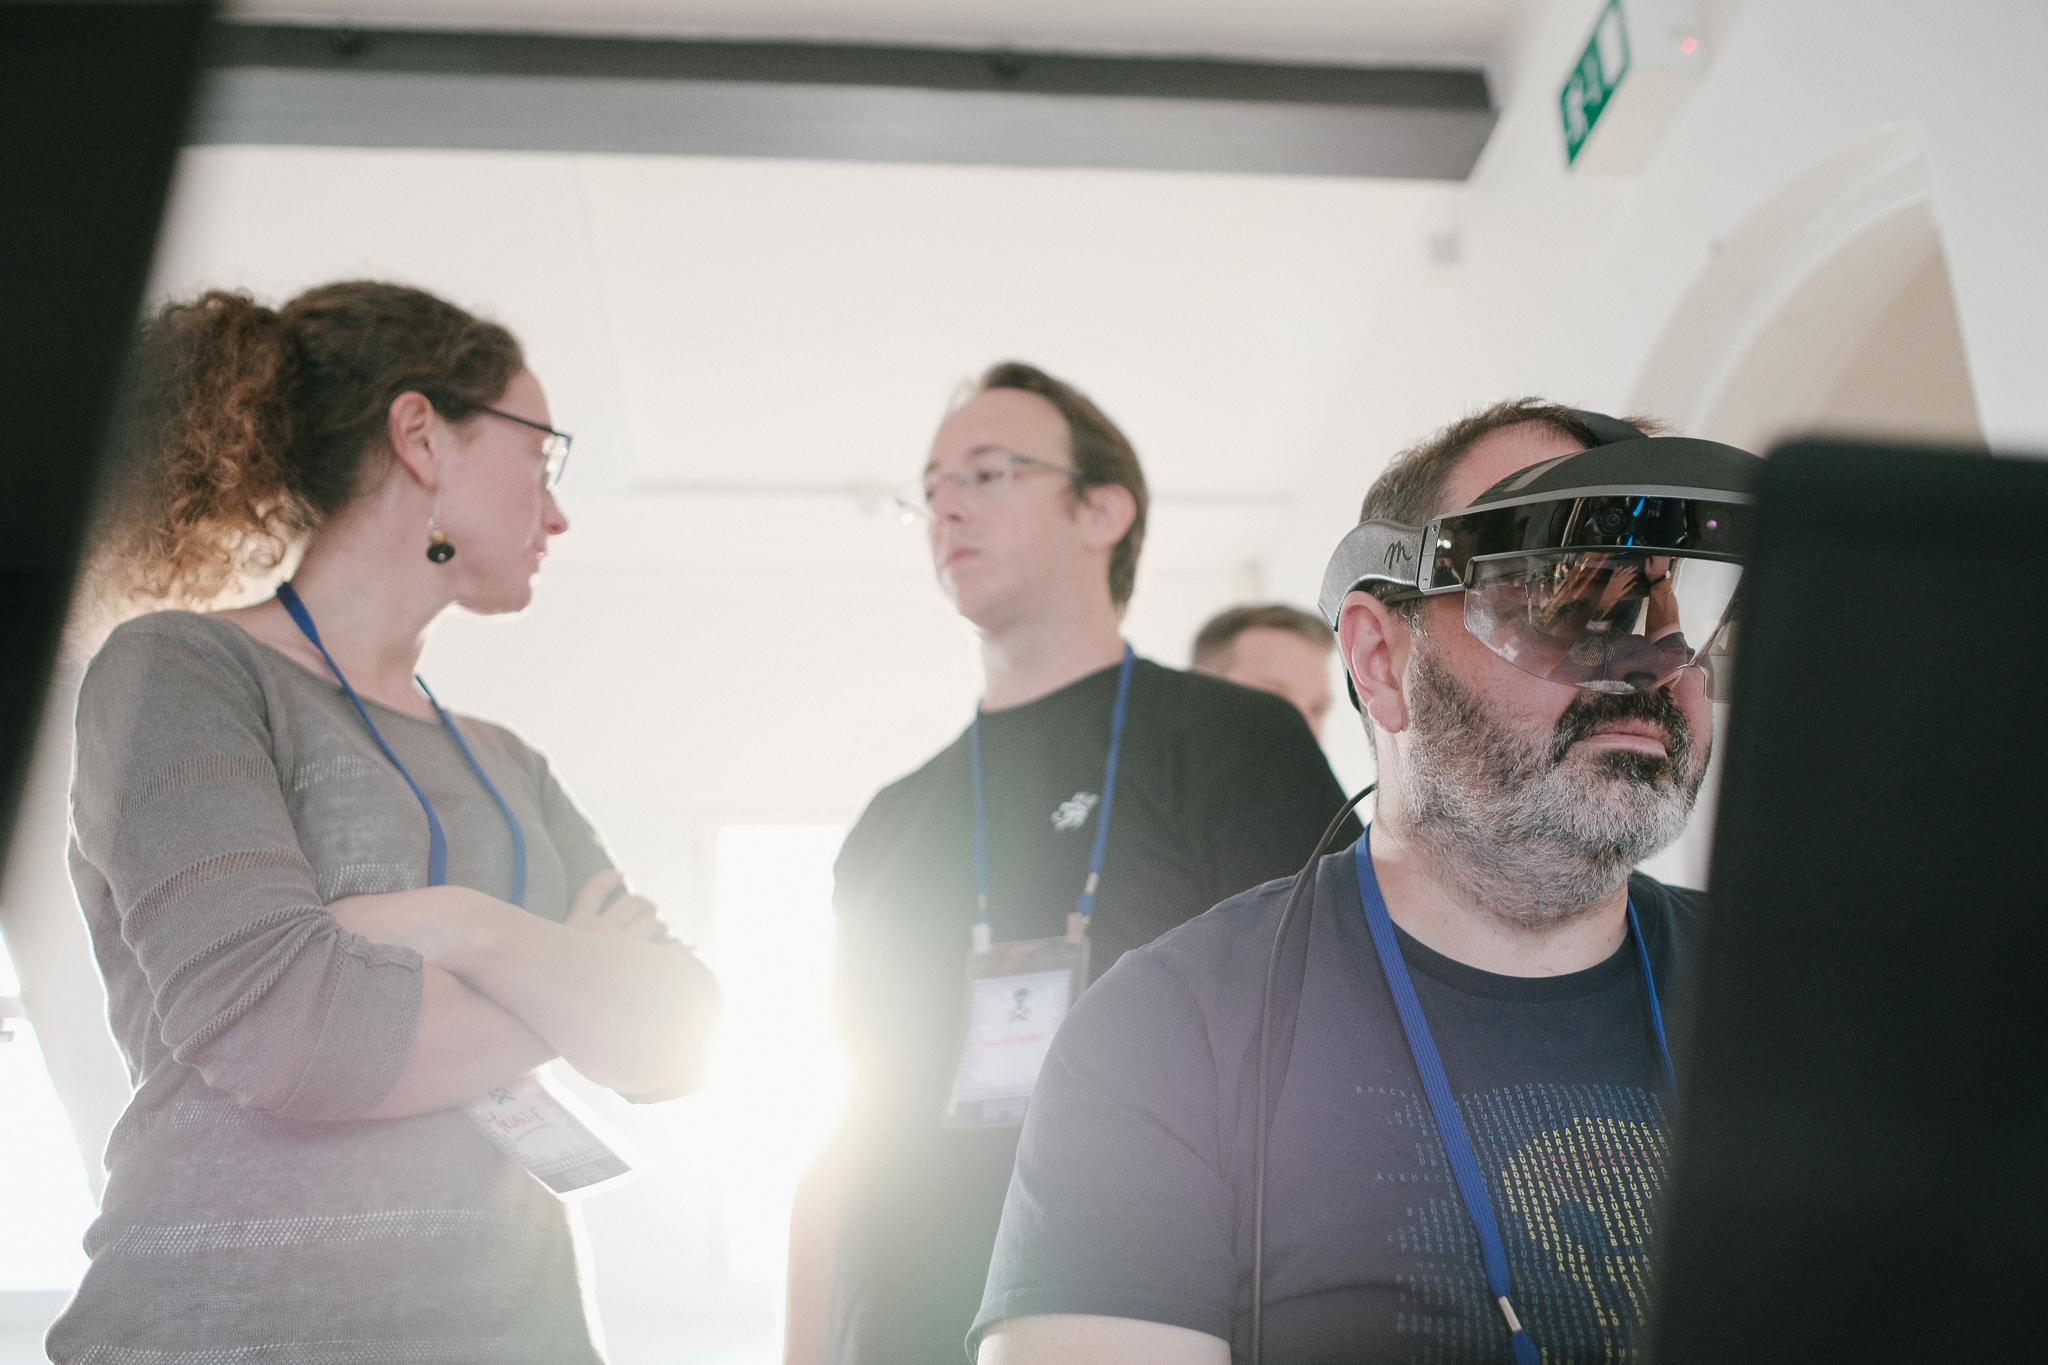
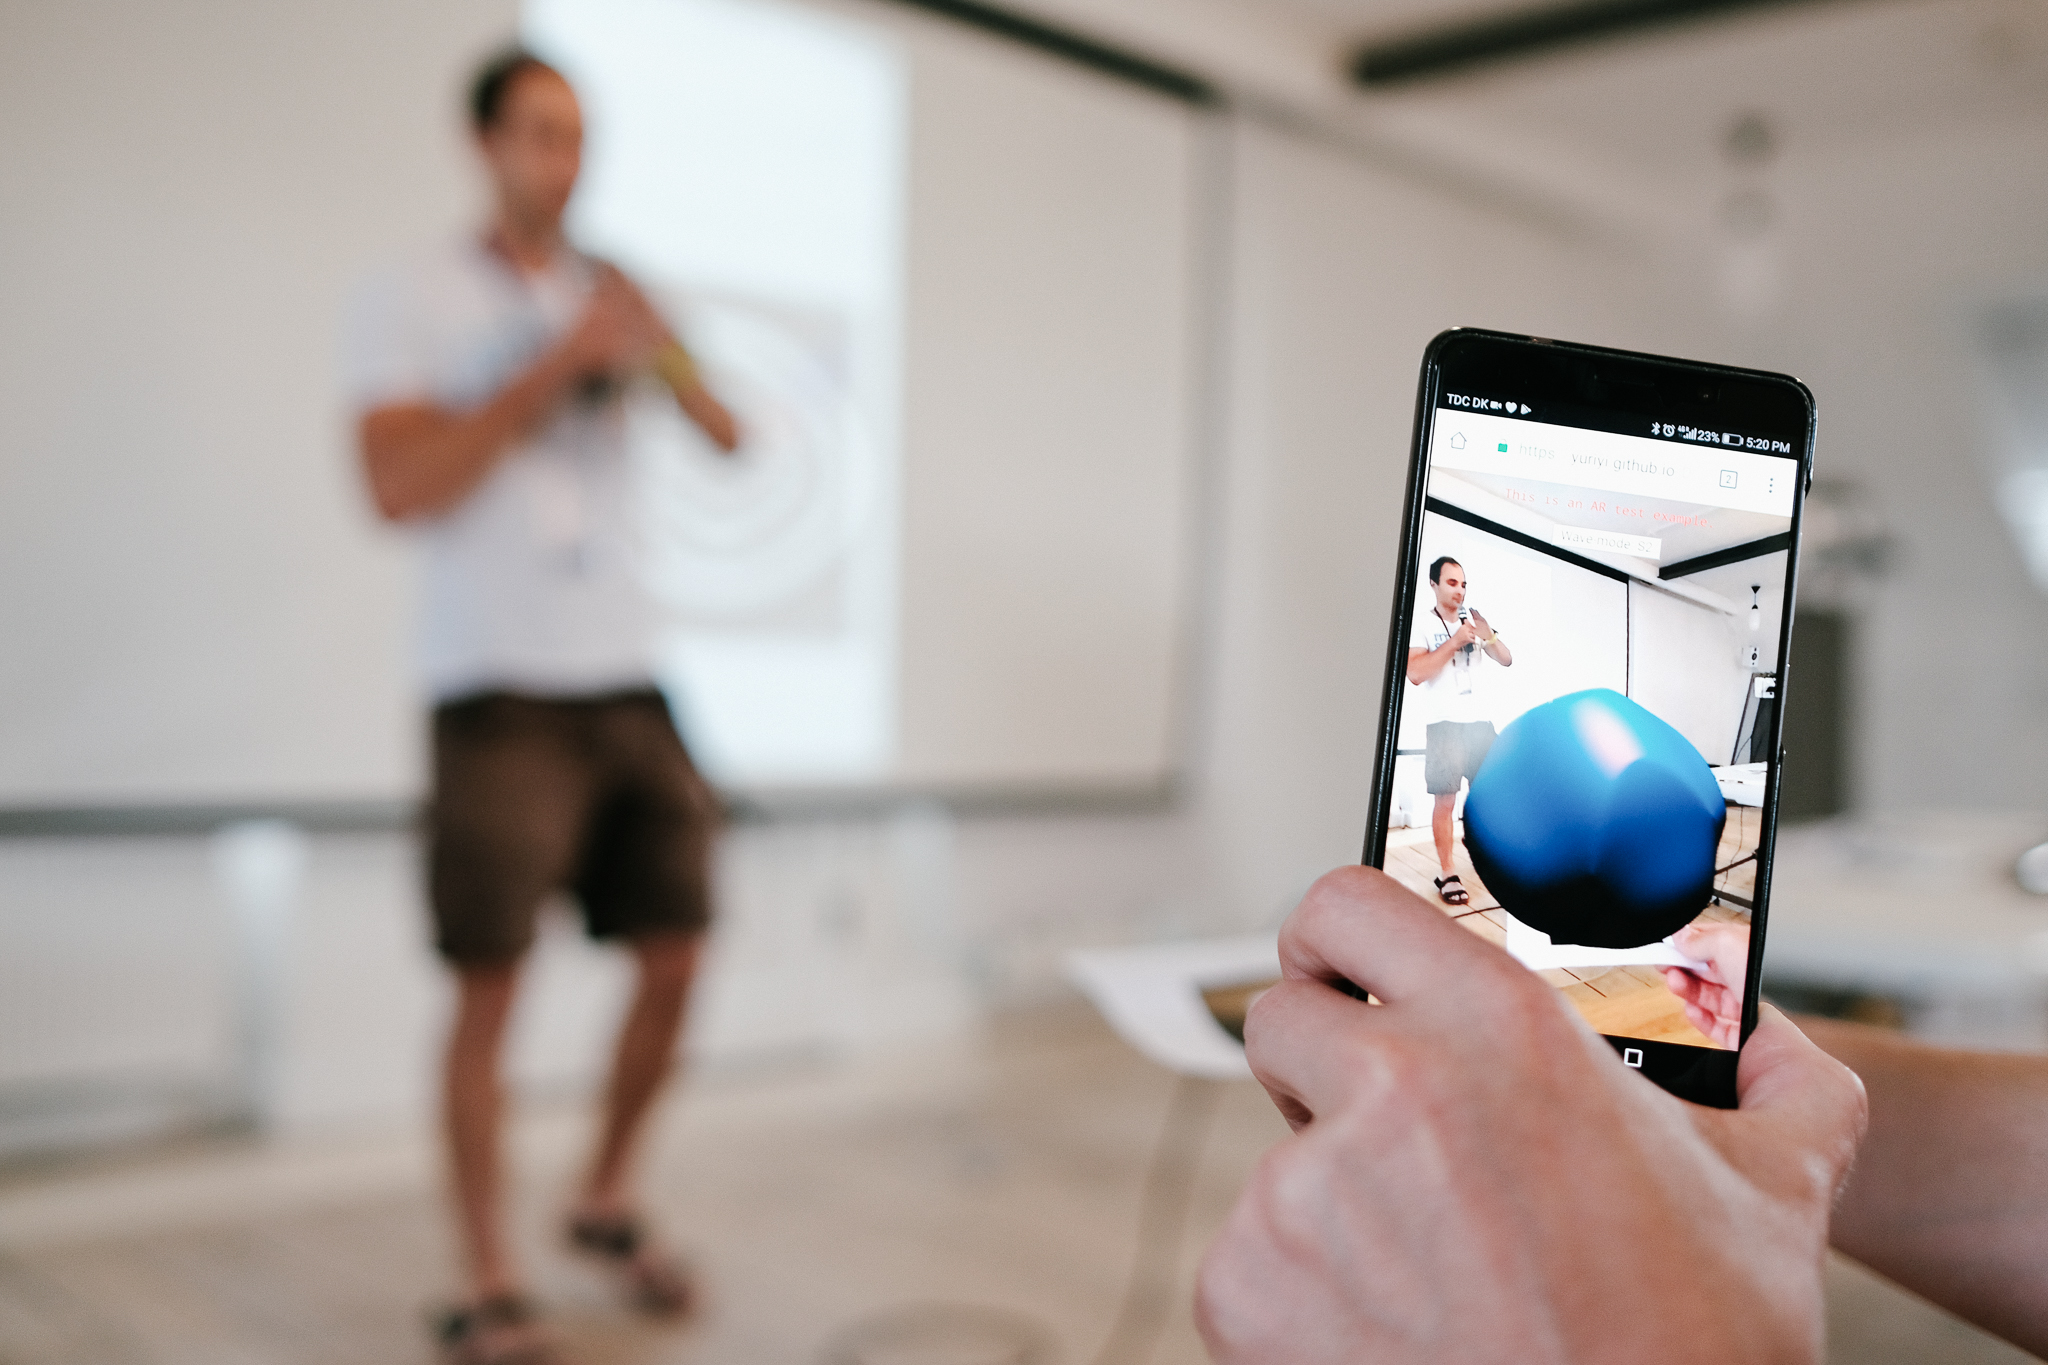
On 16−18 November the UK Oil & Gas Authority (OGA) hosted its first hackathon, with Agile providing the format and technical support. This followed a week of training the OGA provided — again, through Agile — back in September. The theme for the hackathon was ‘machine learning’, and I’m pretty sure it was the first ever geoscience hackathon in the UK.

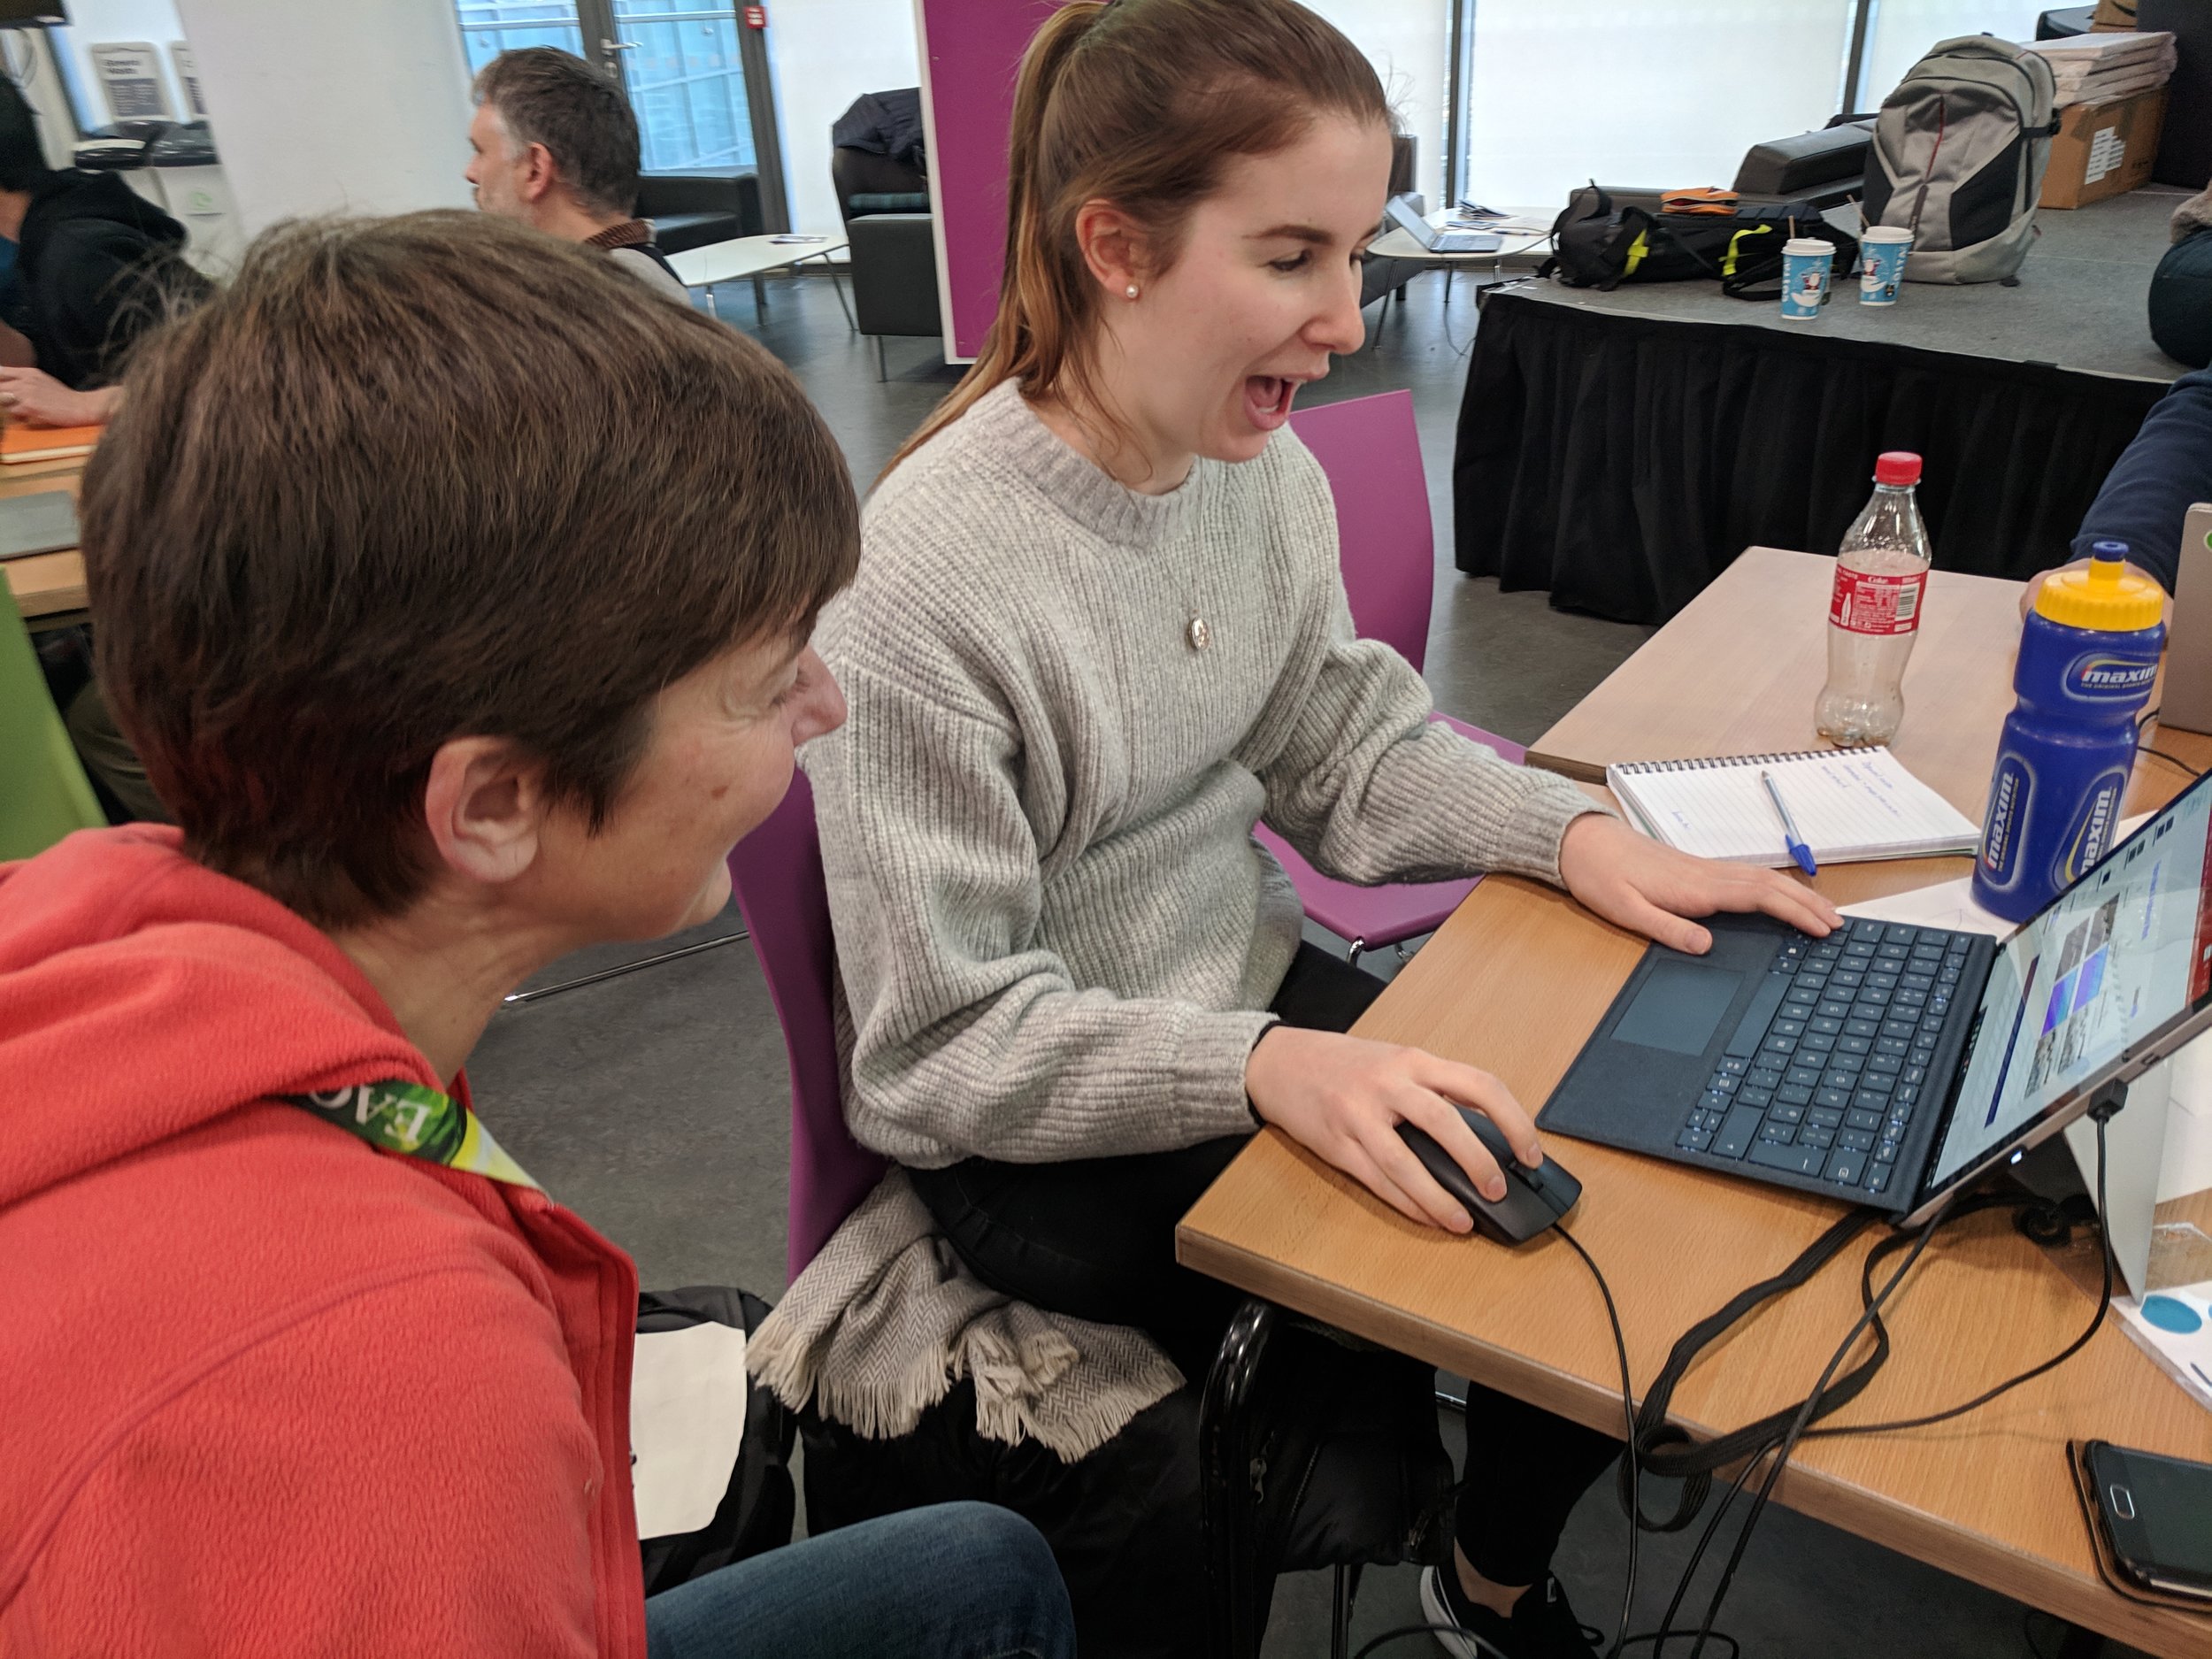
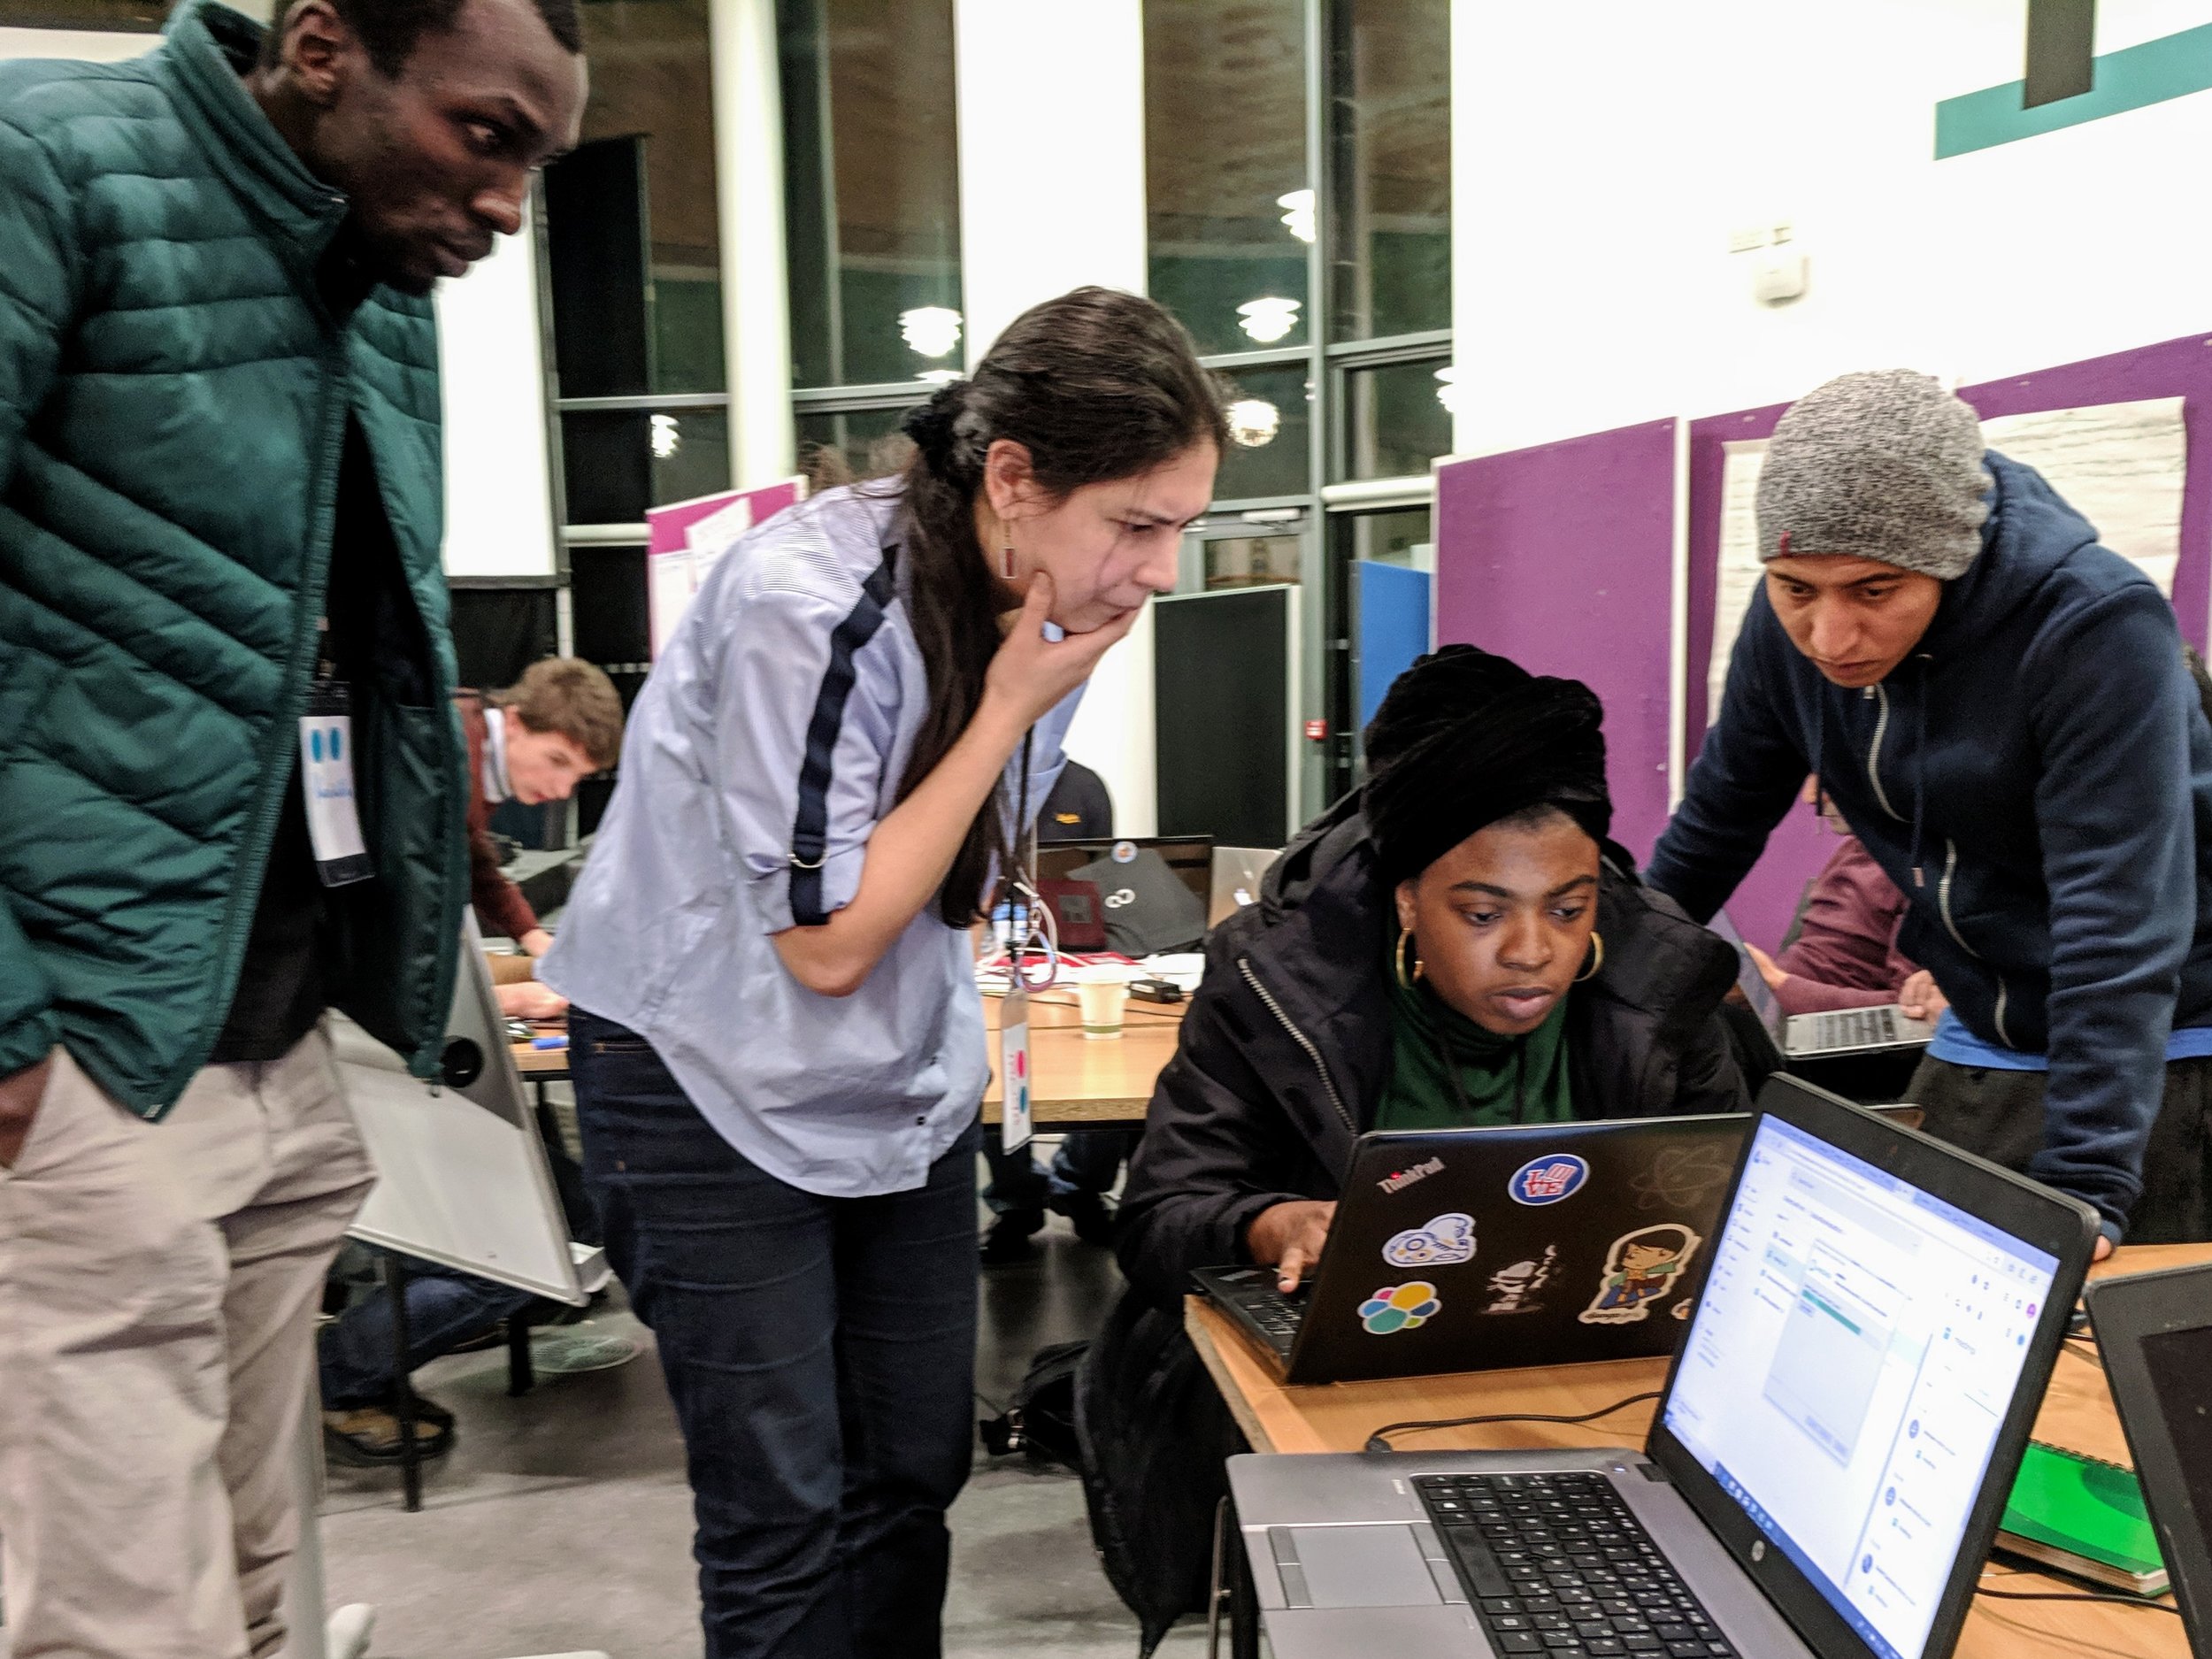
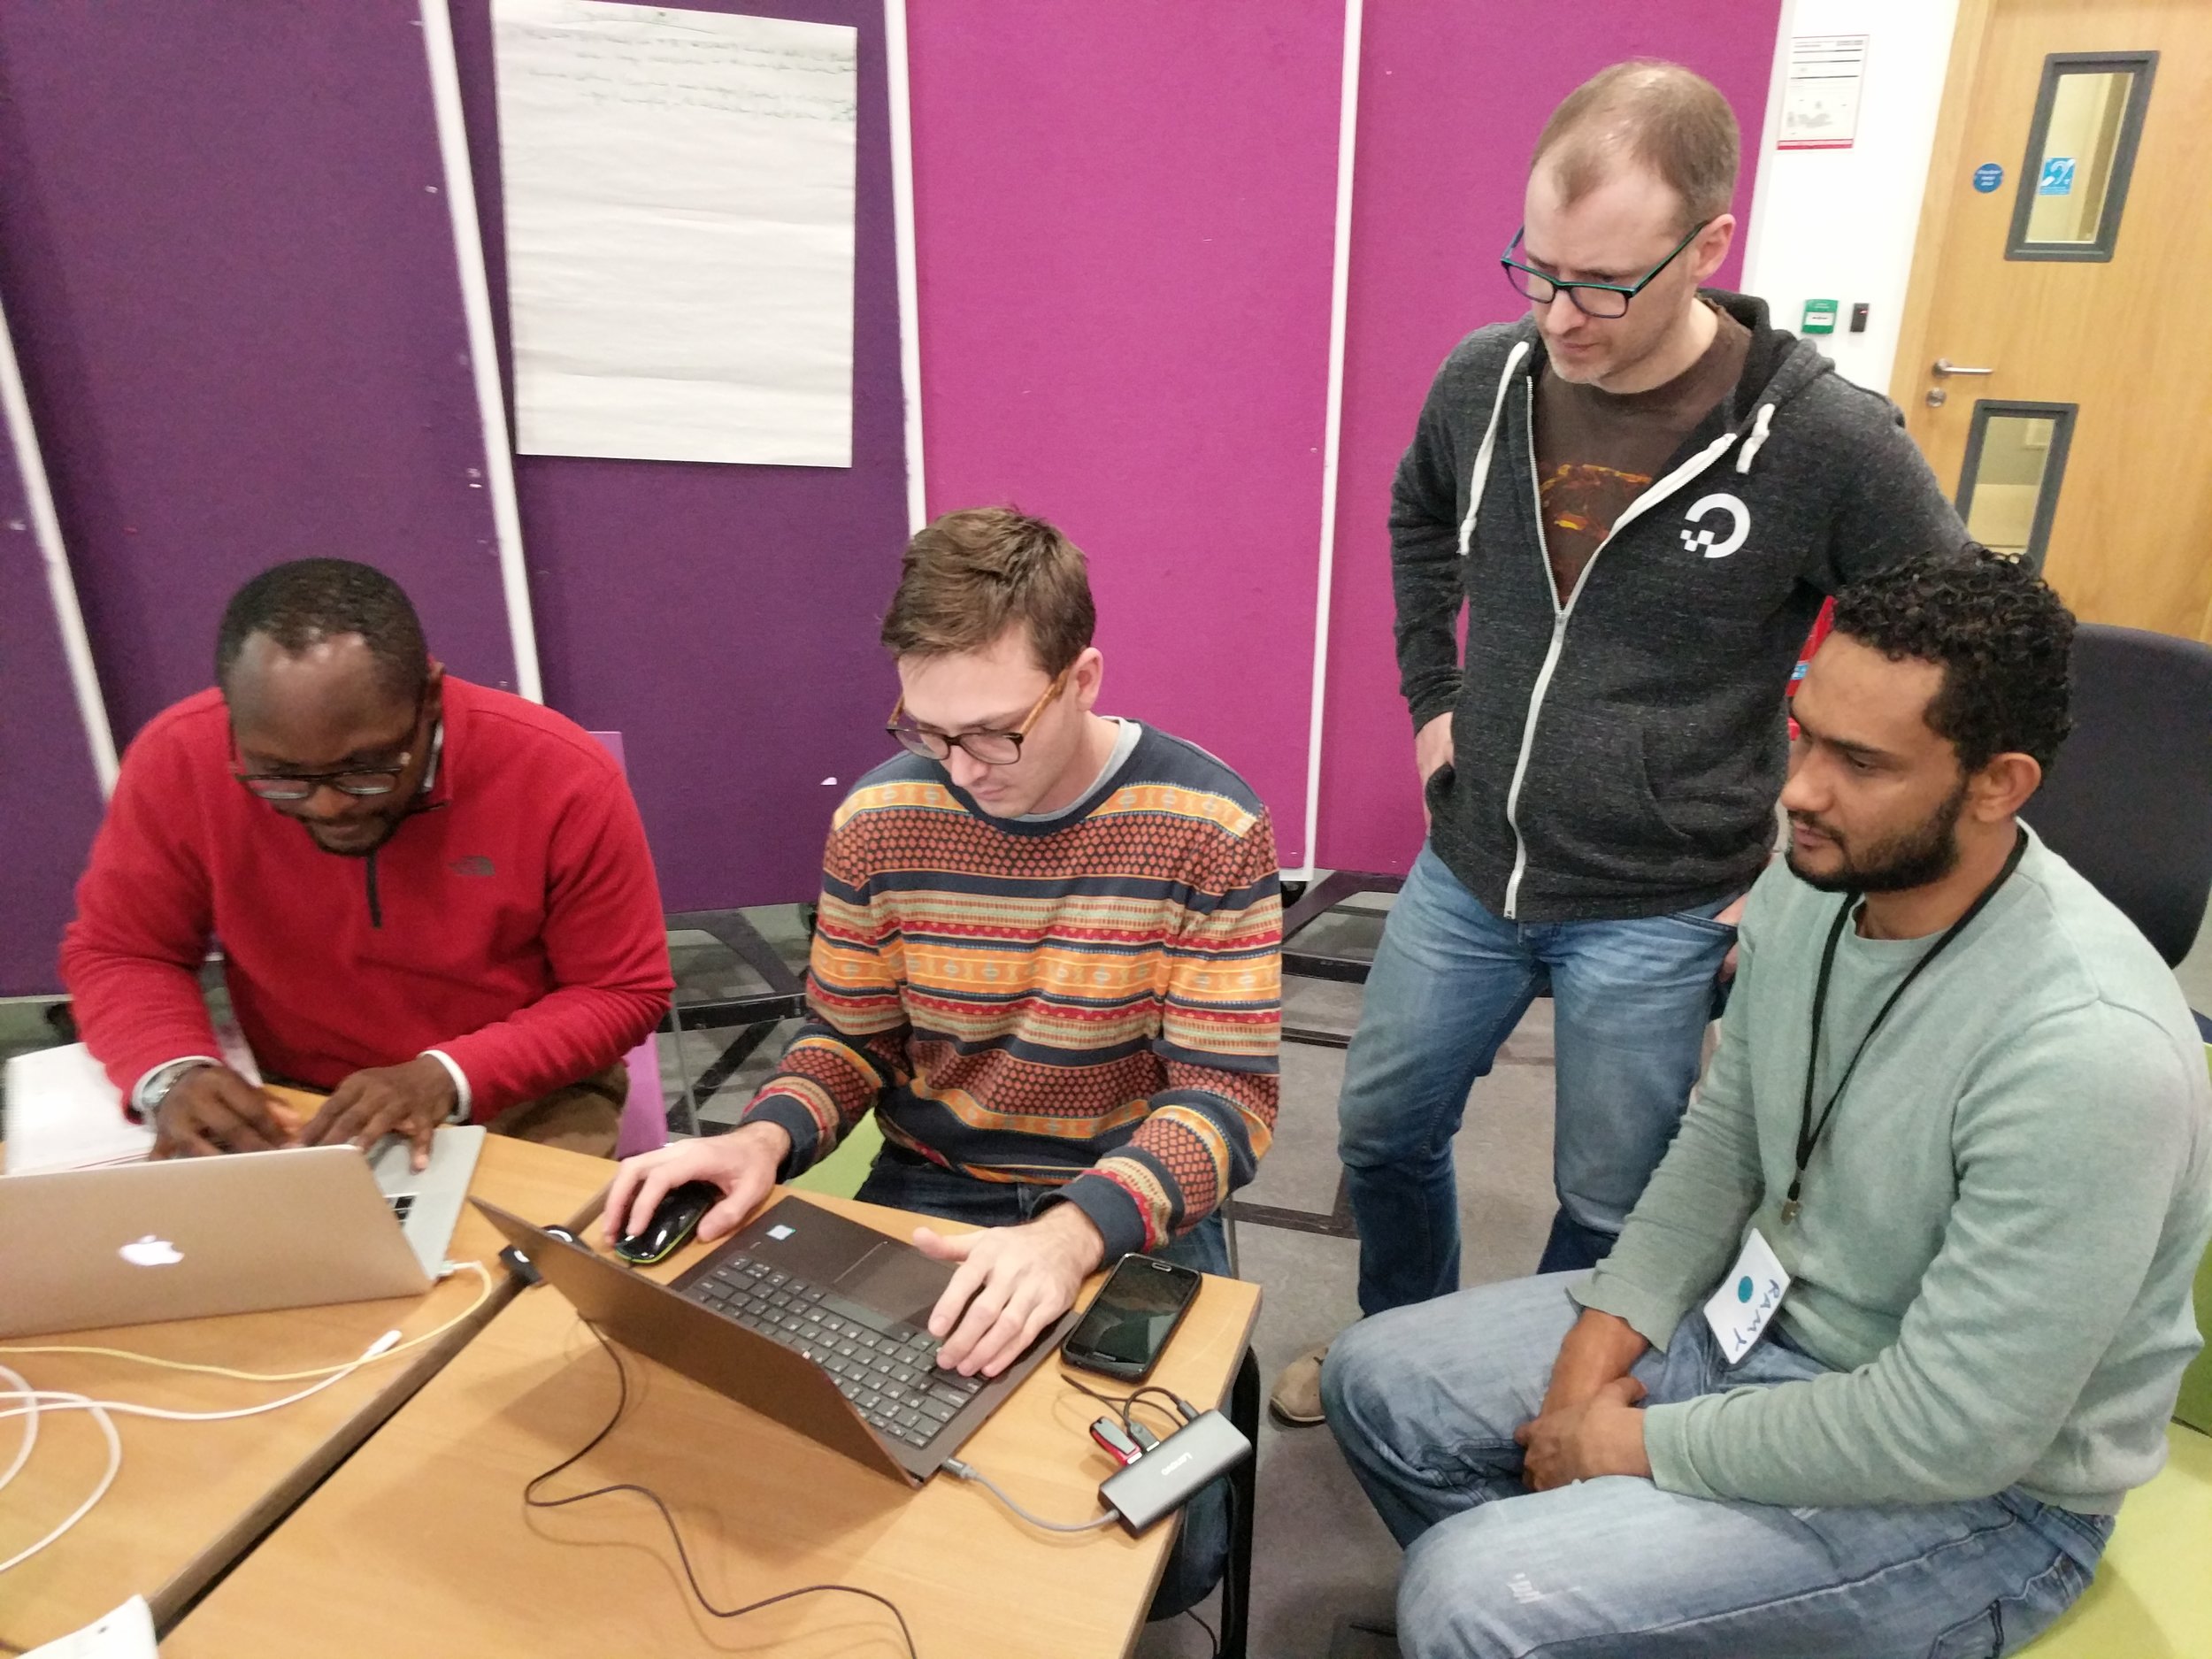
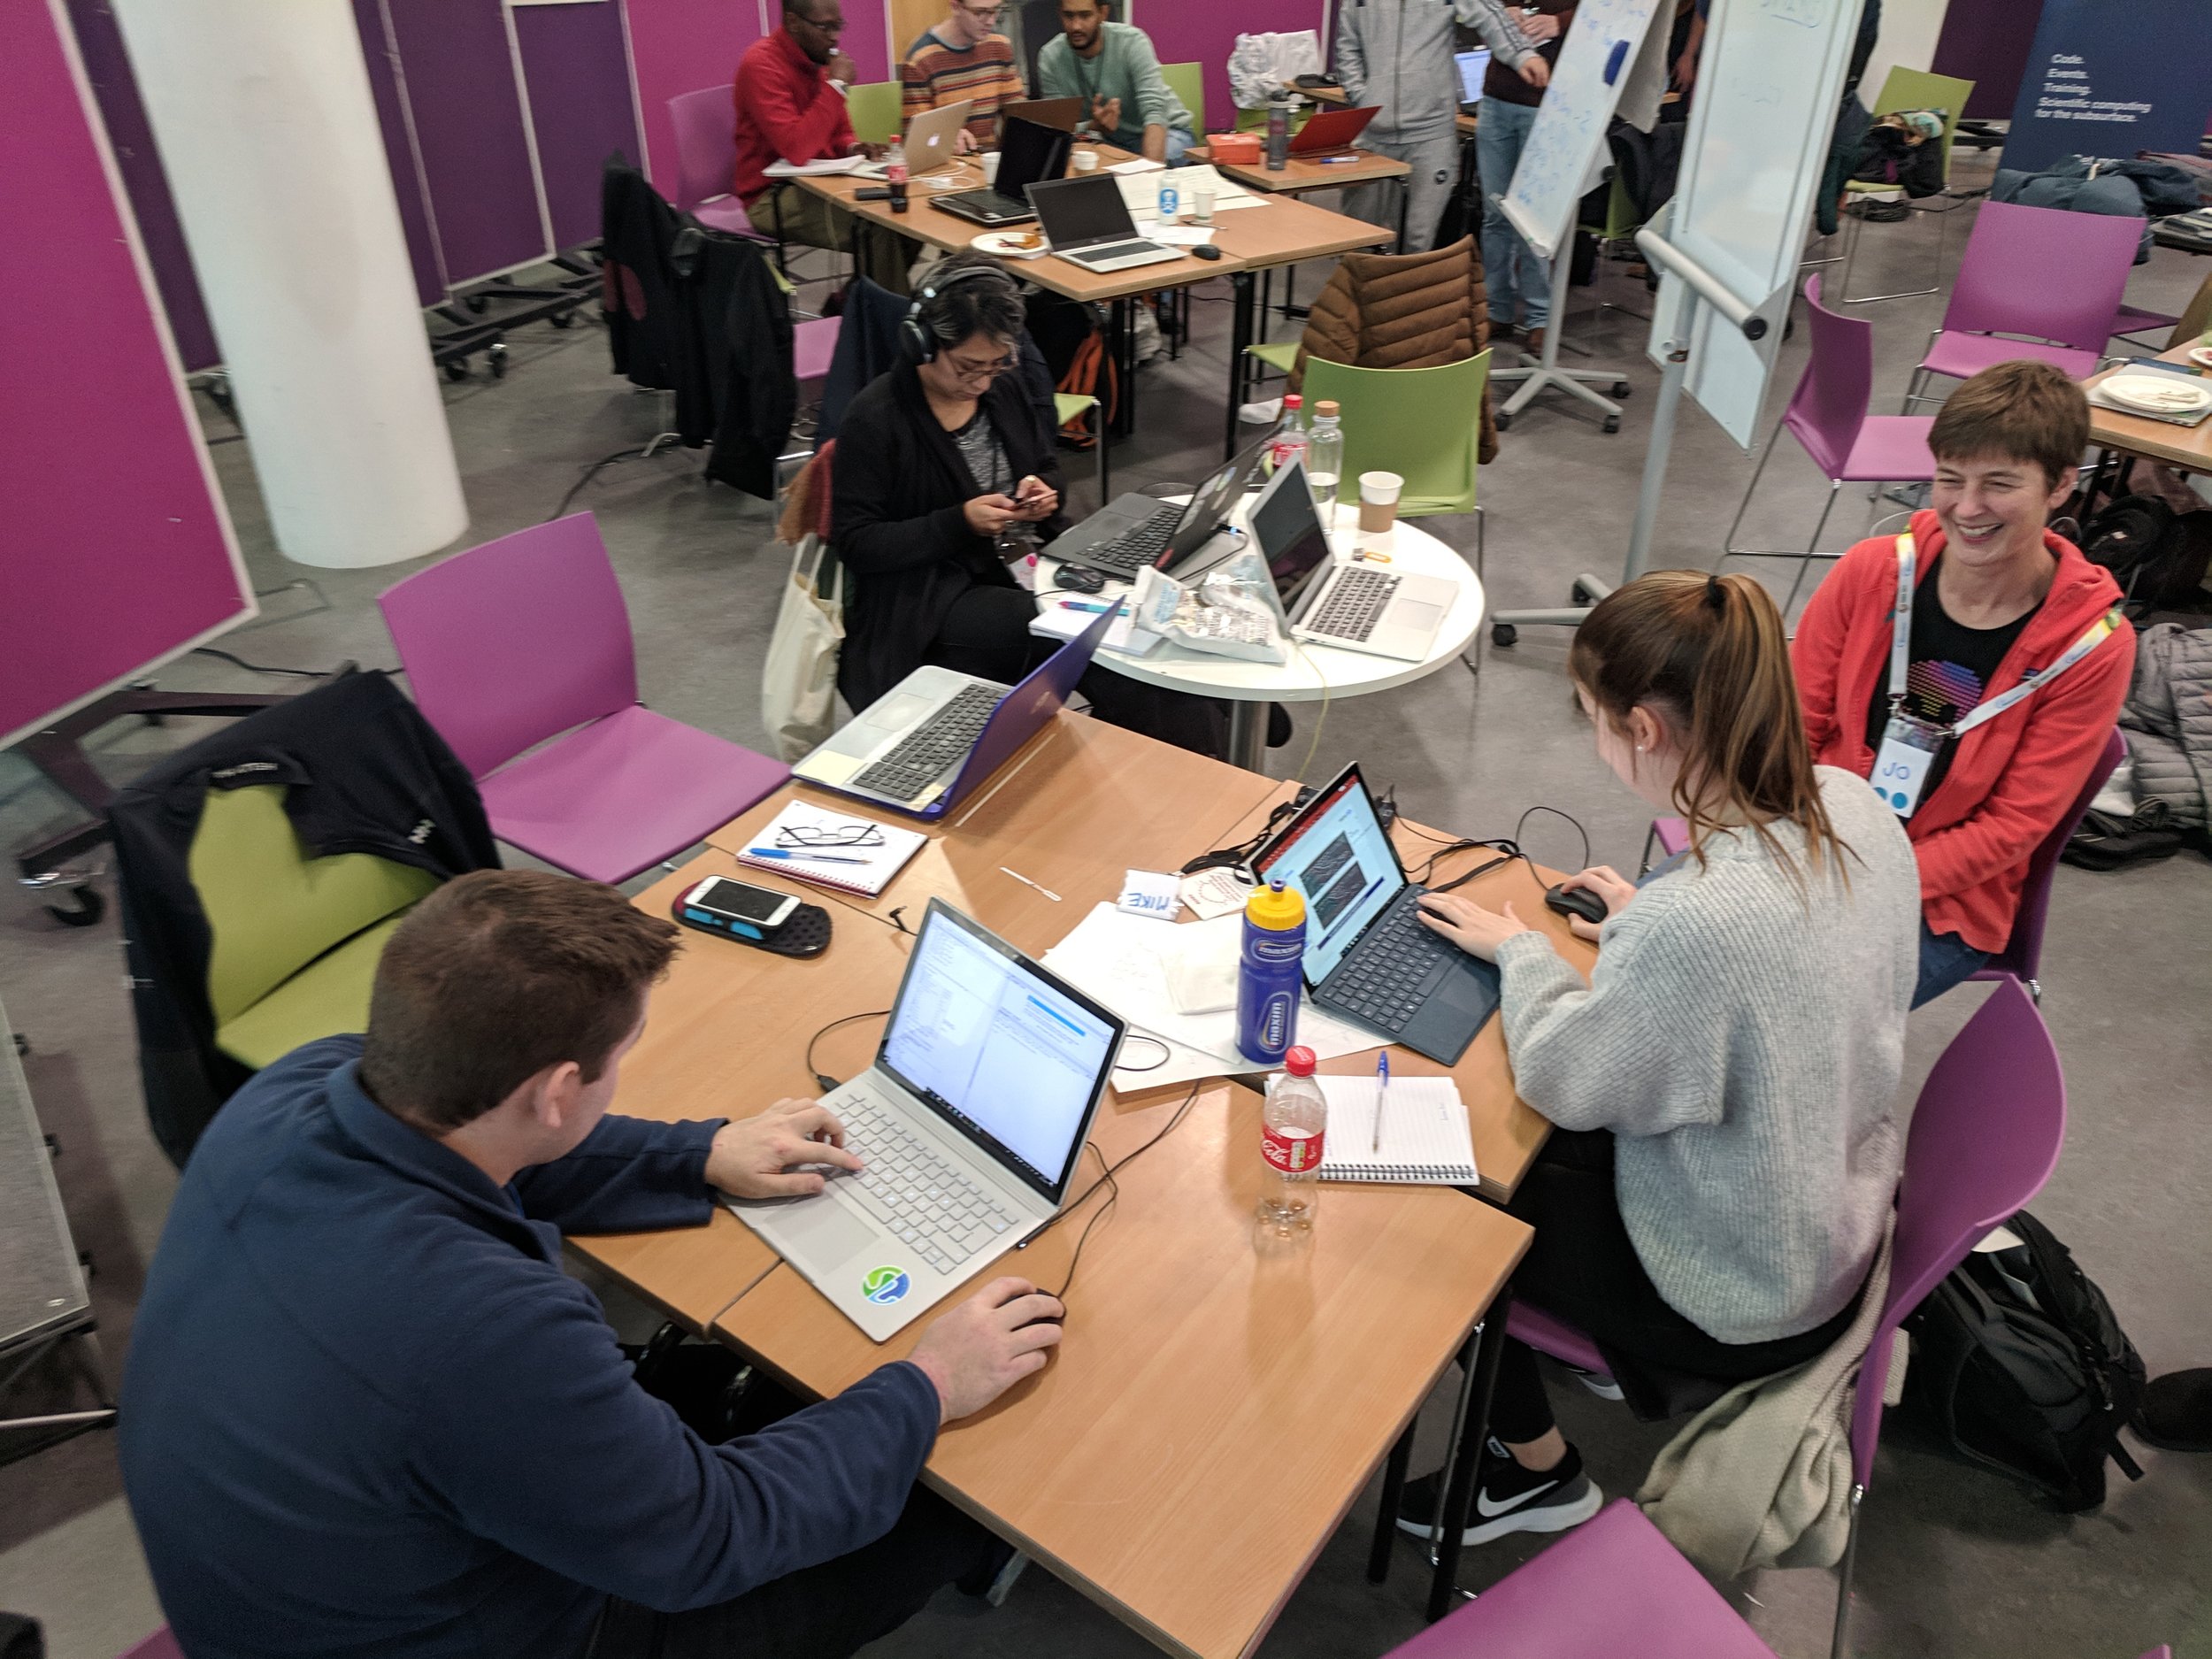
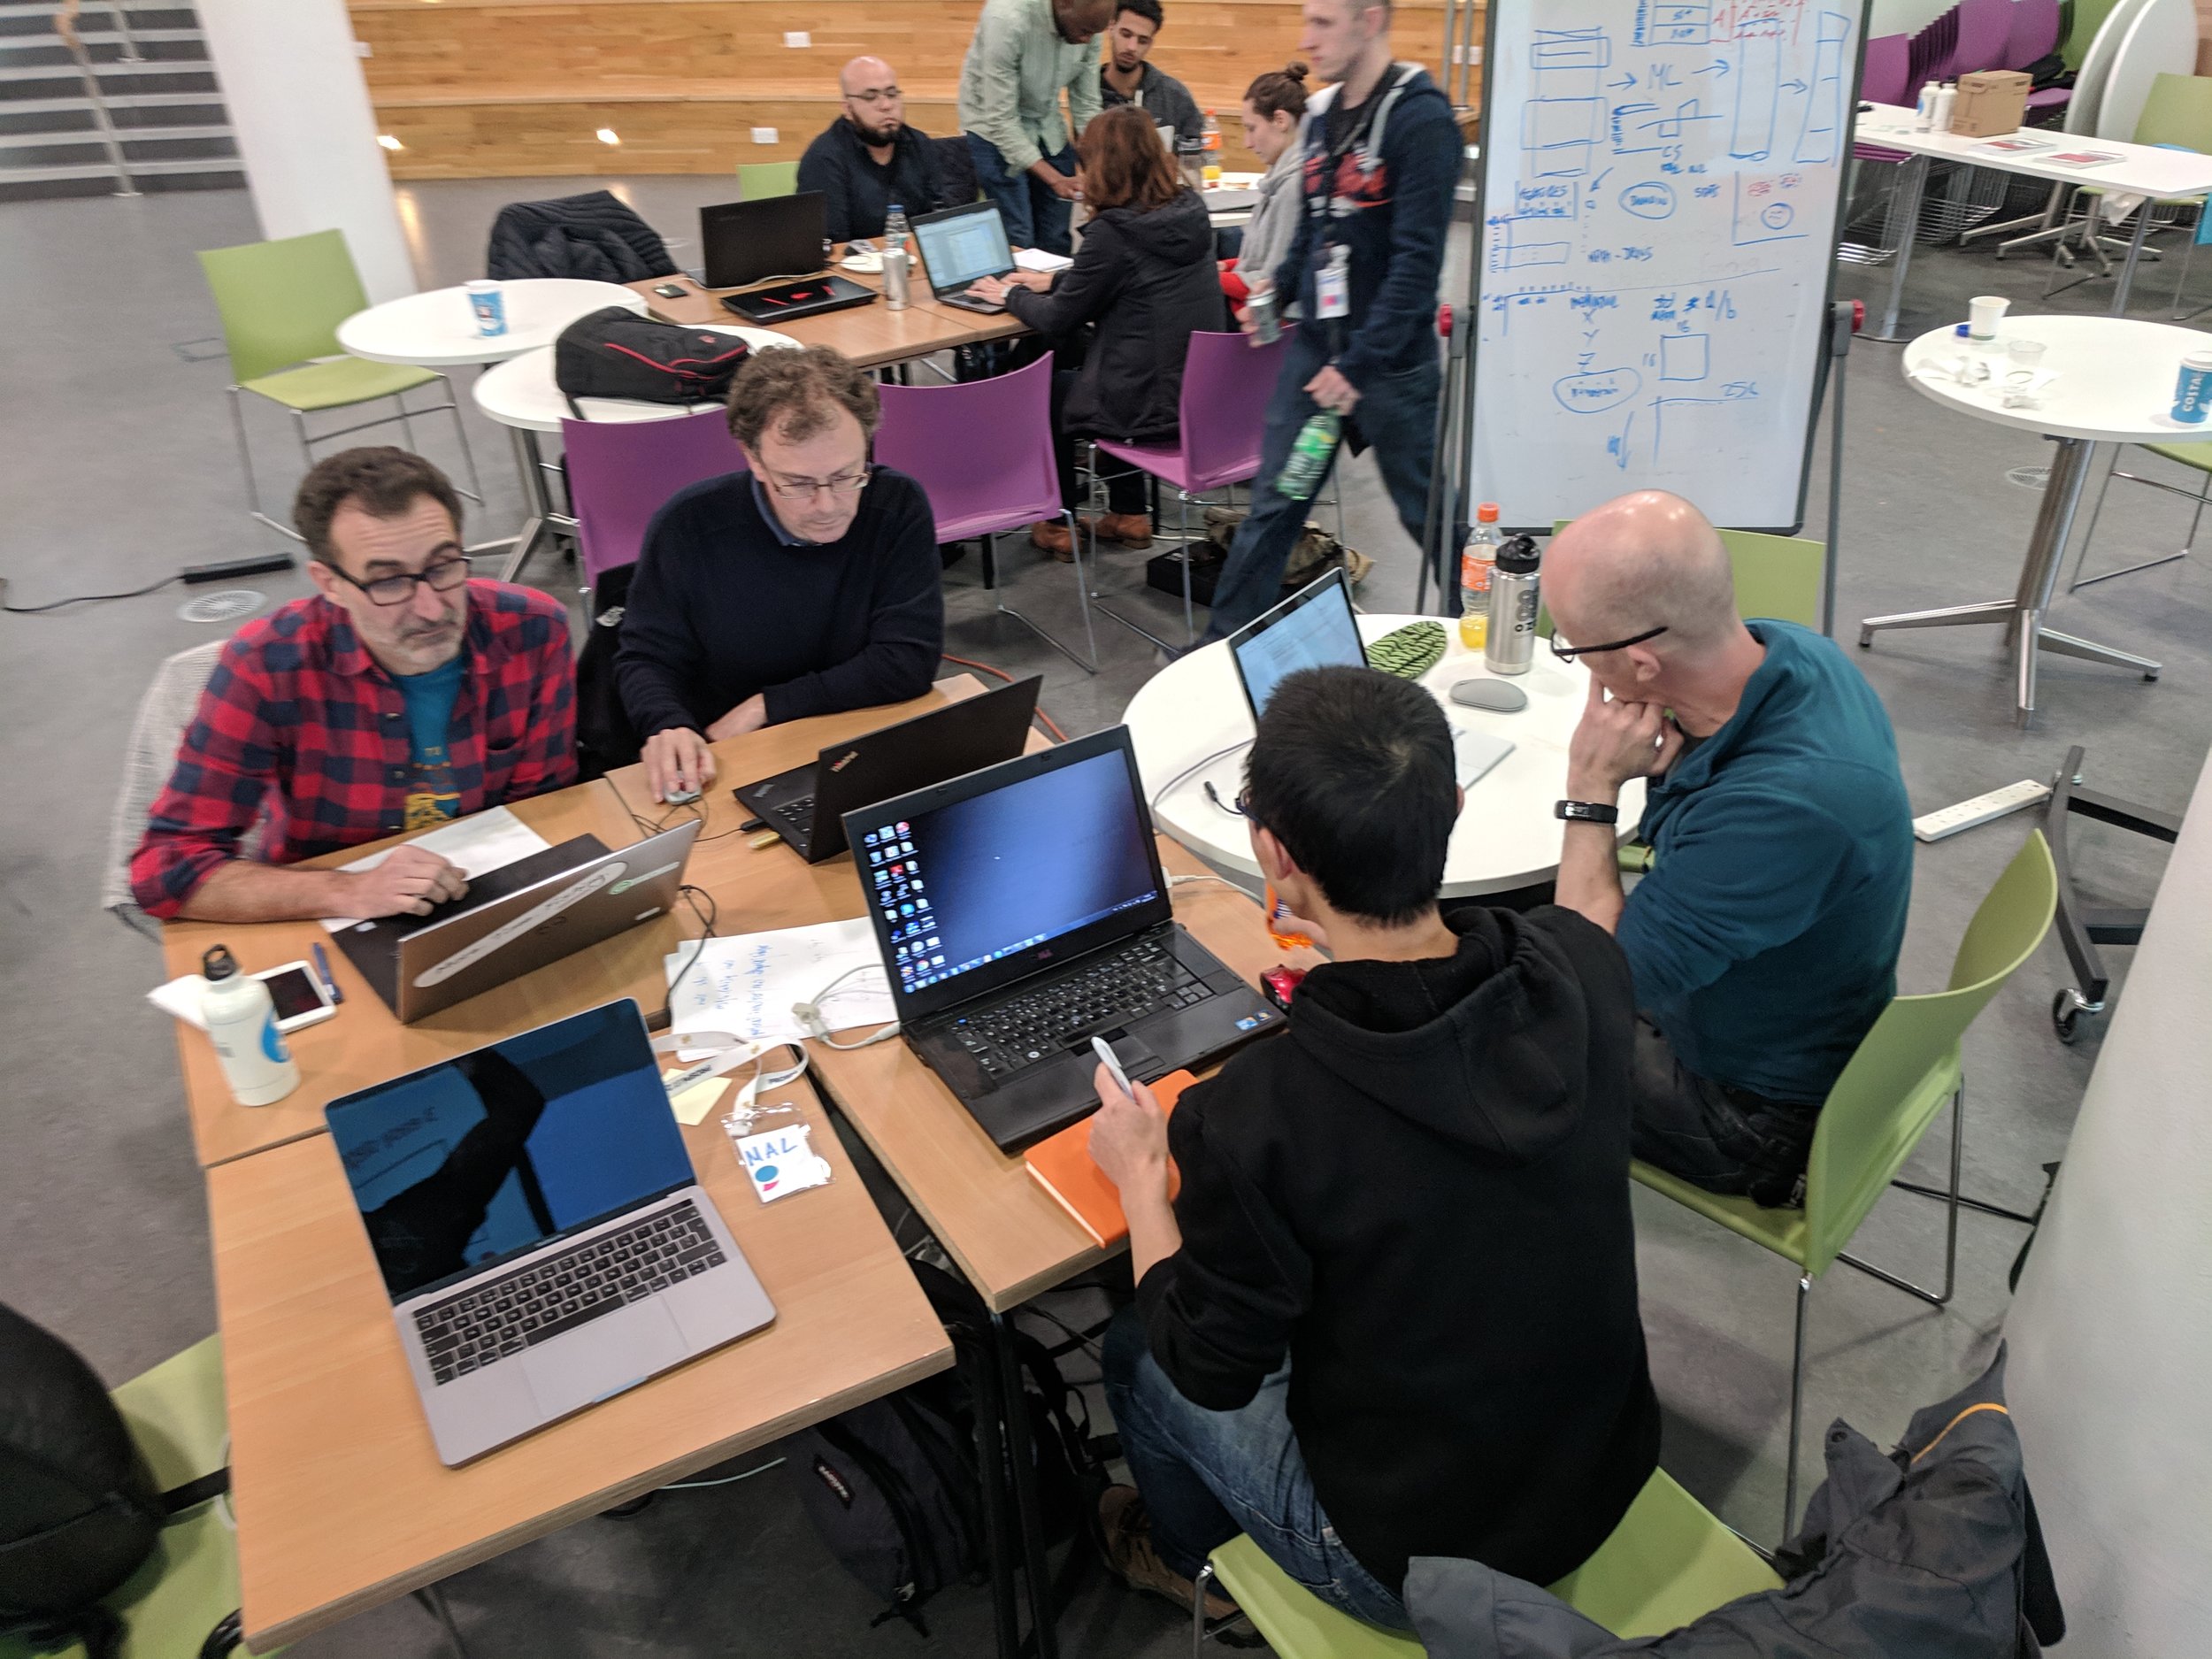
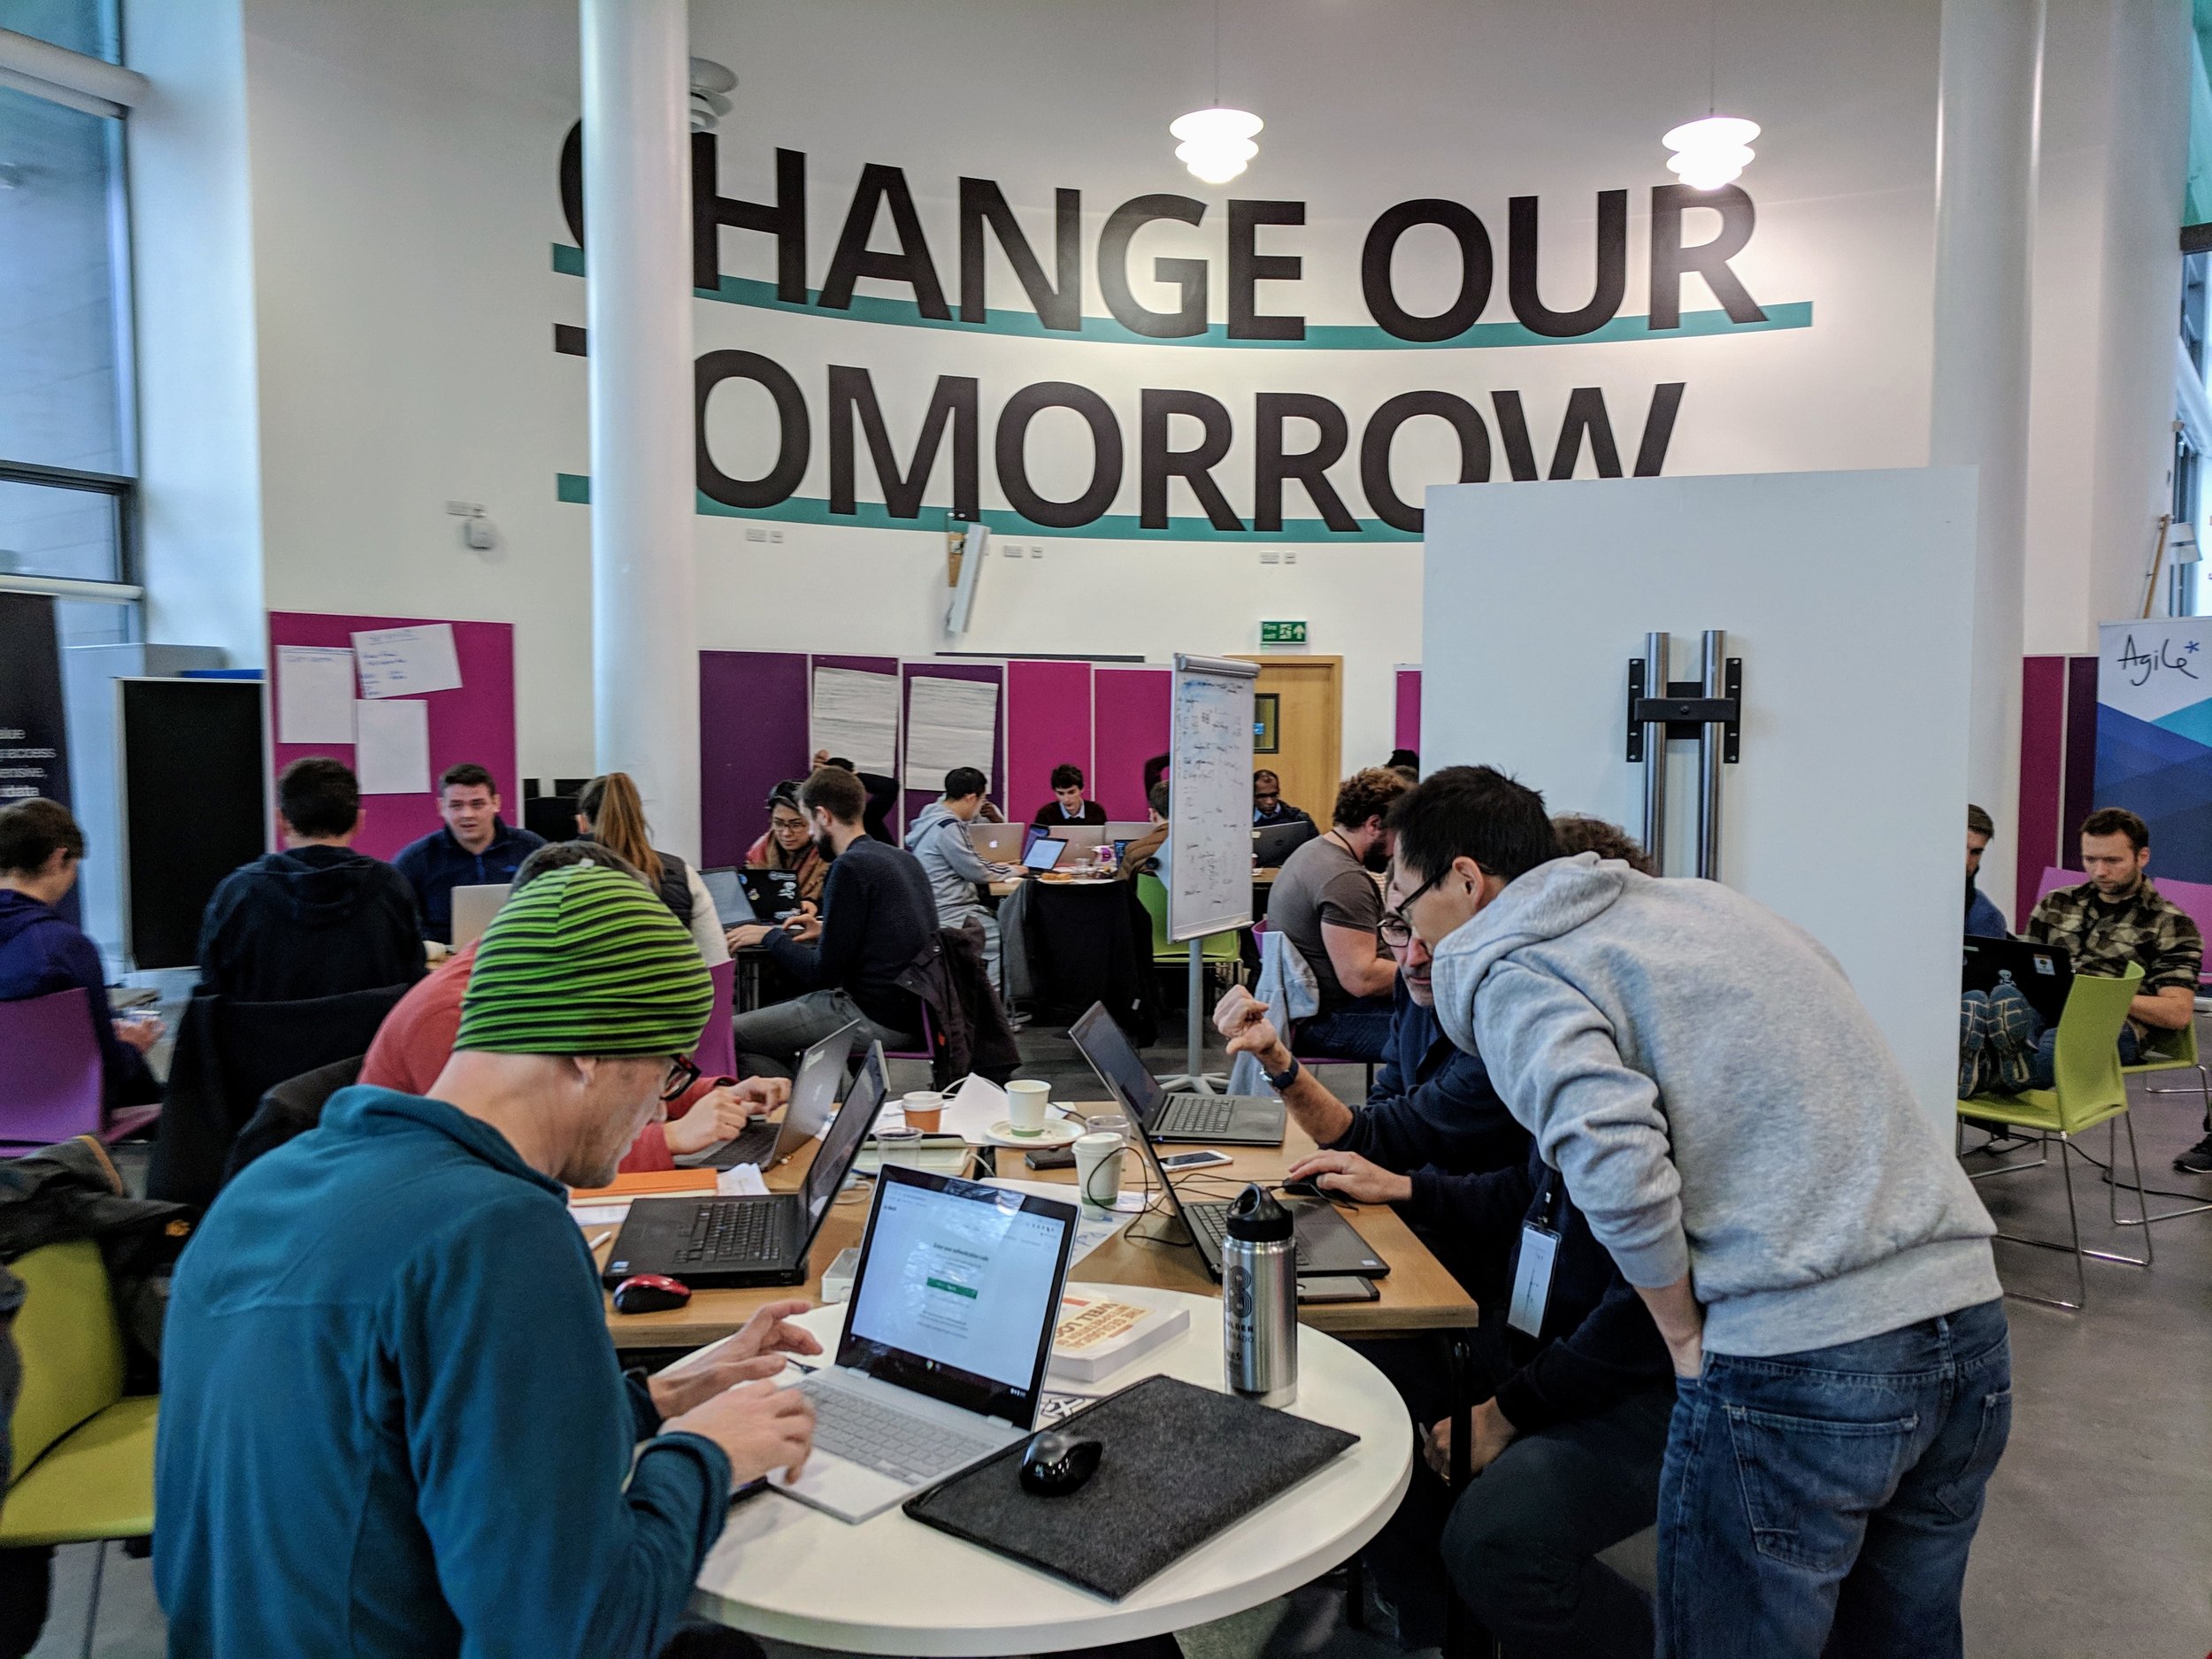
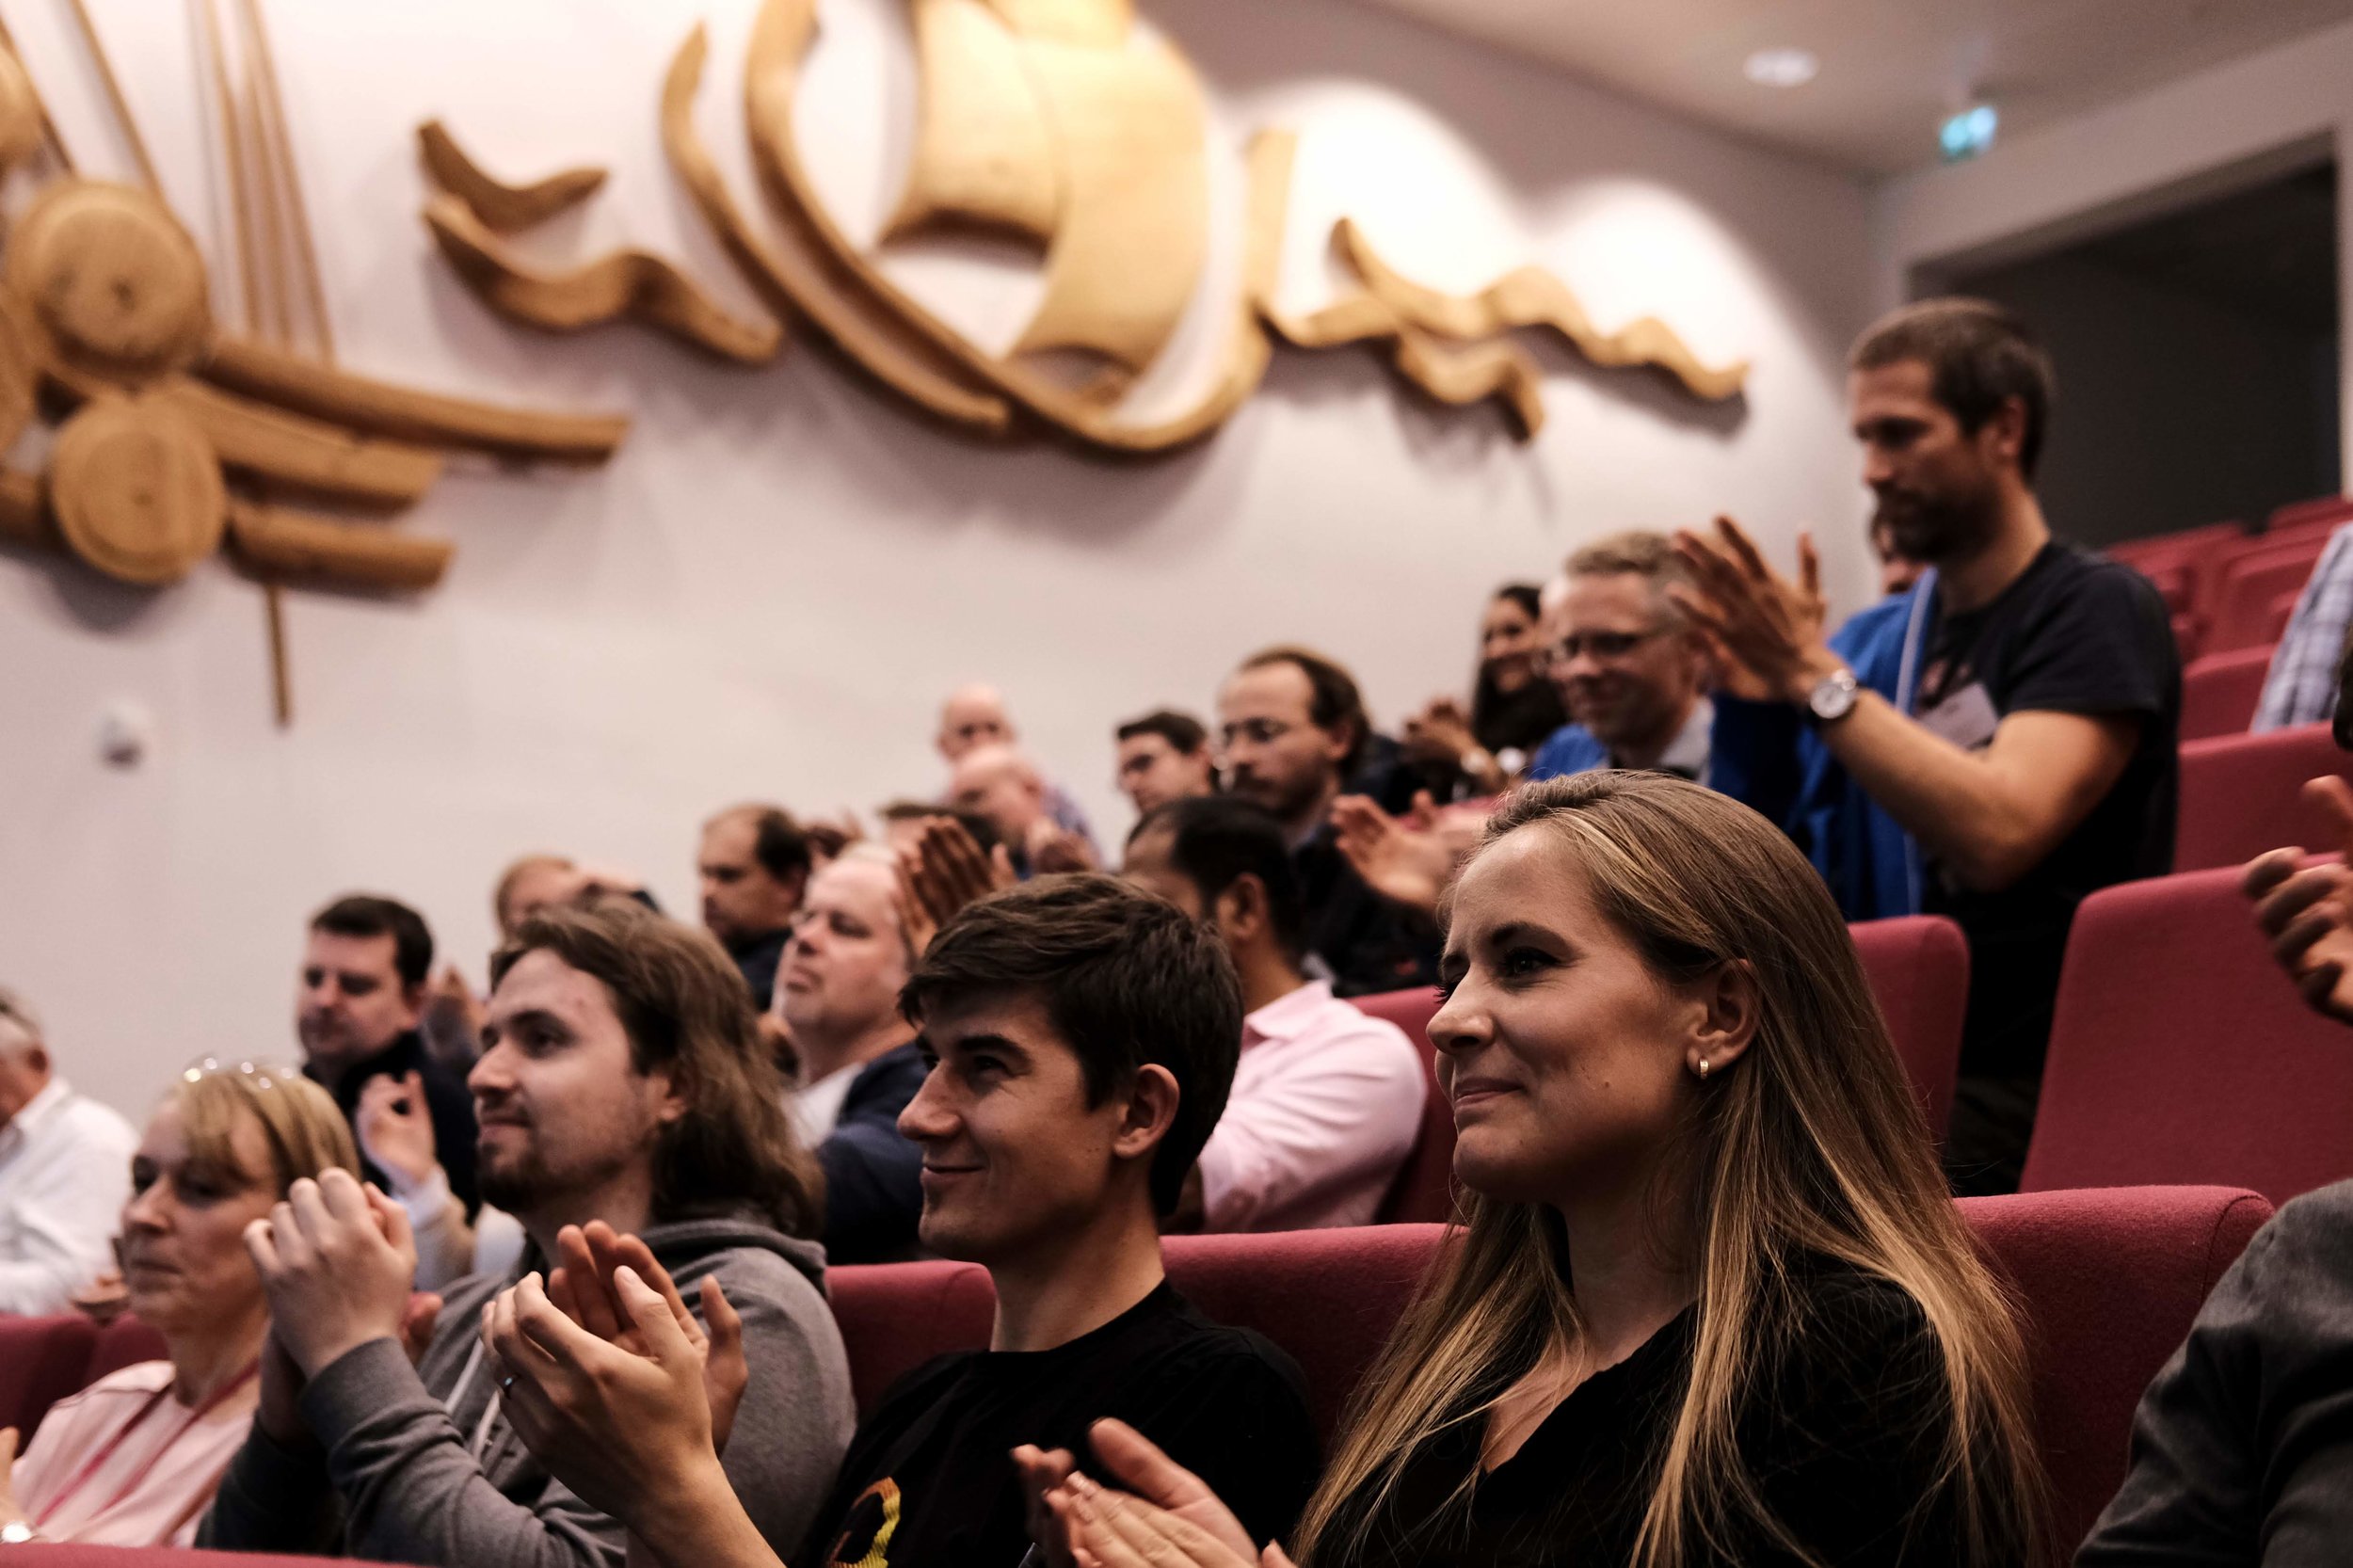
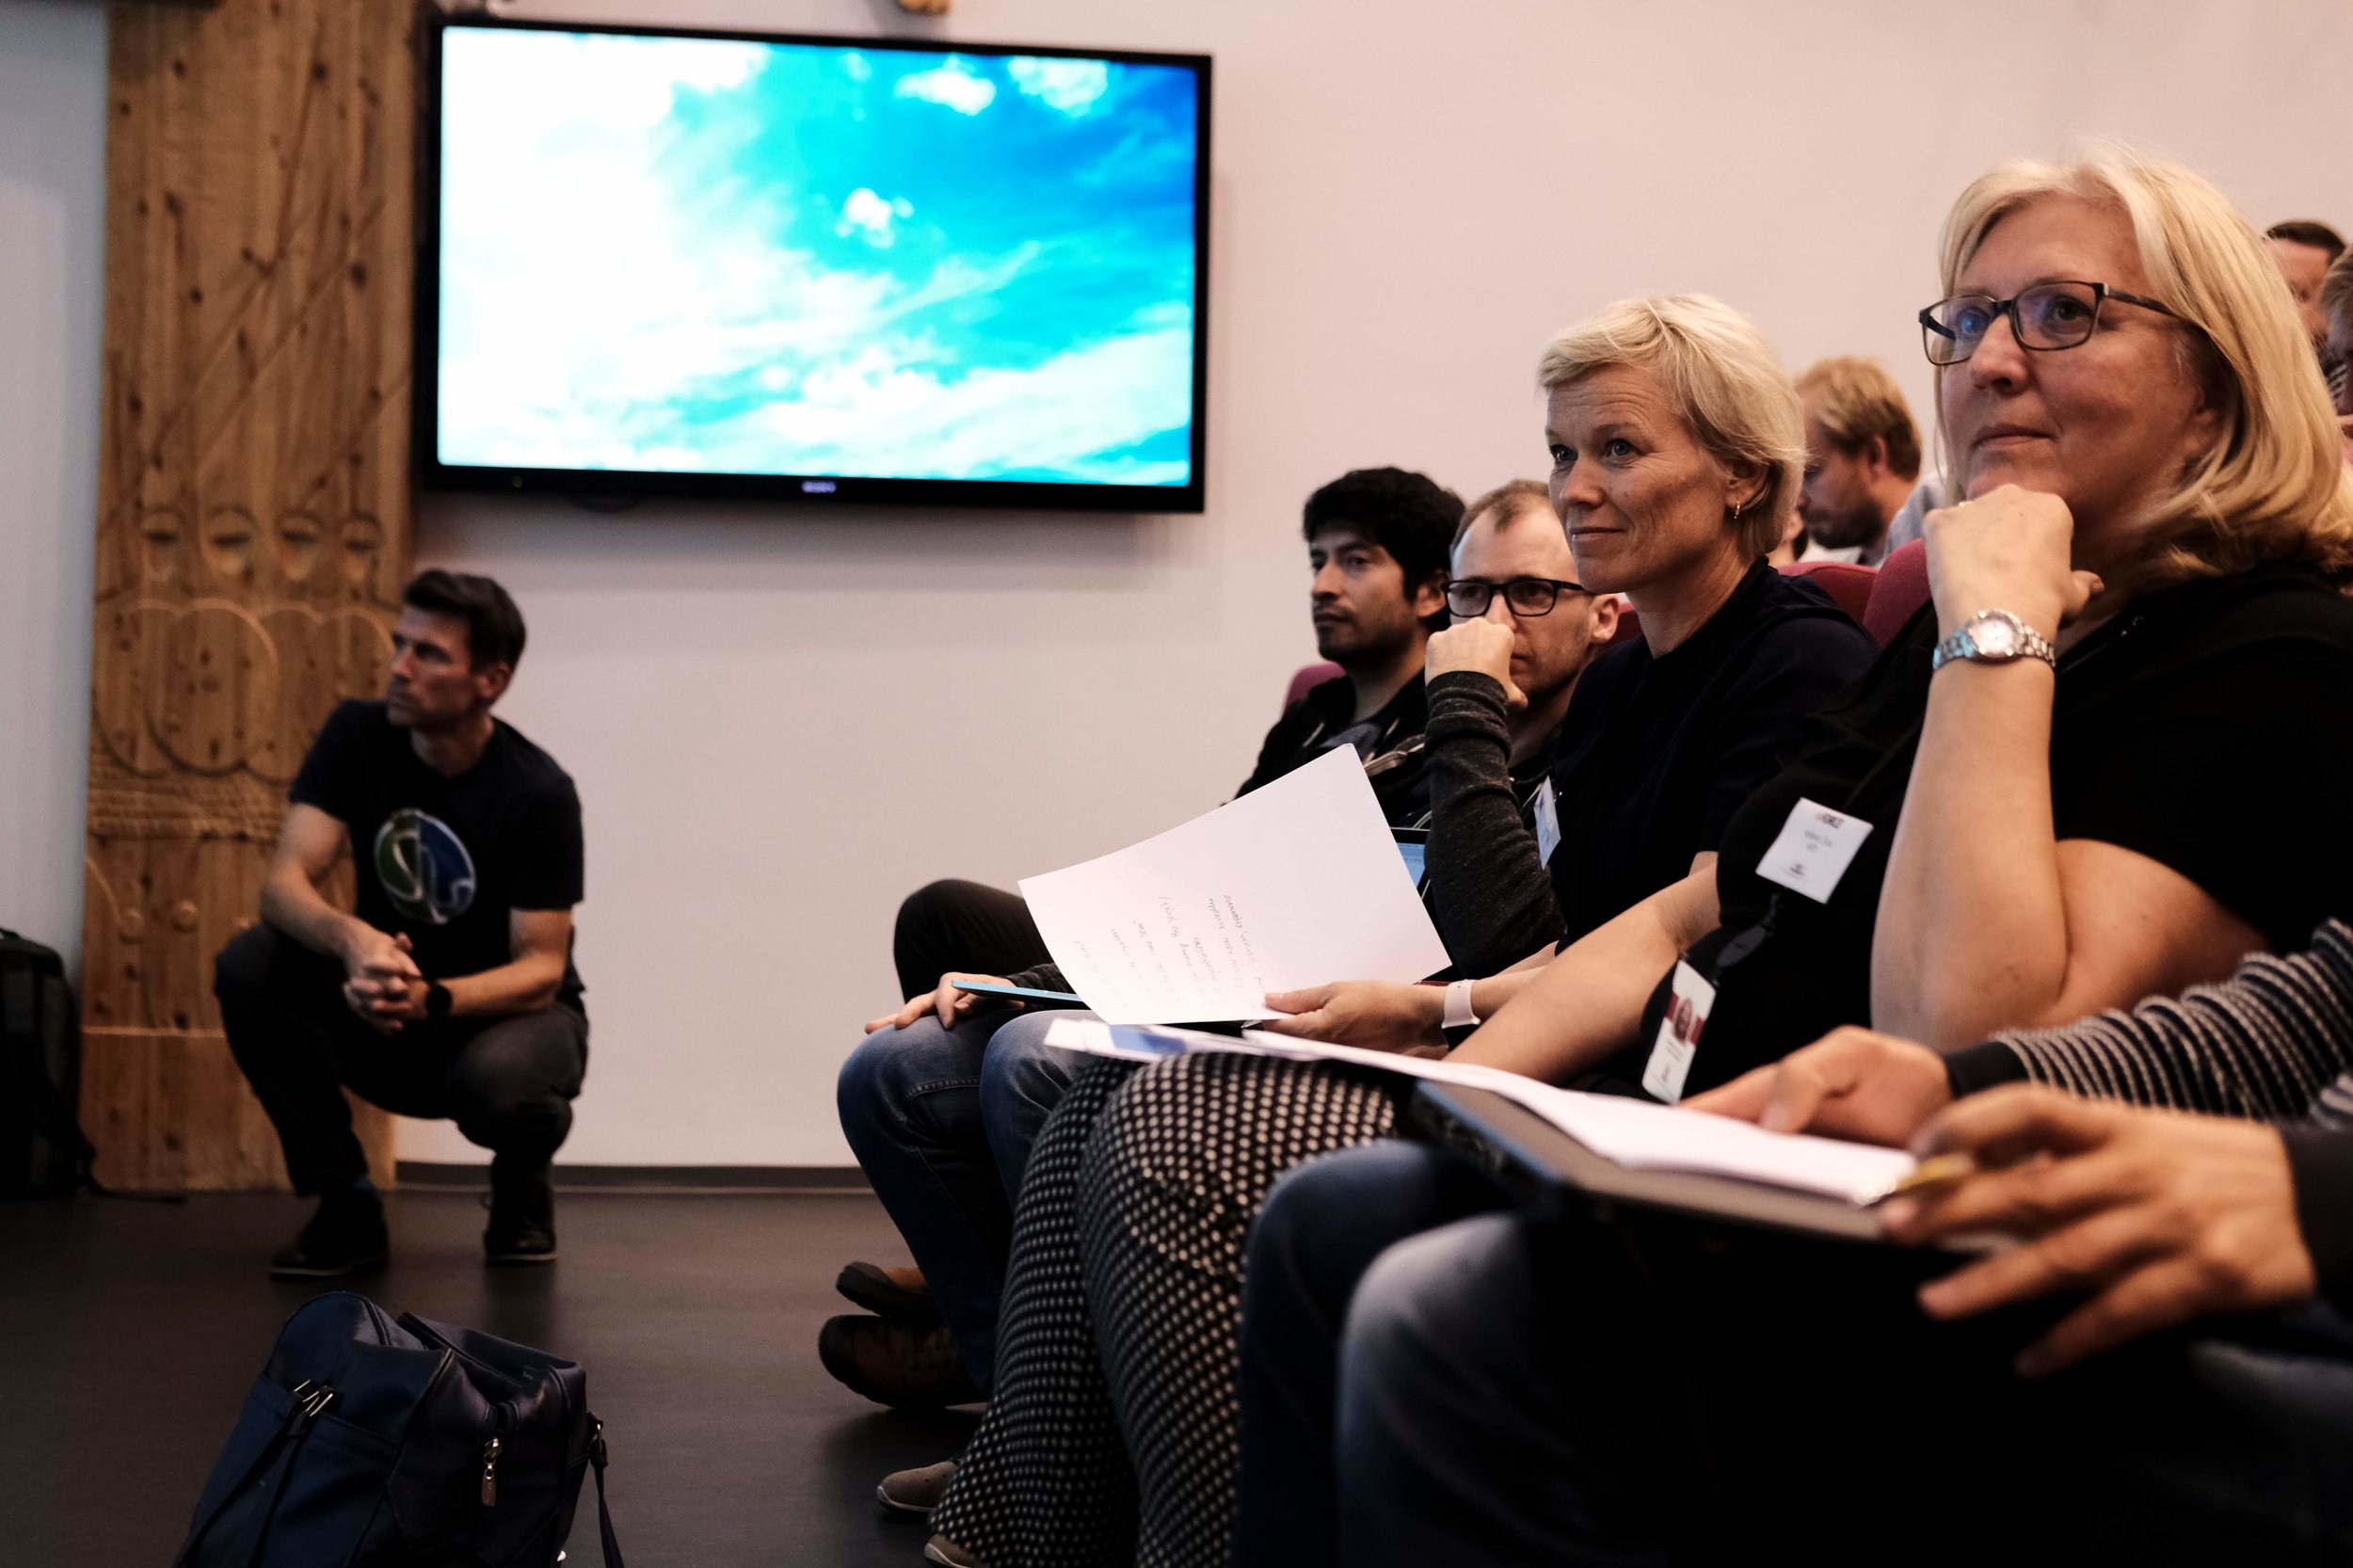
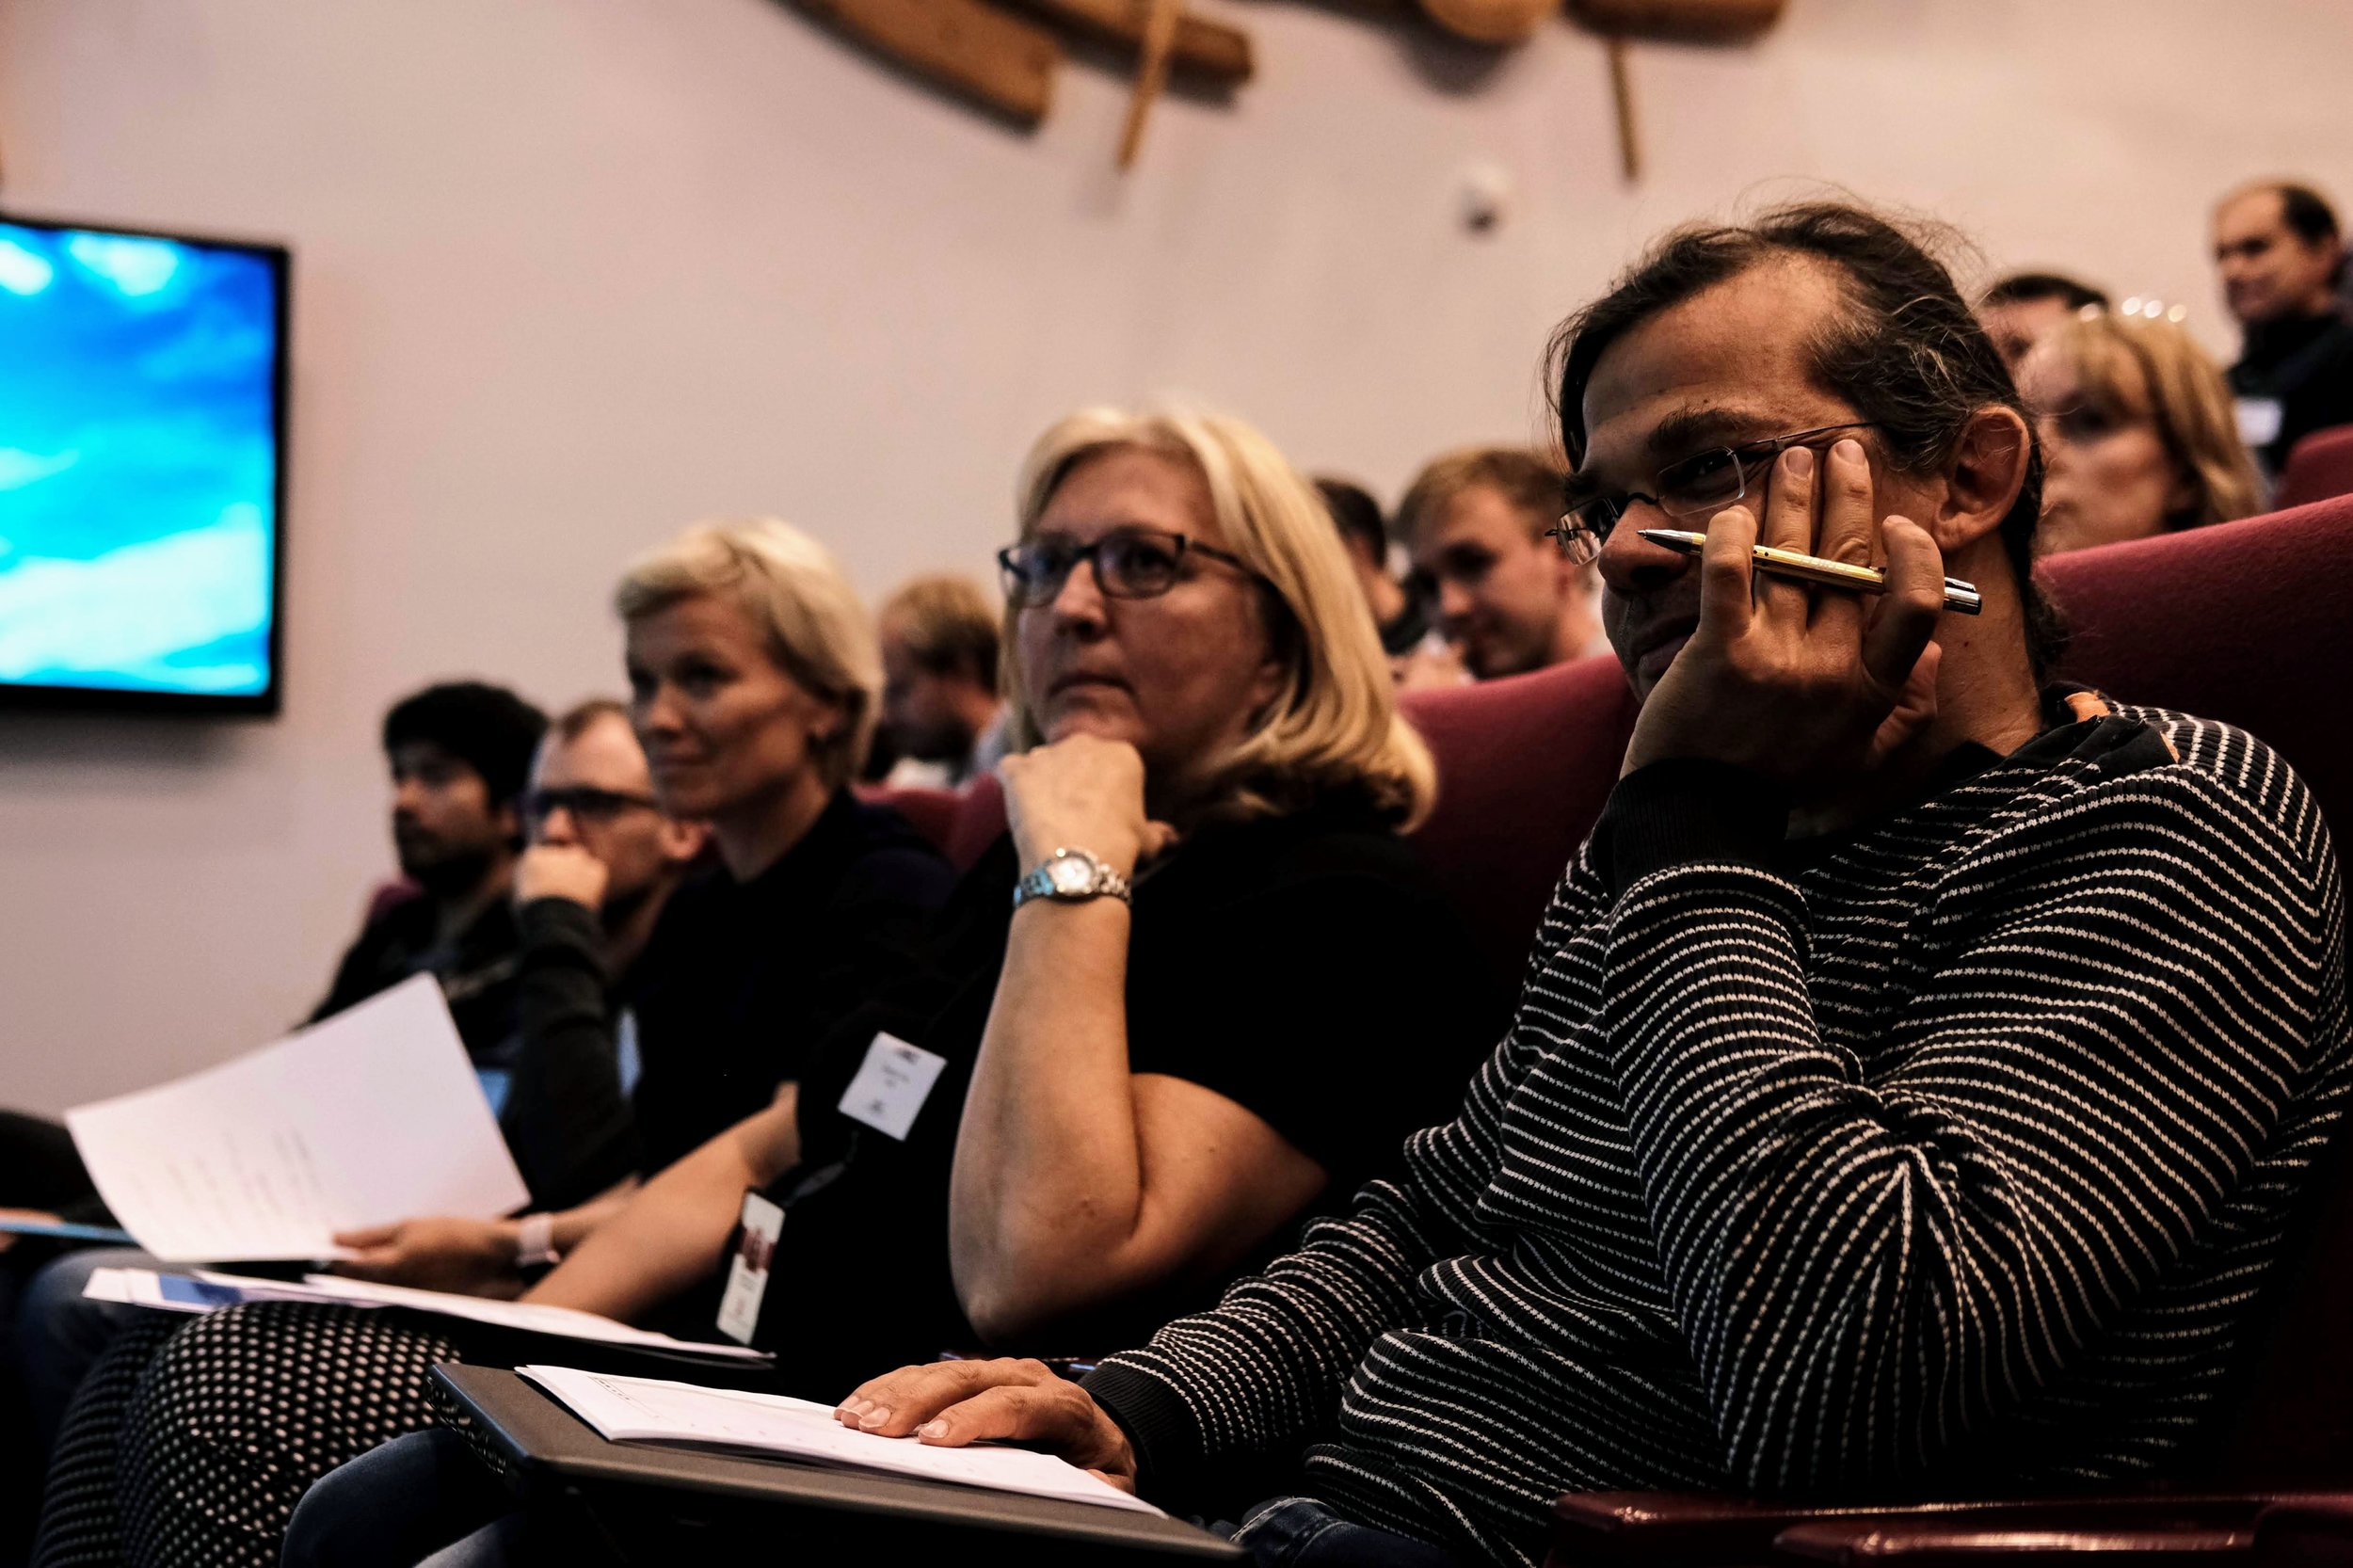
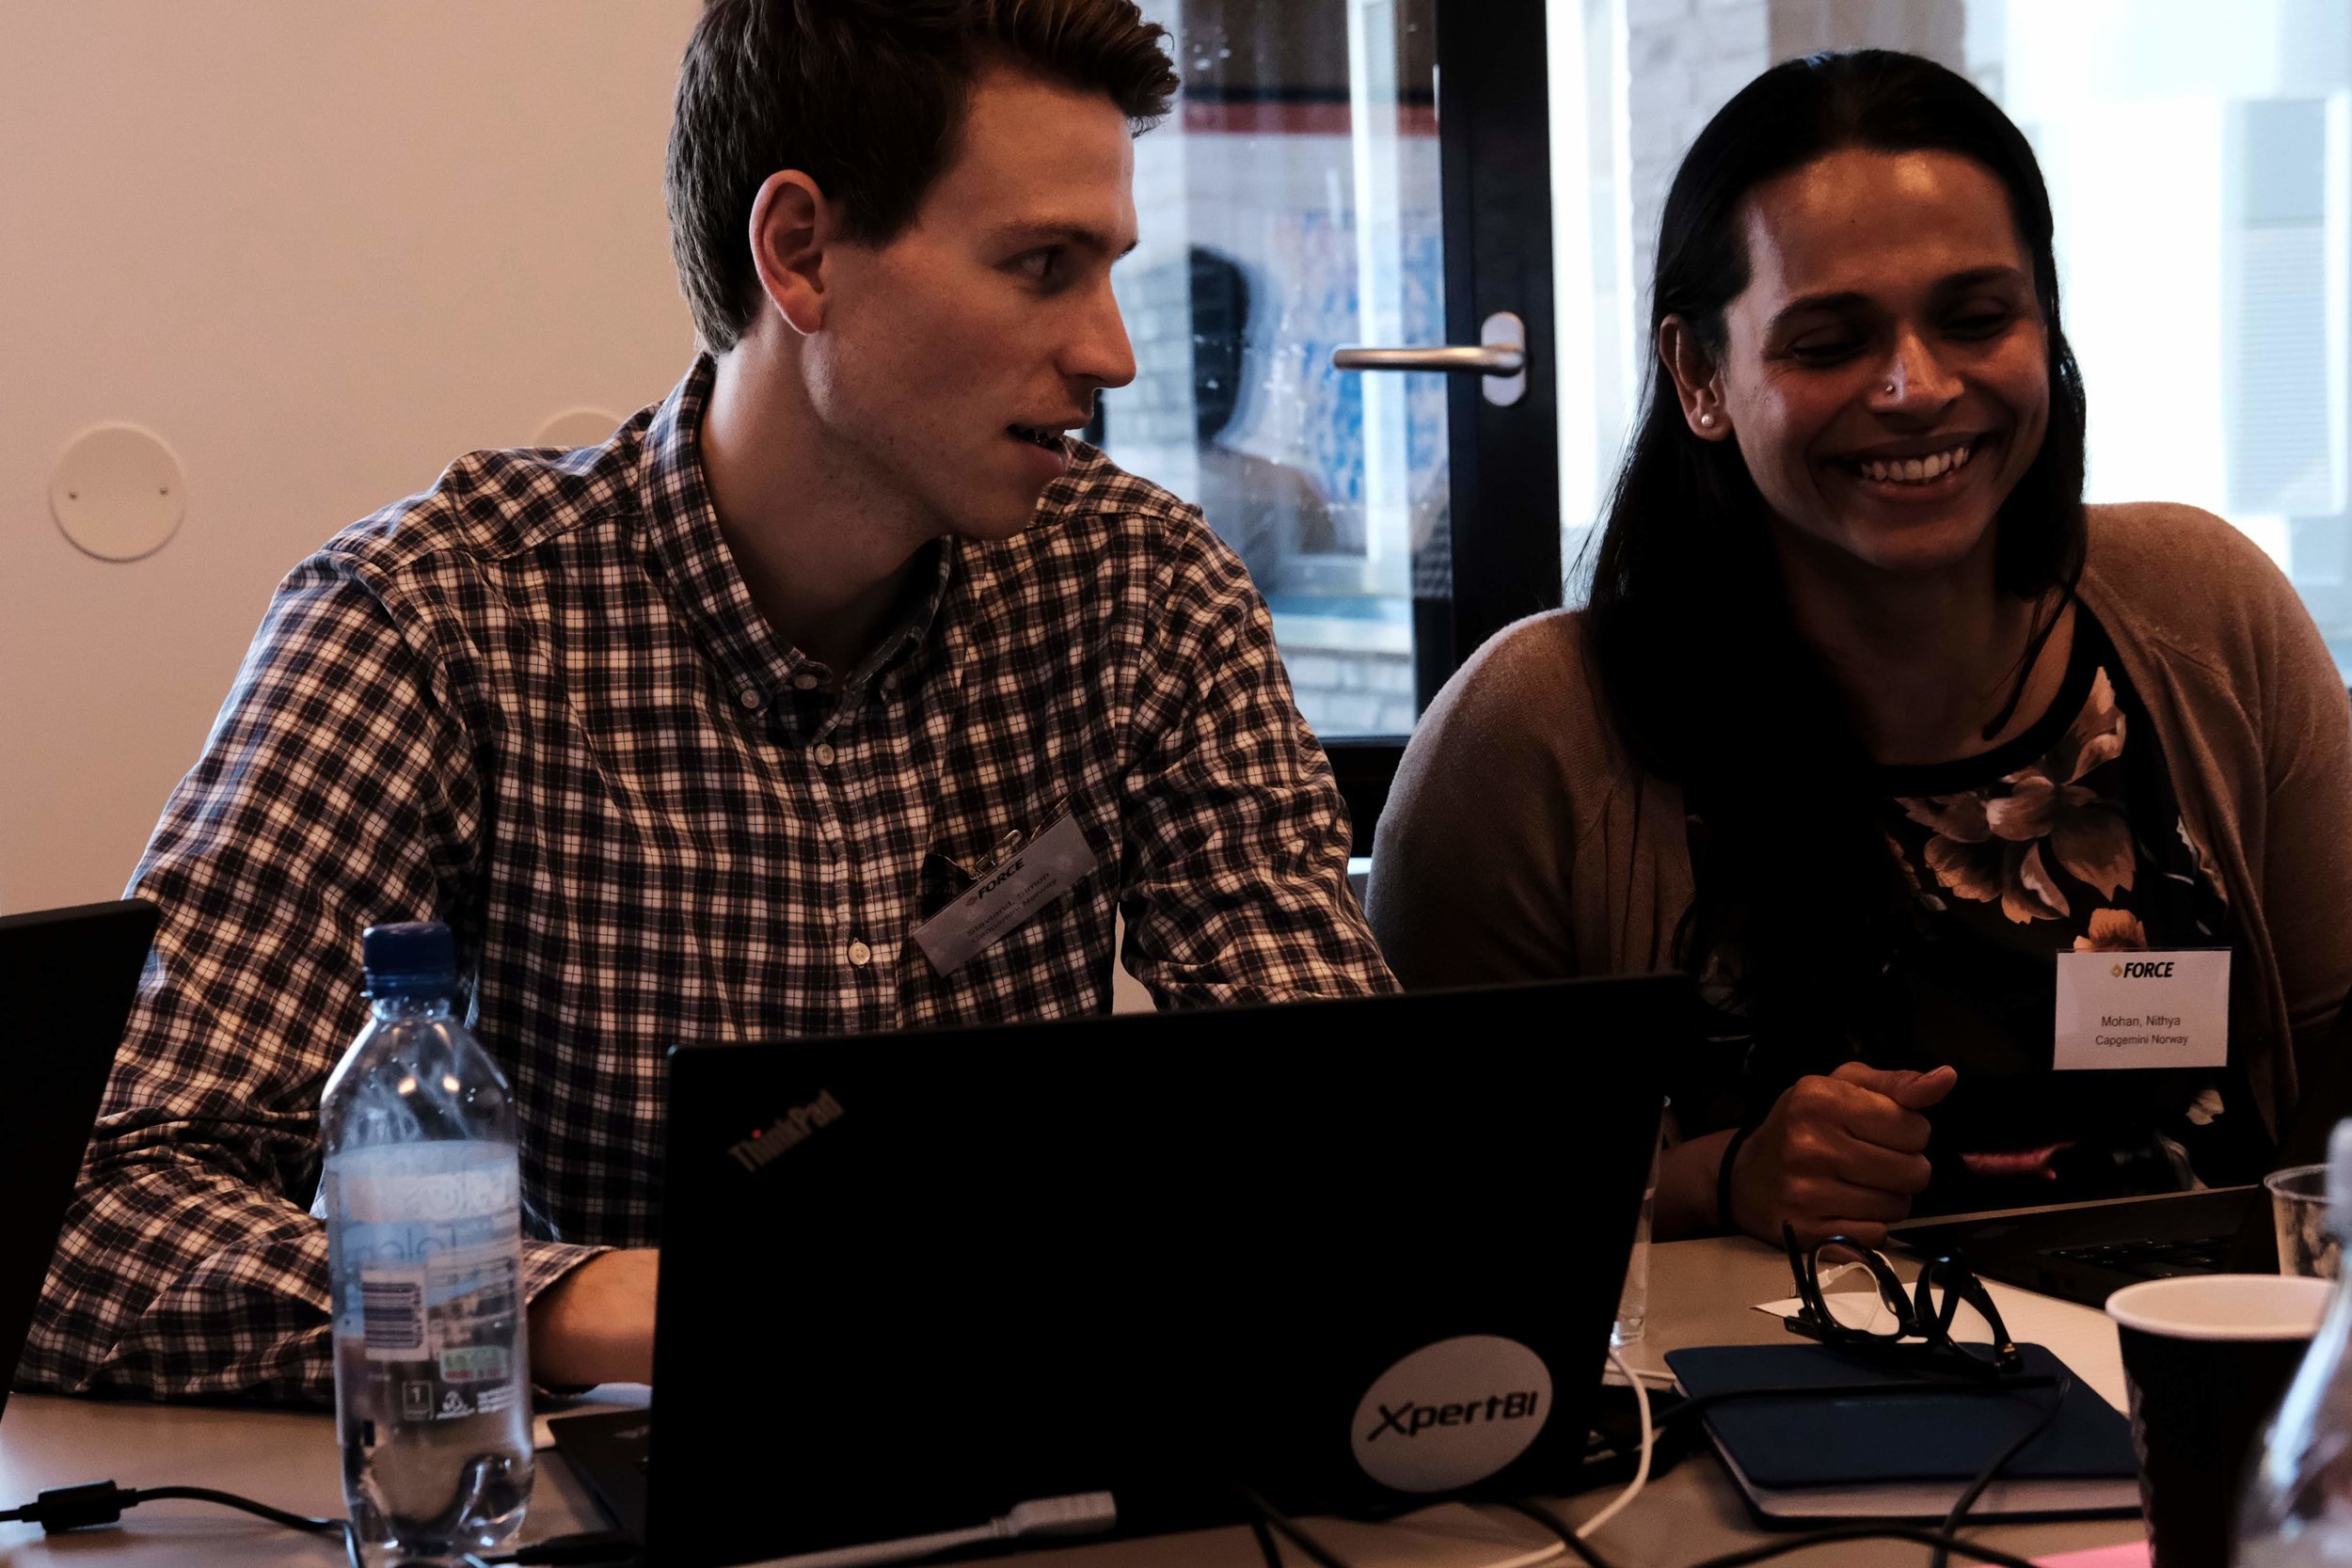
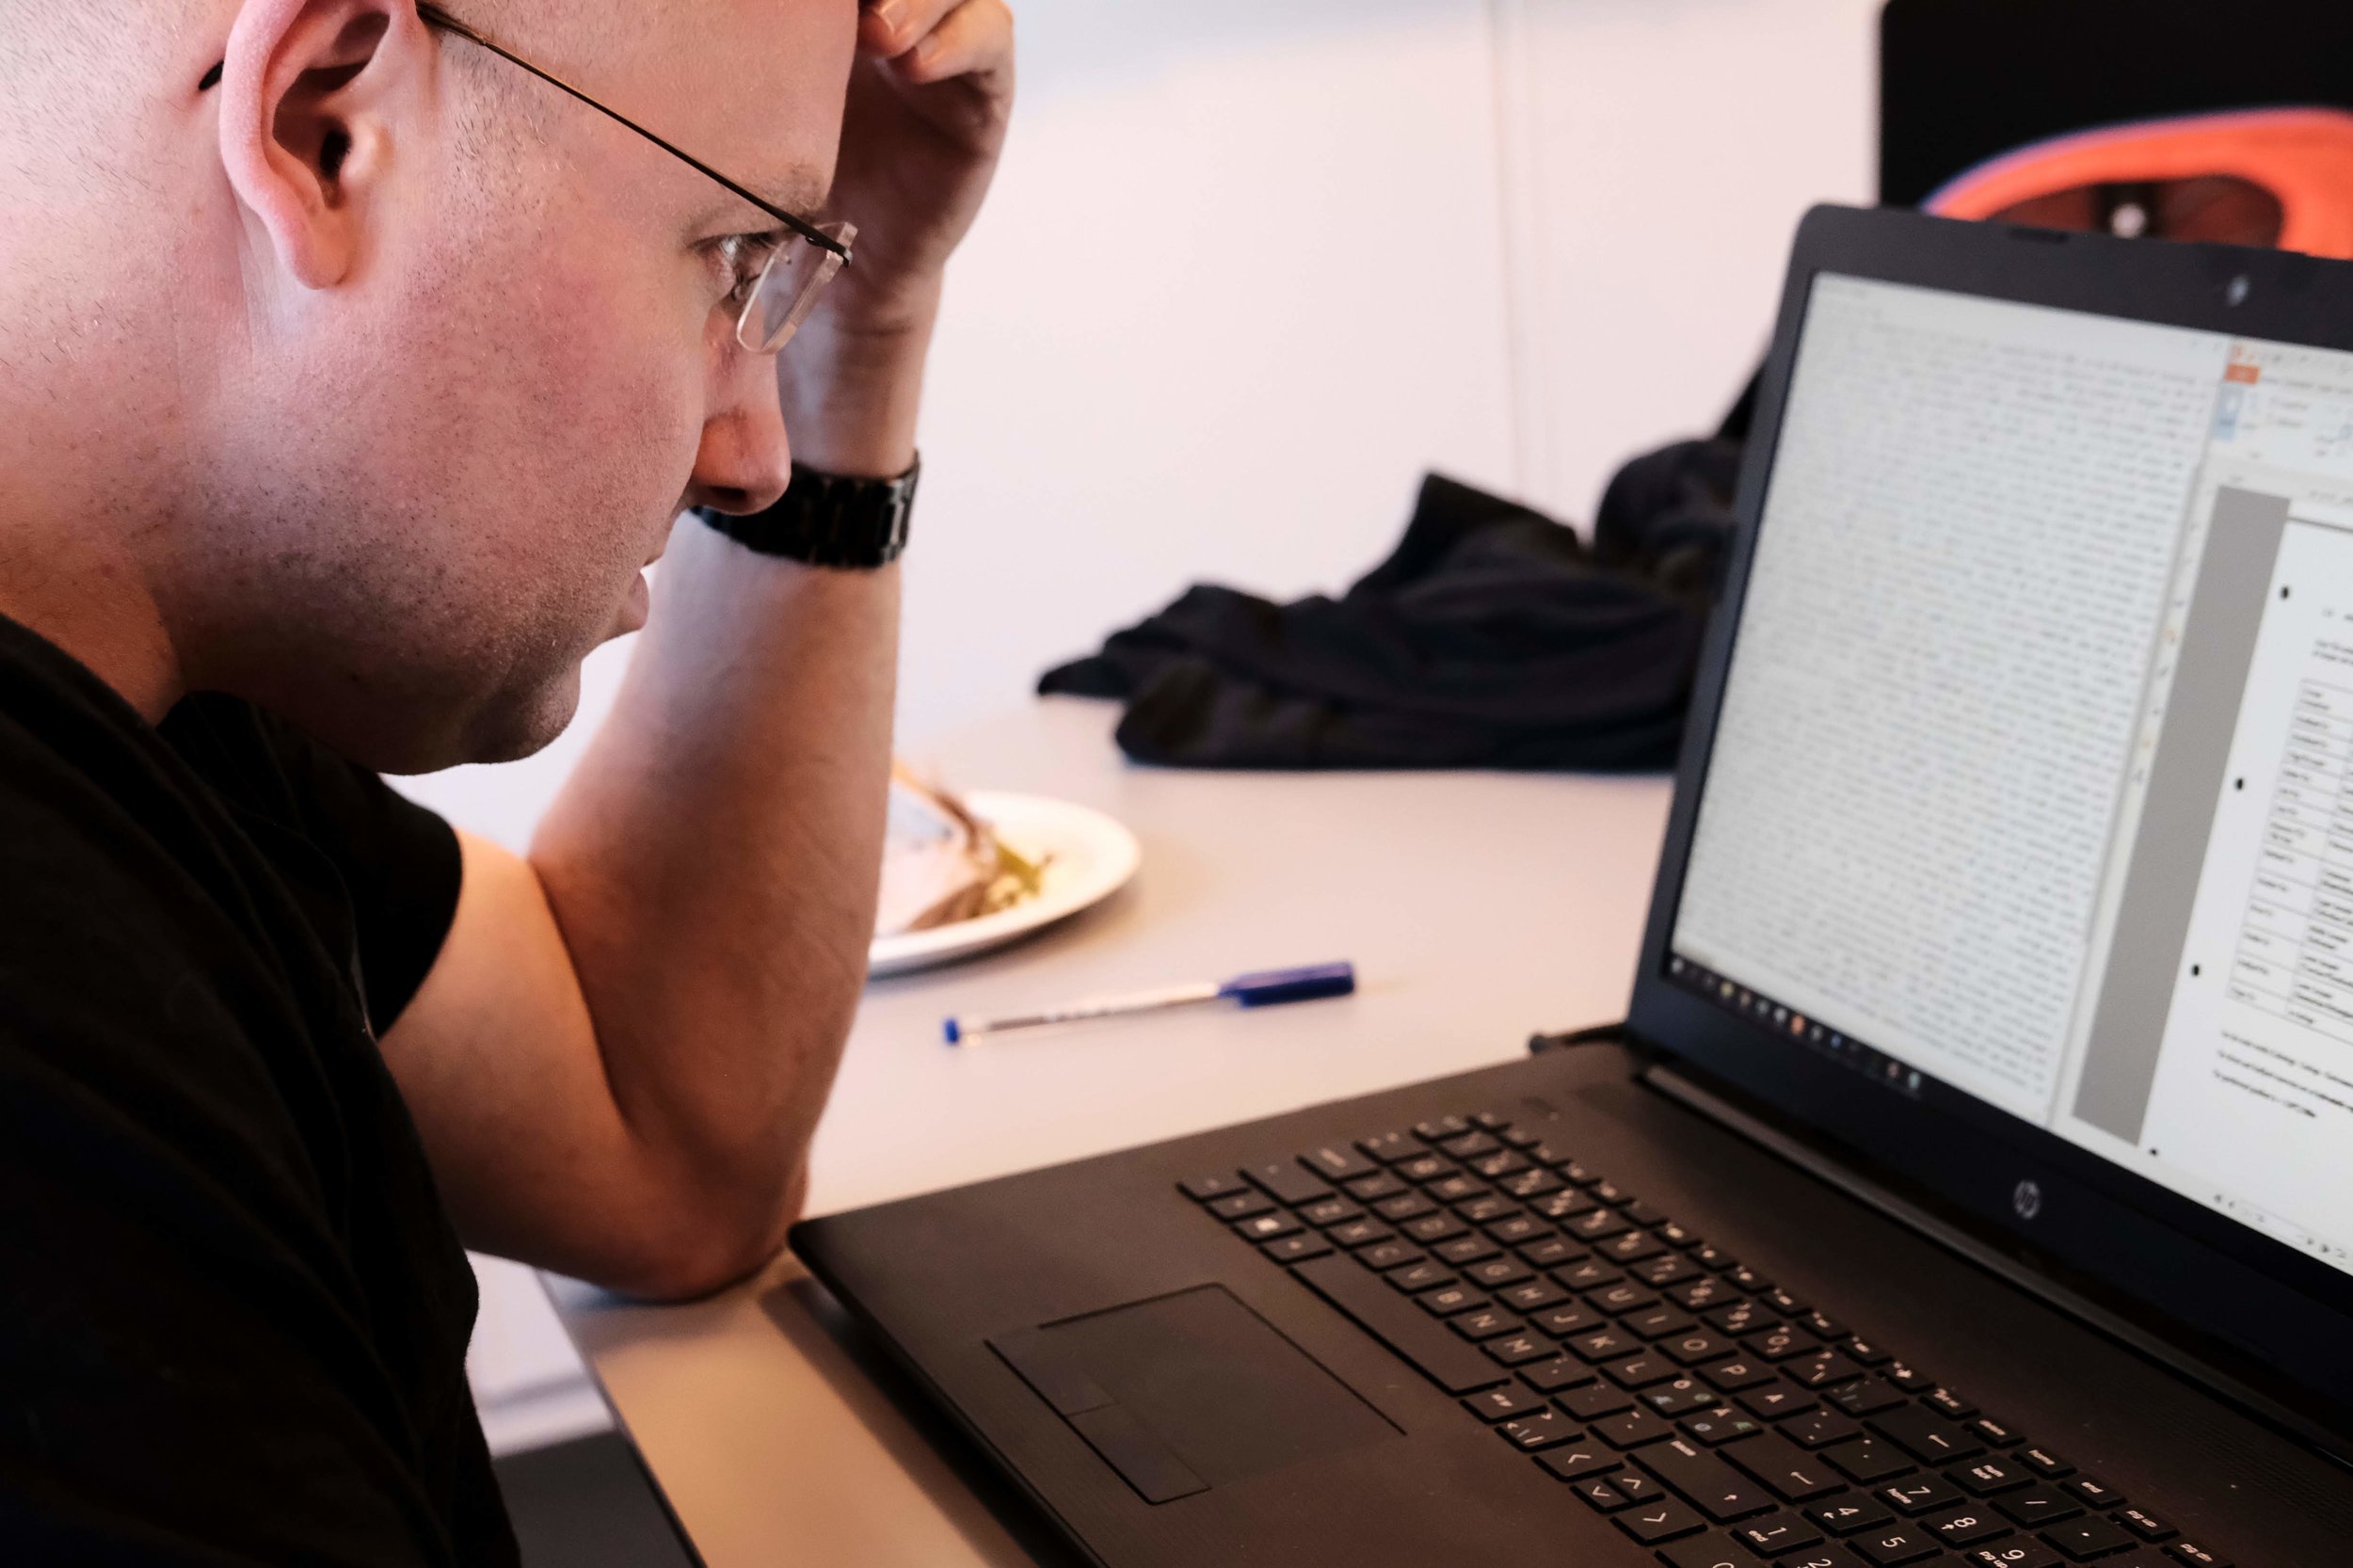
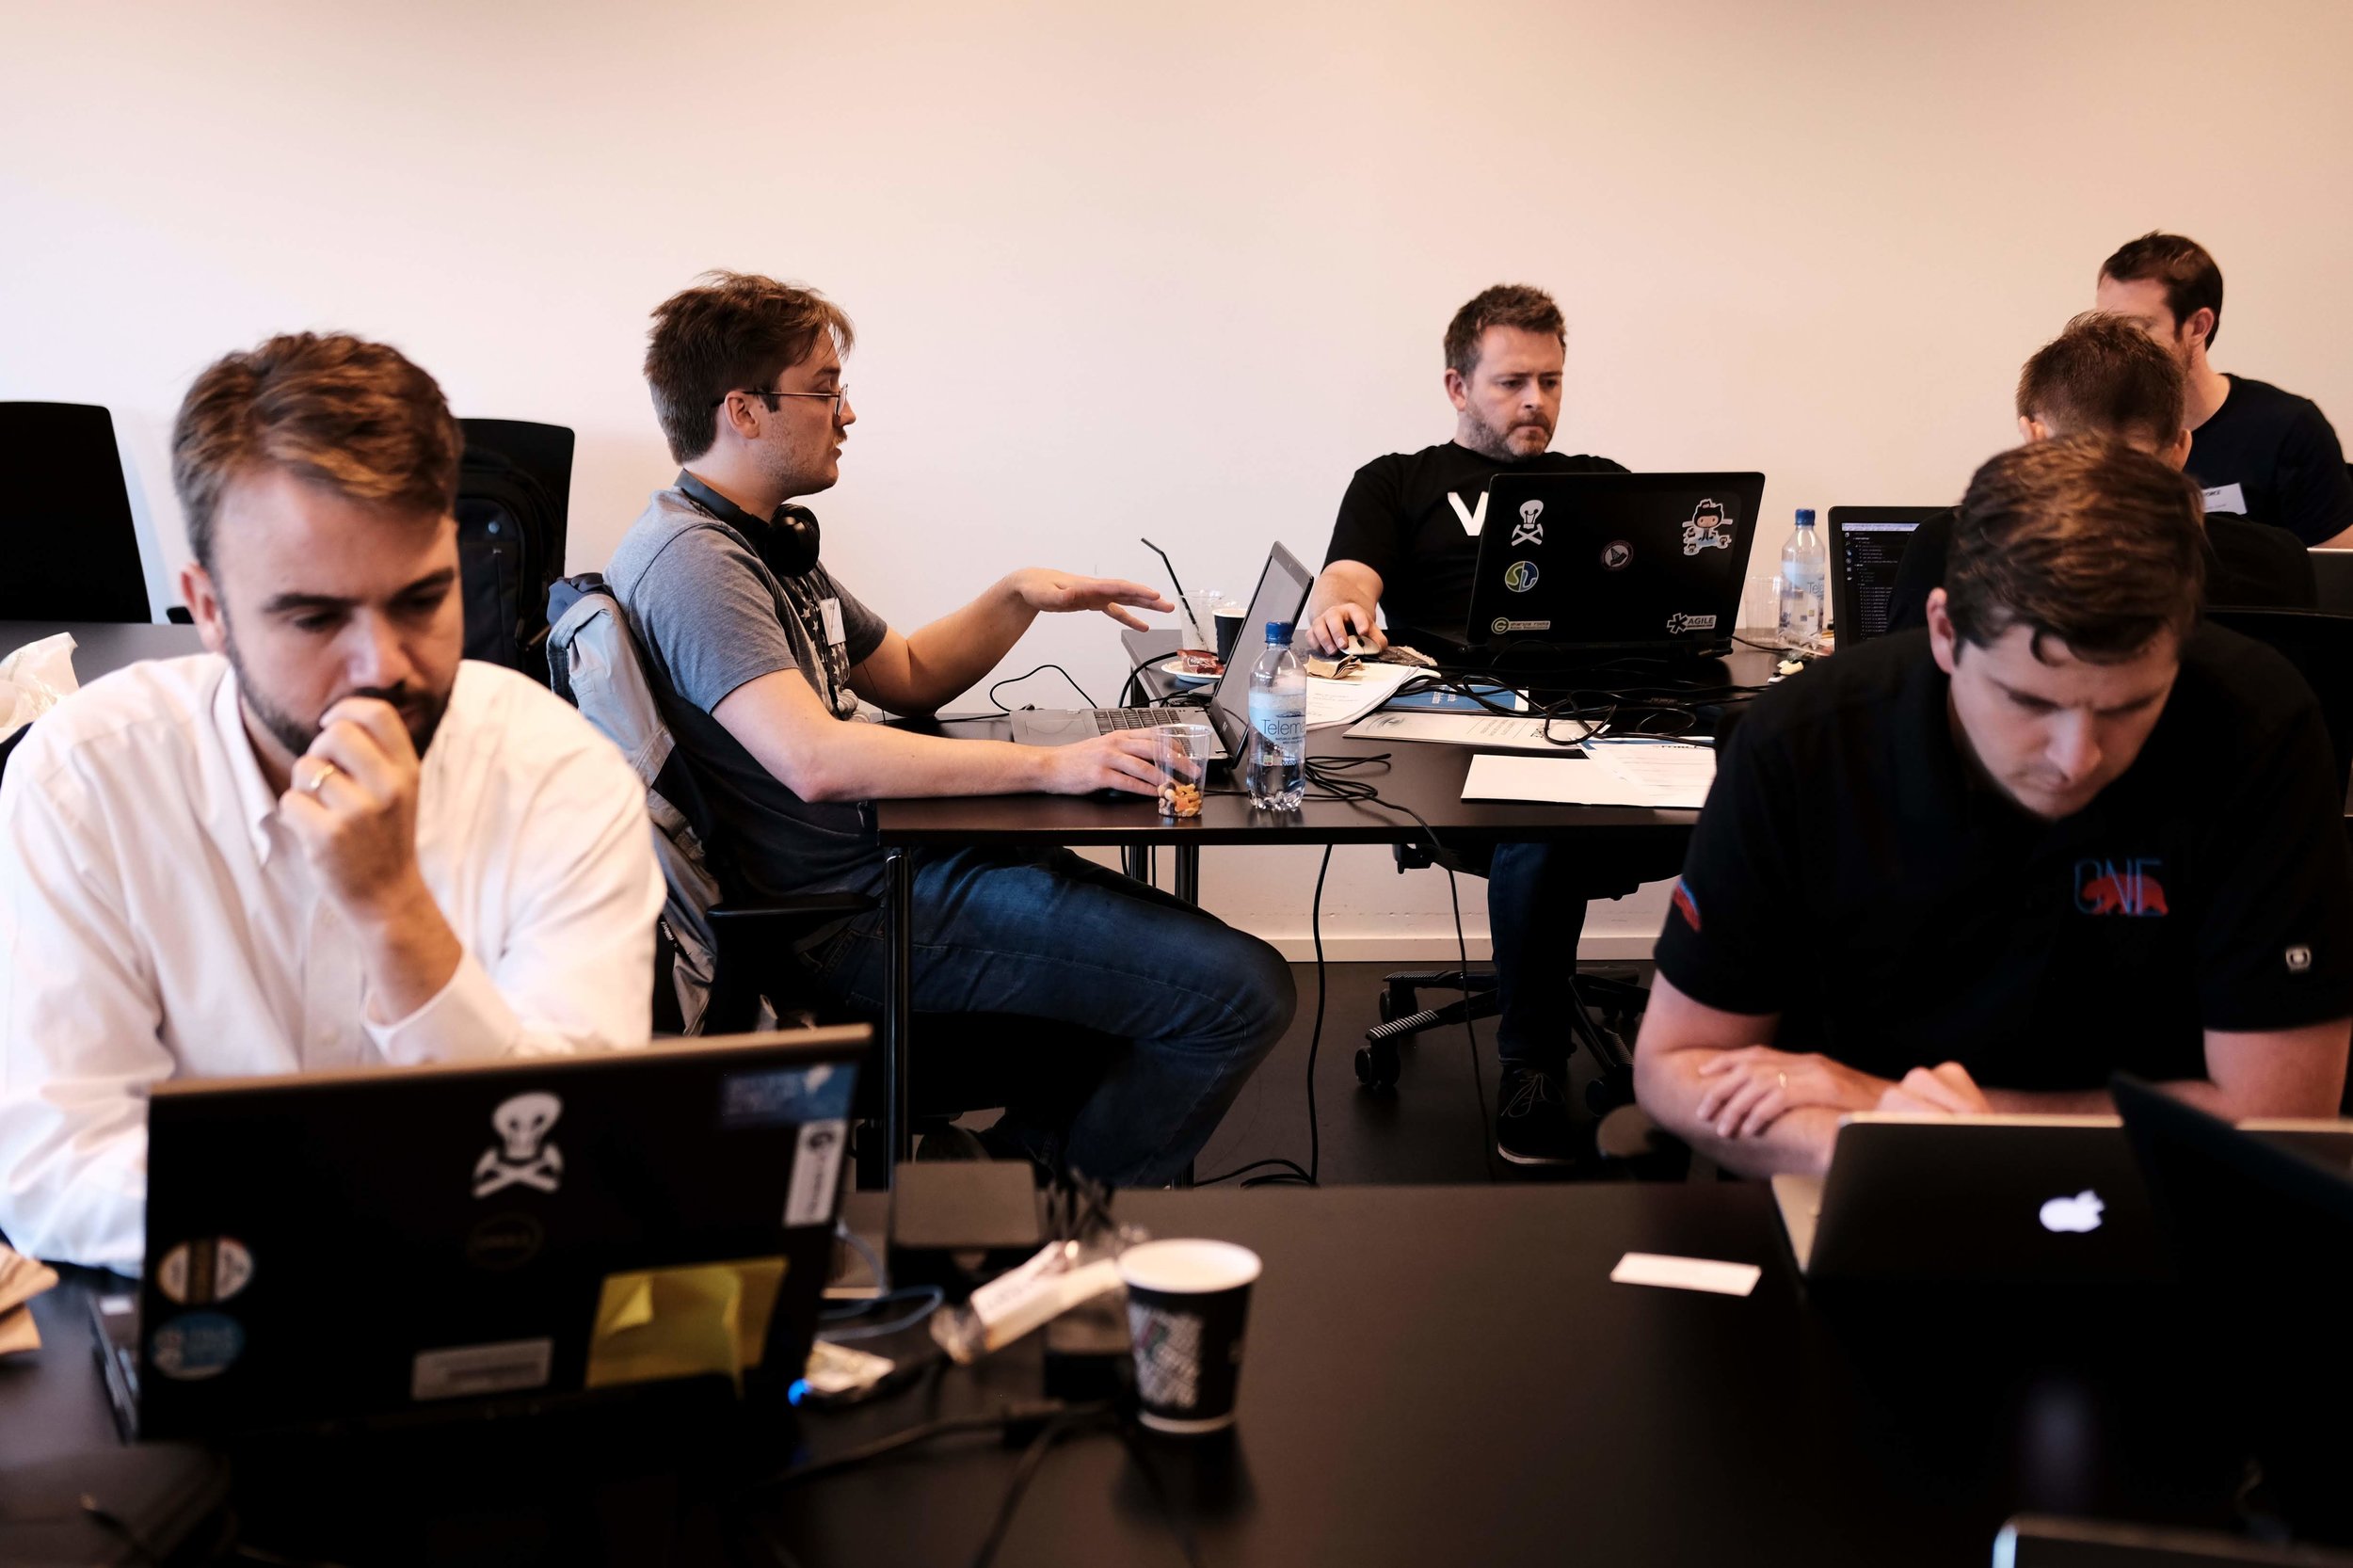
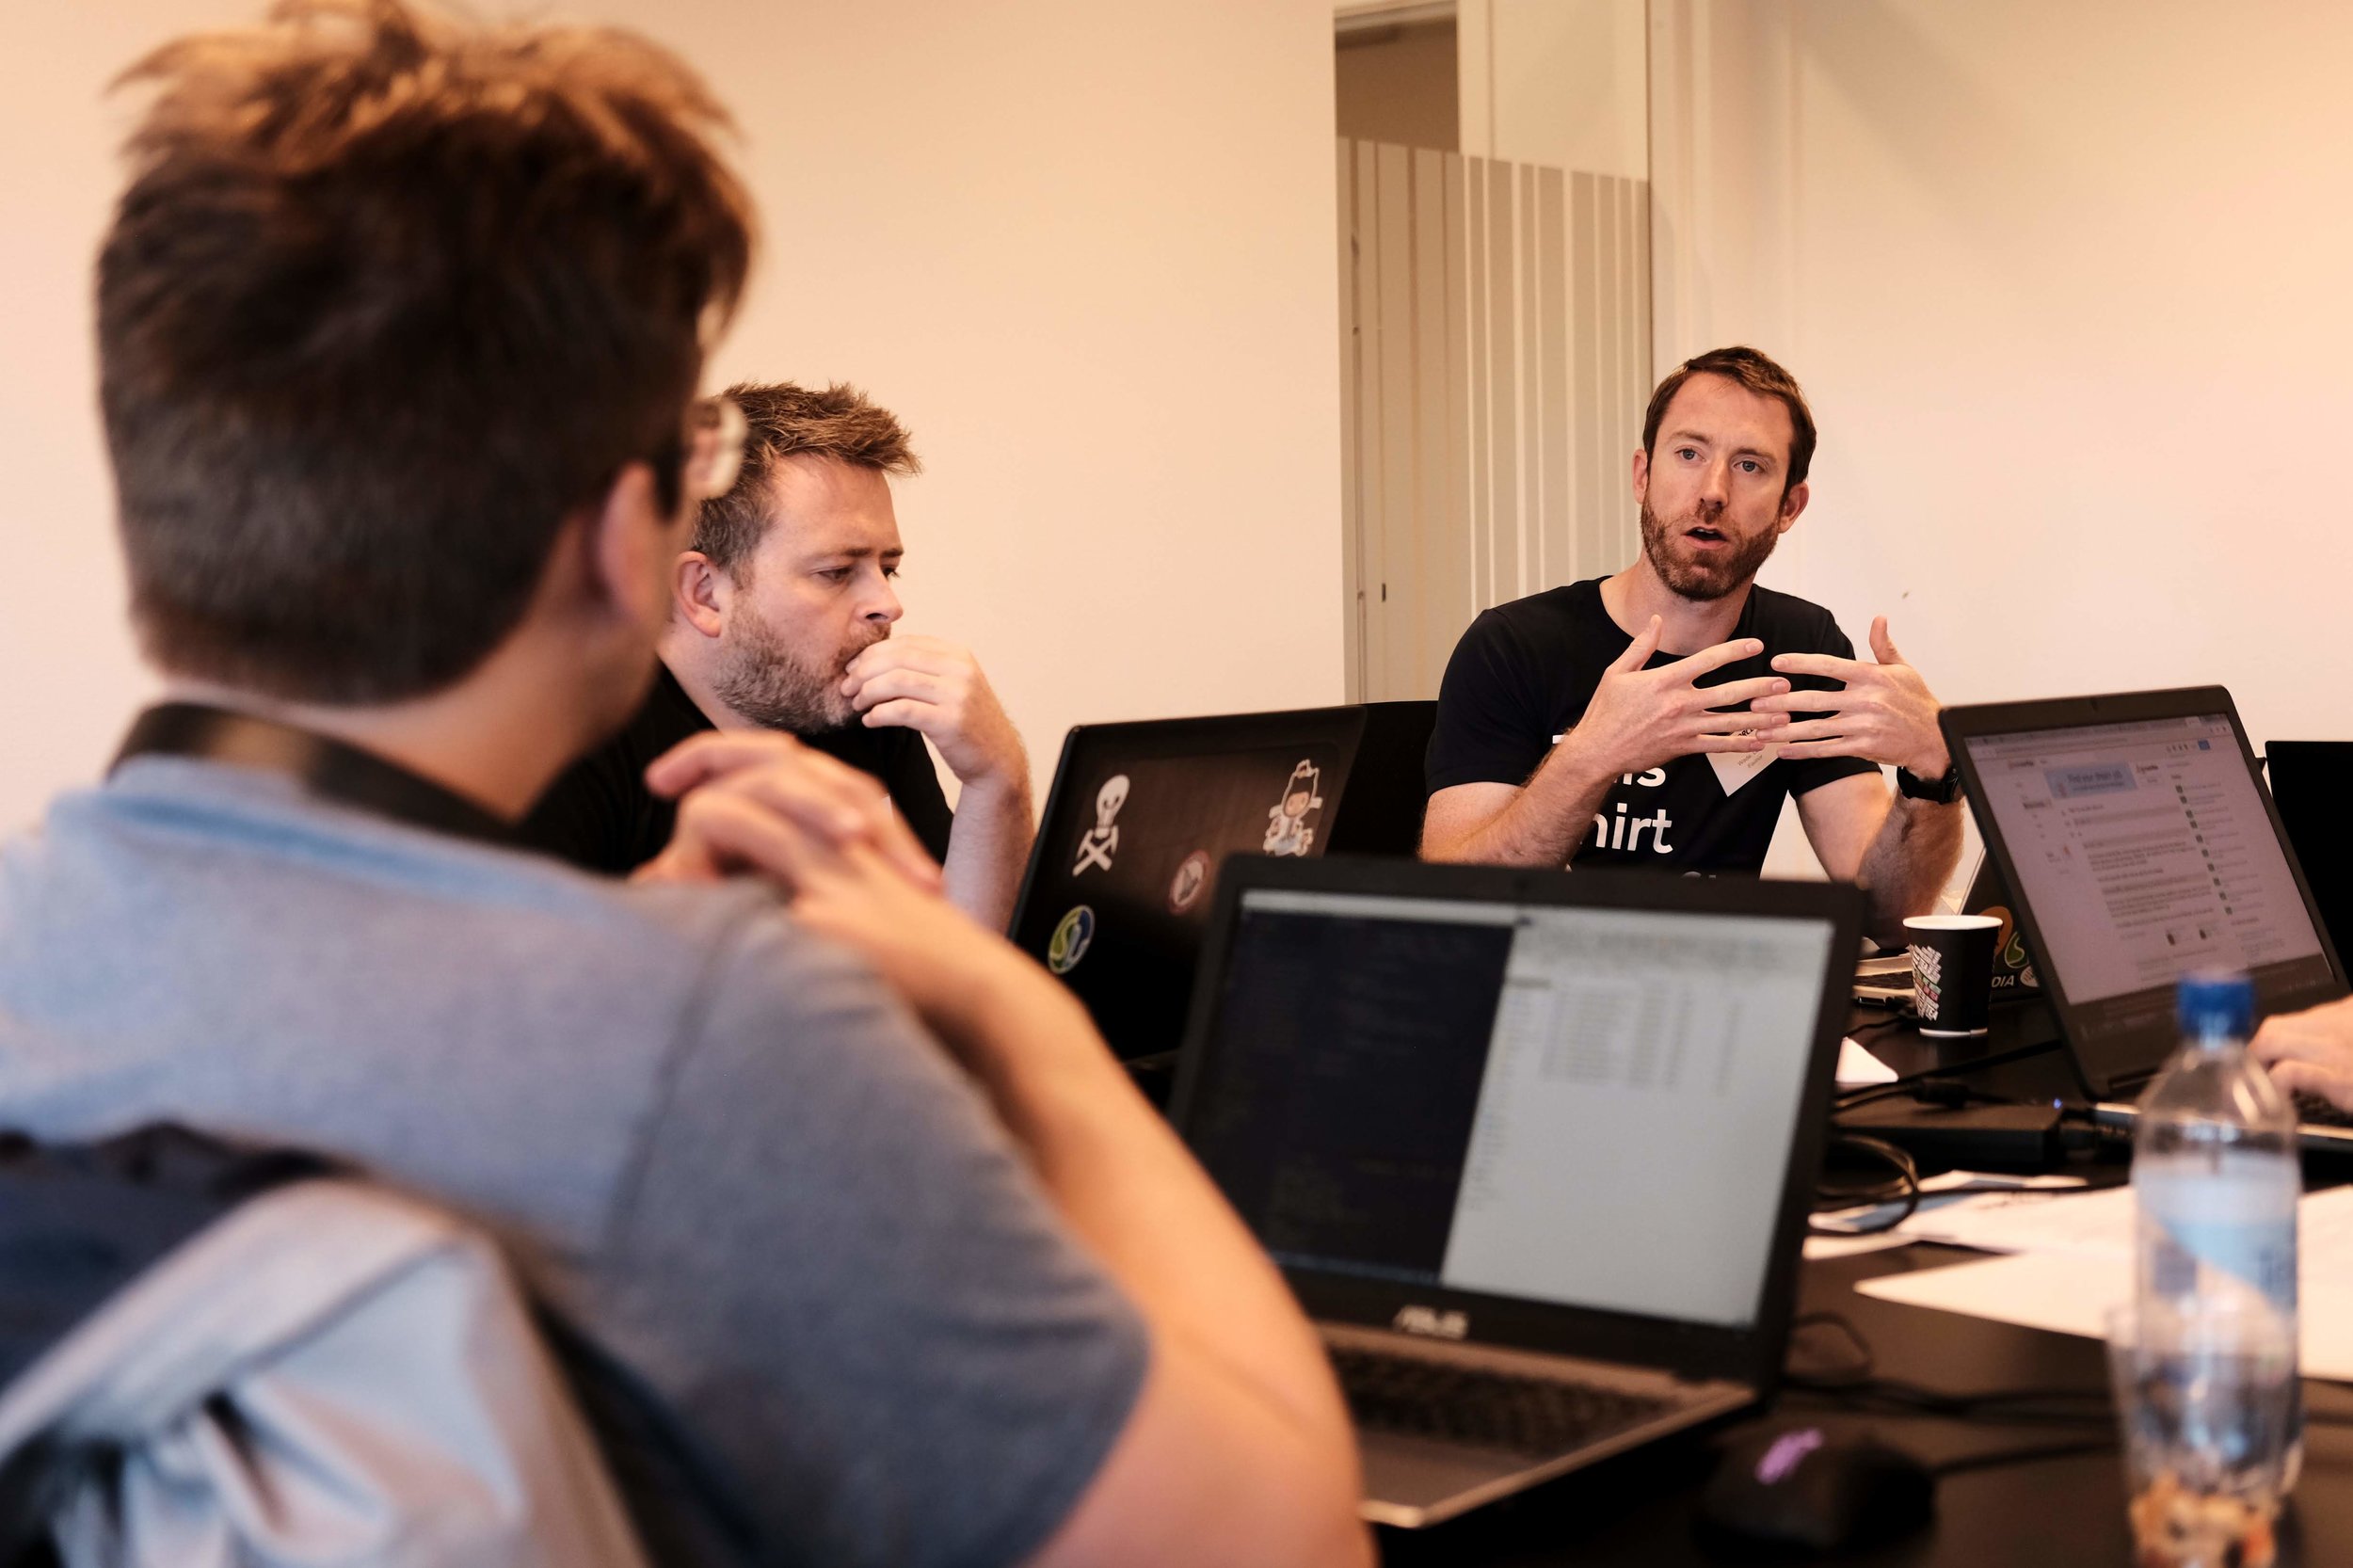
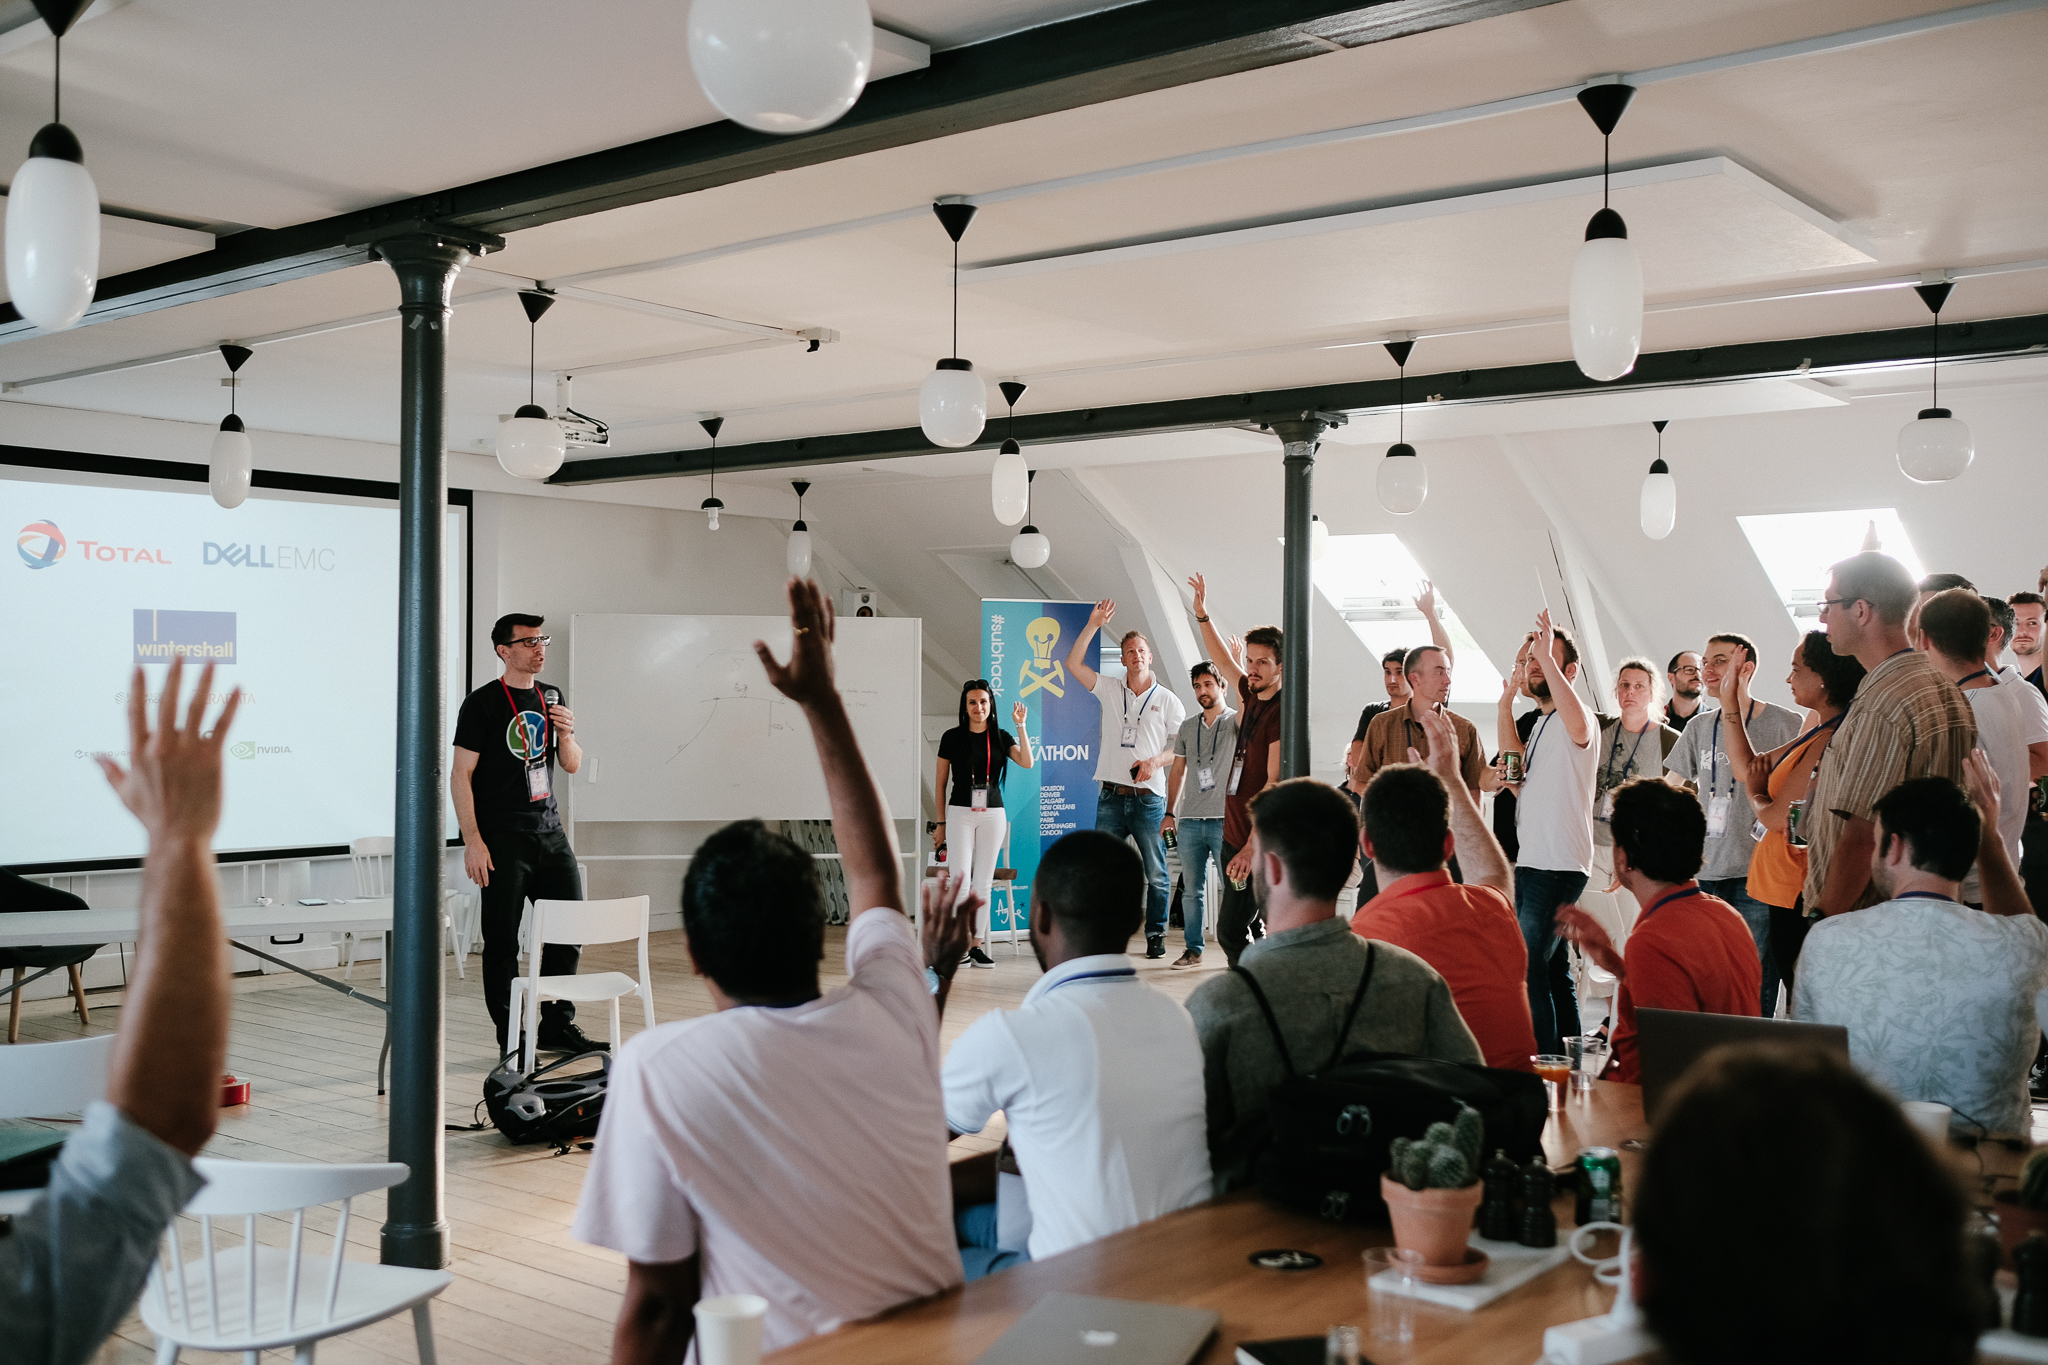
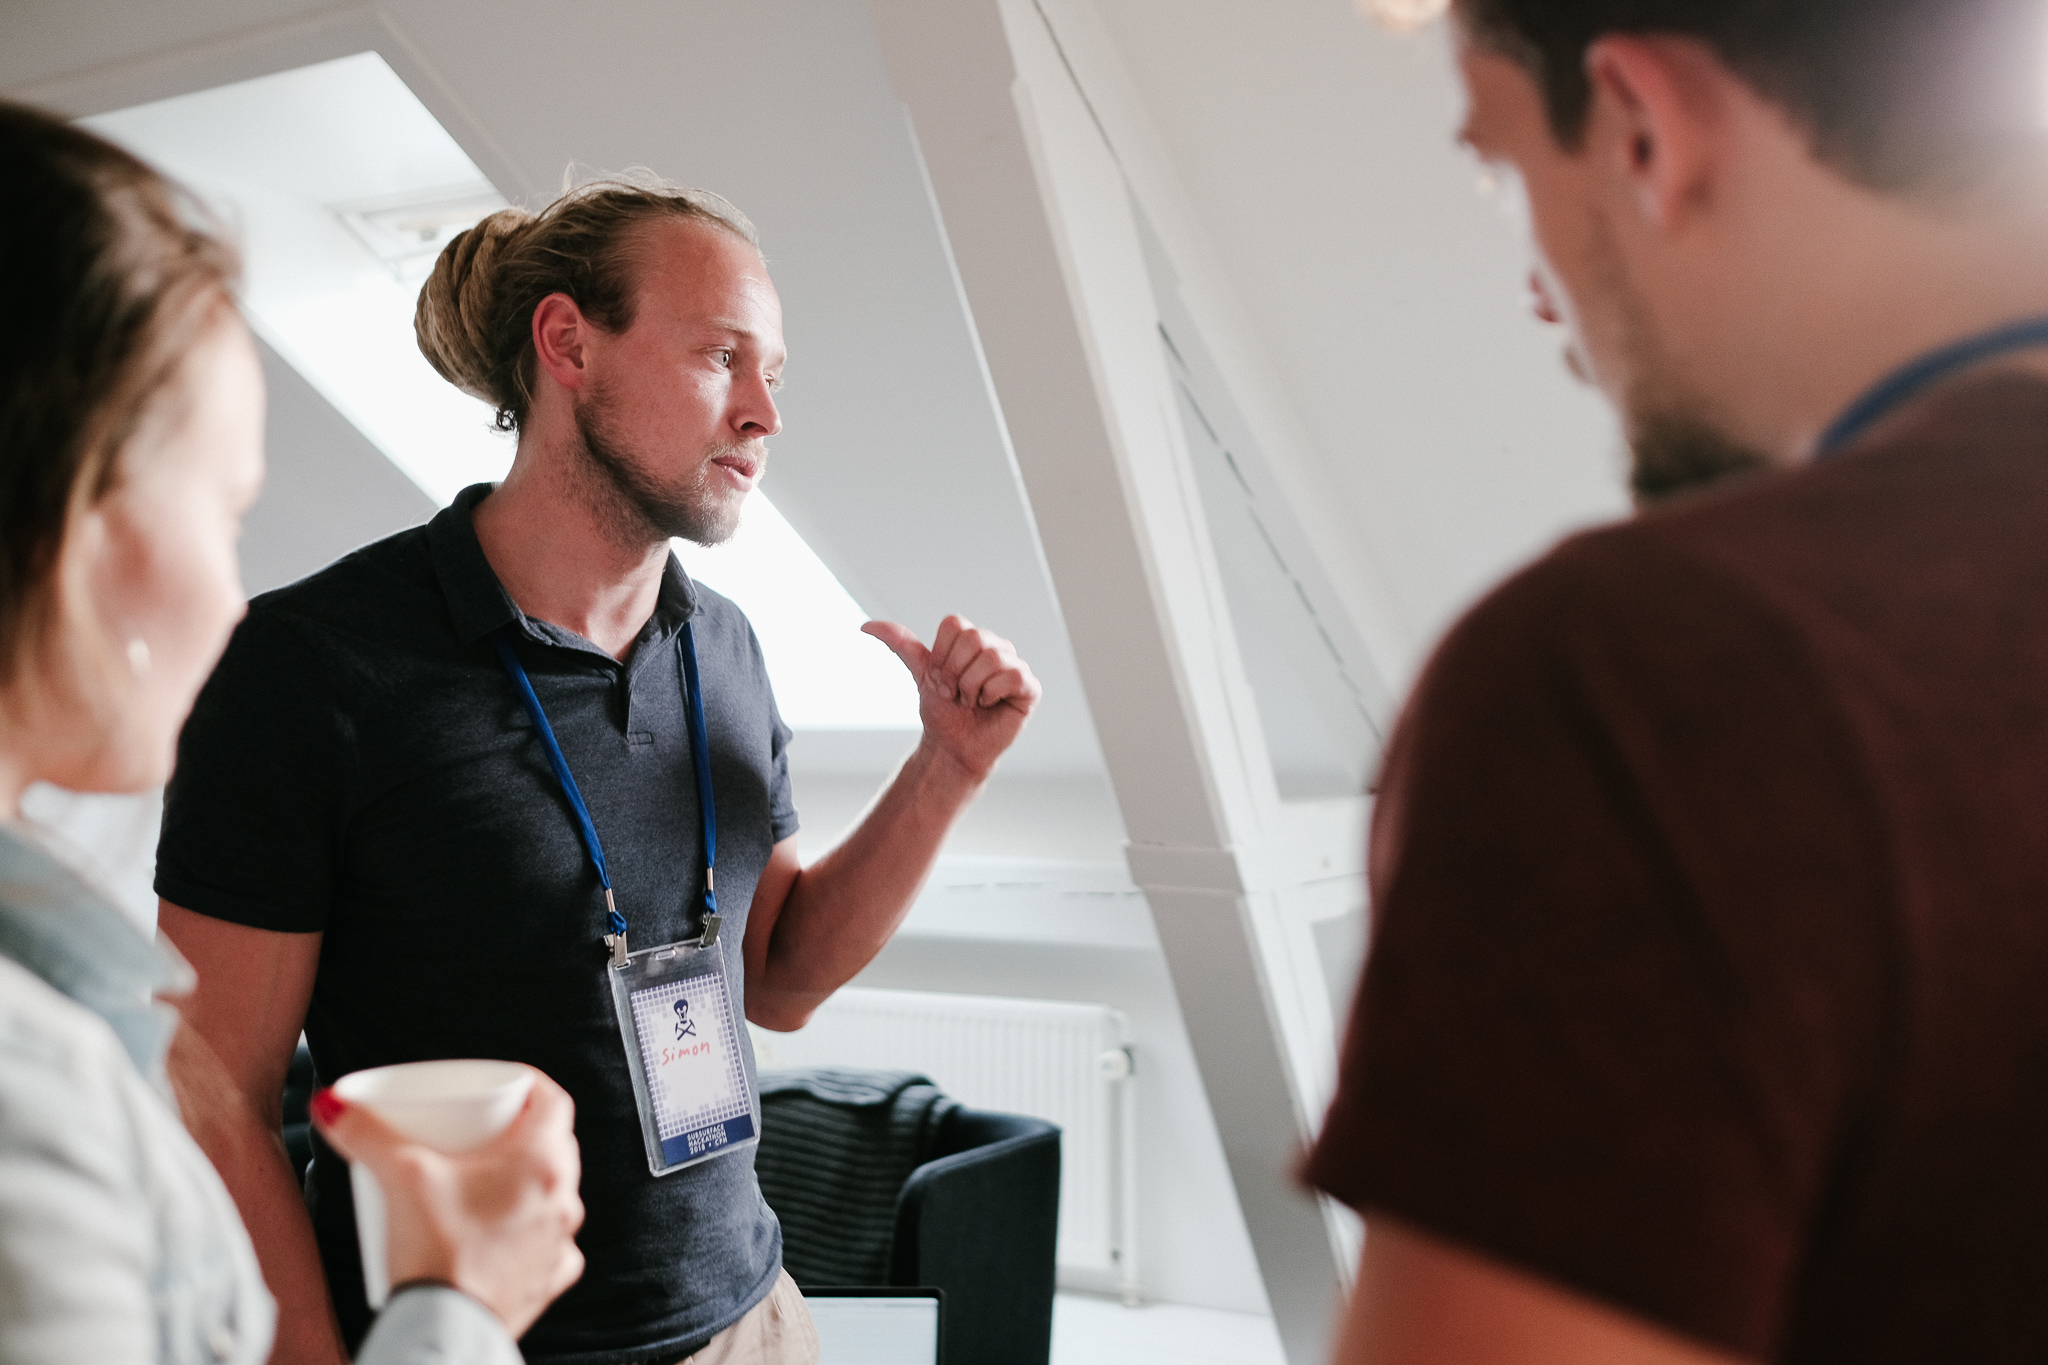
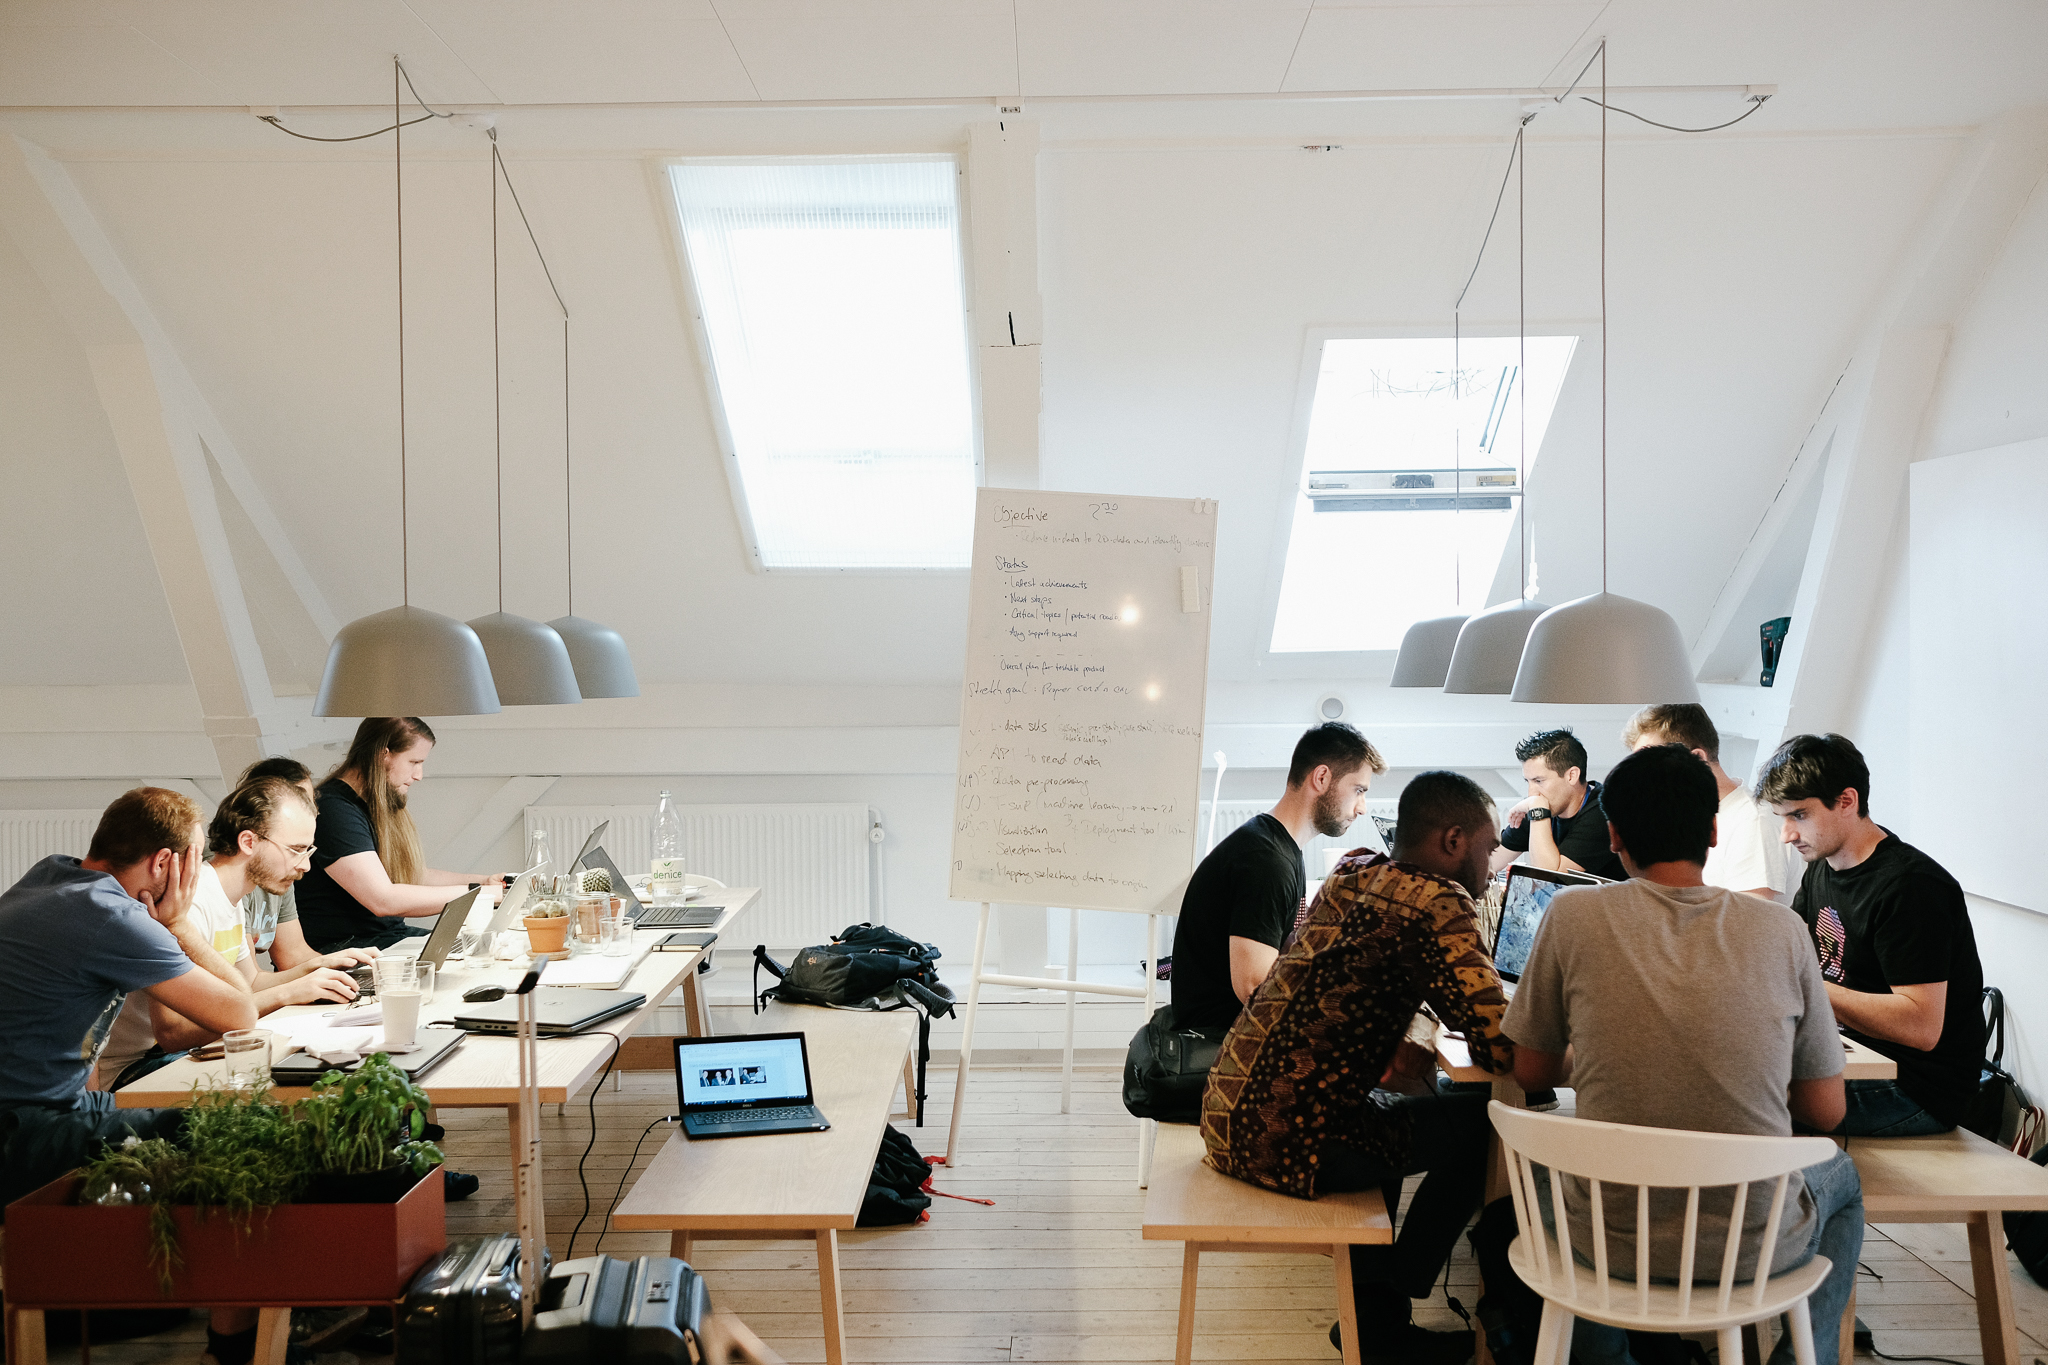
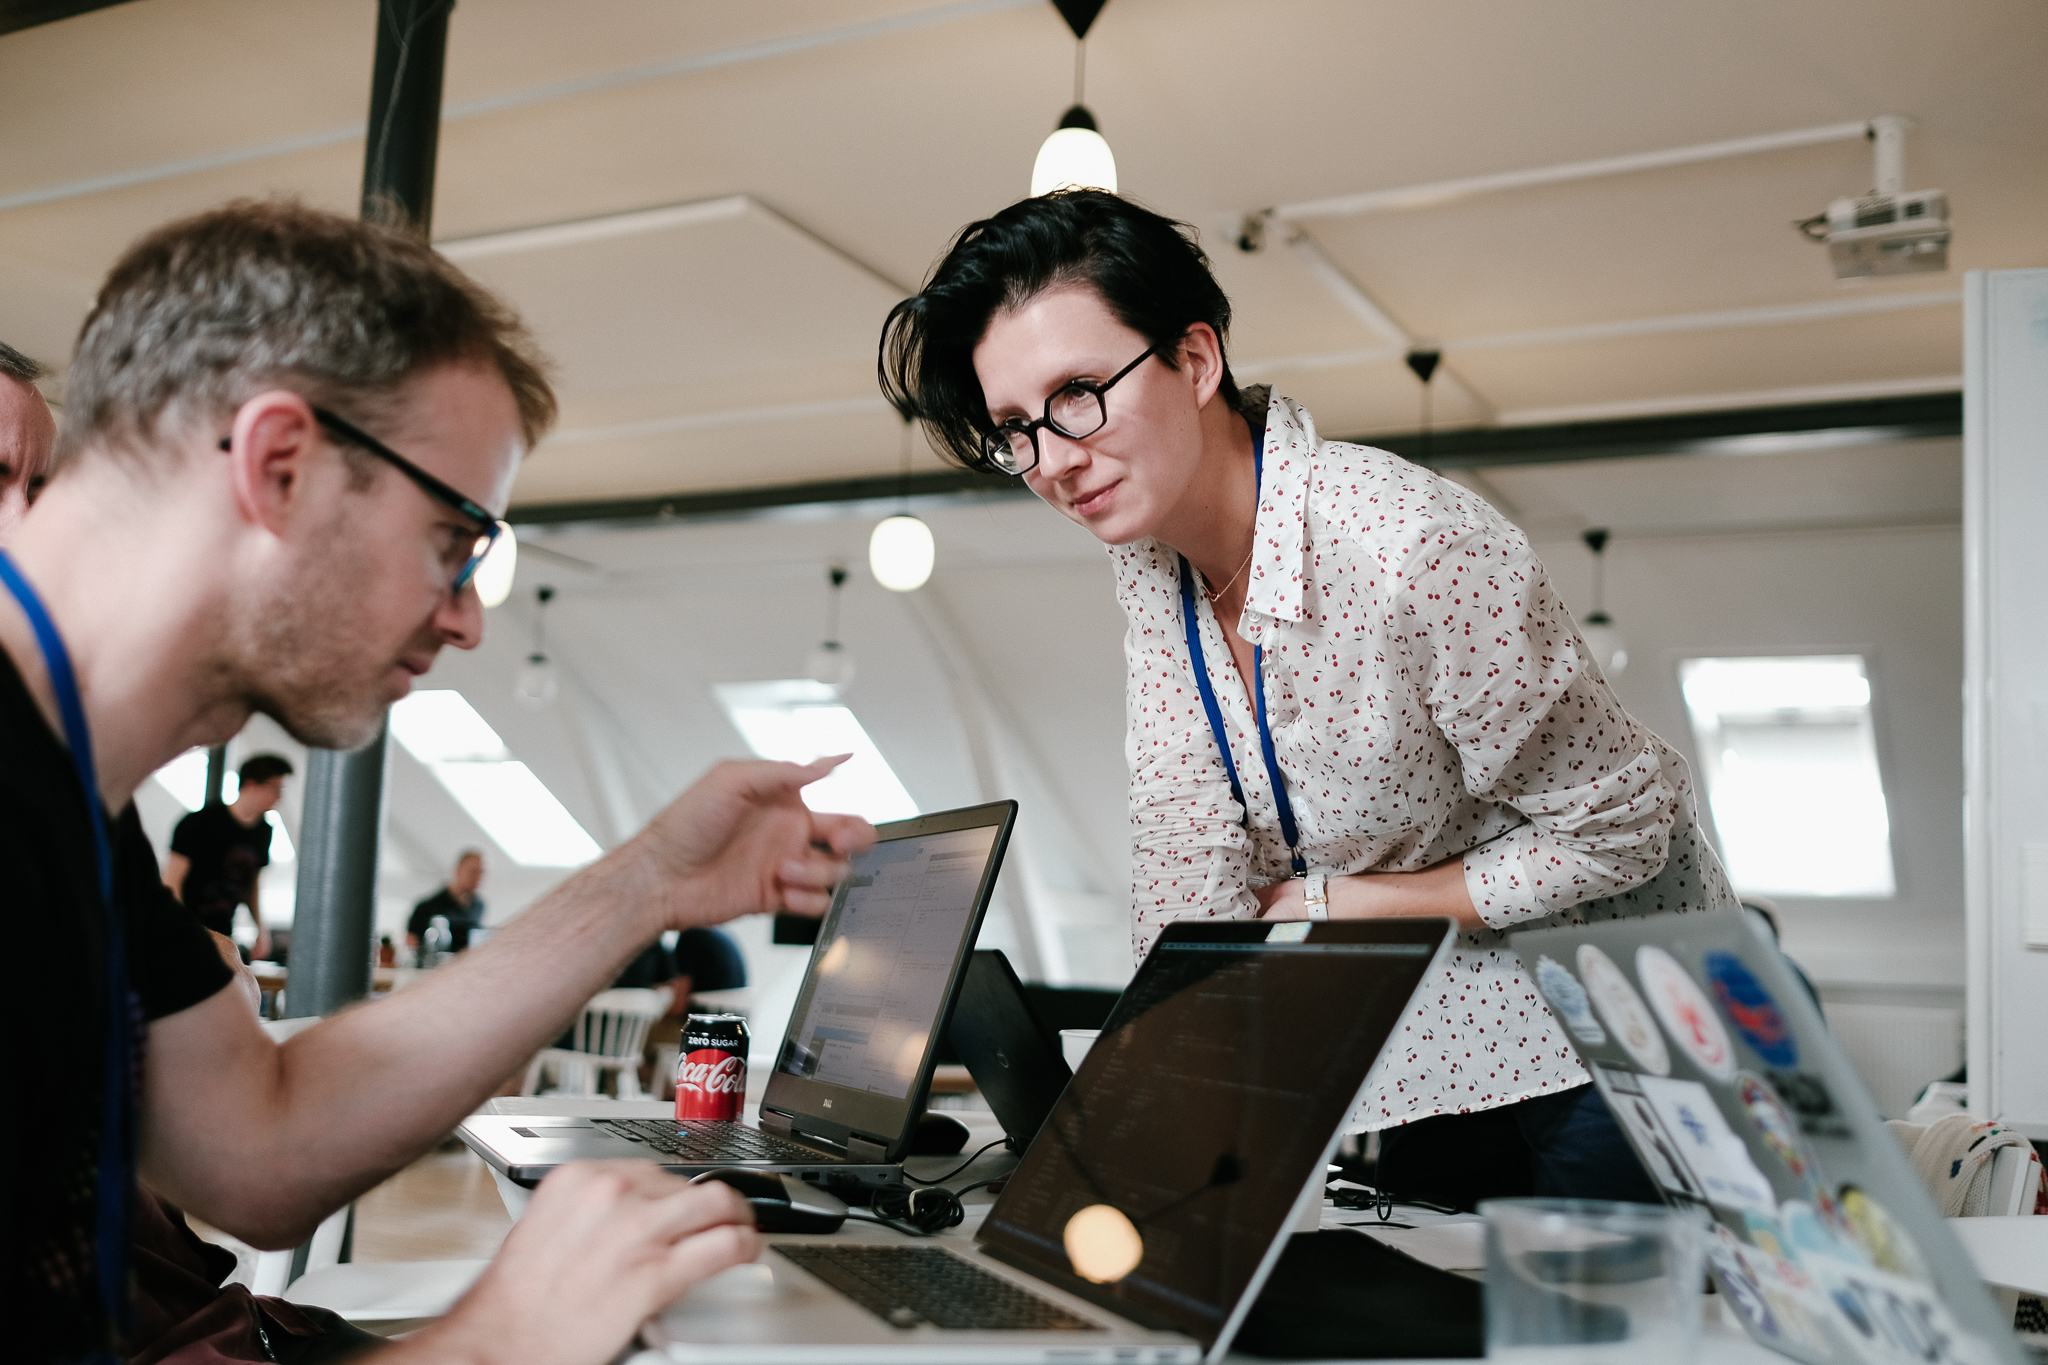
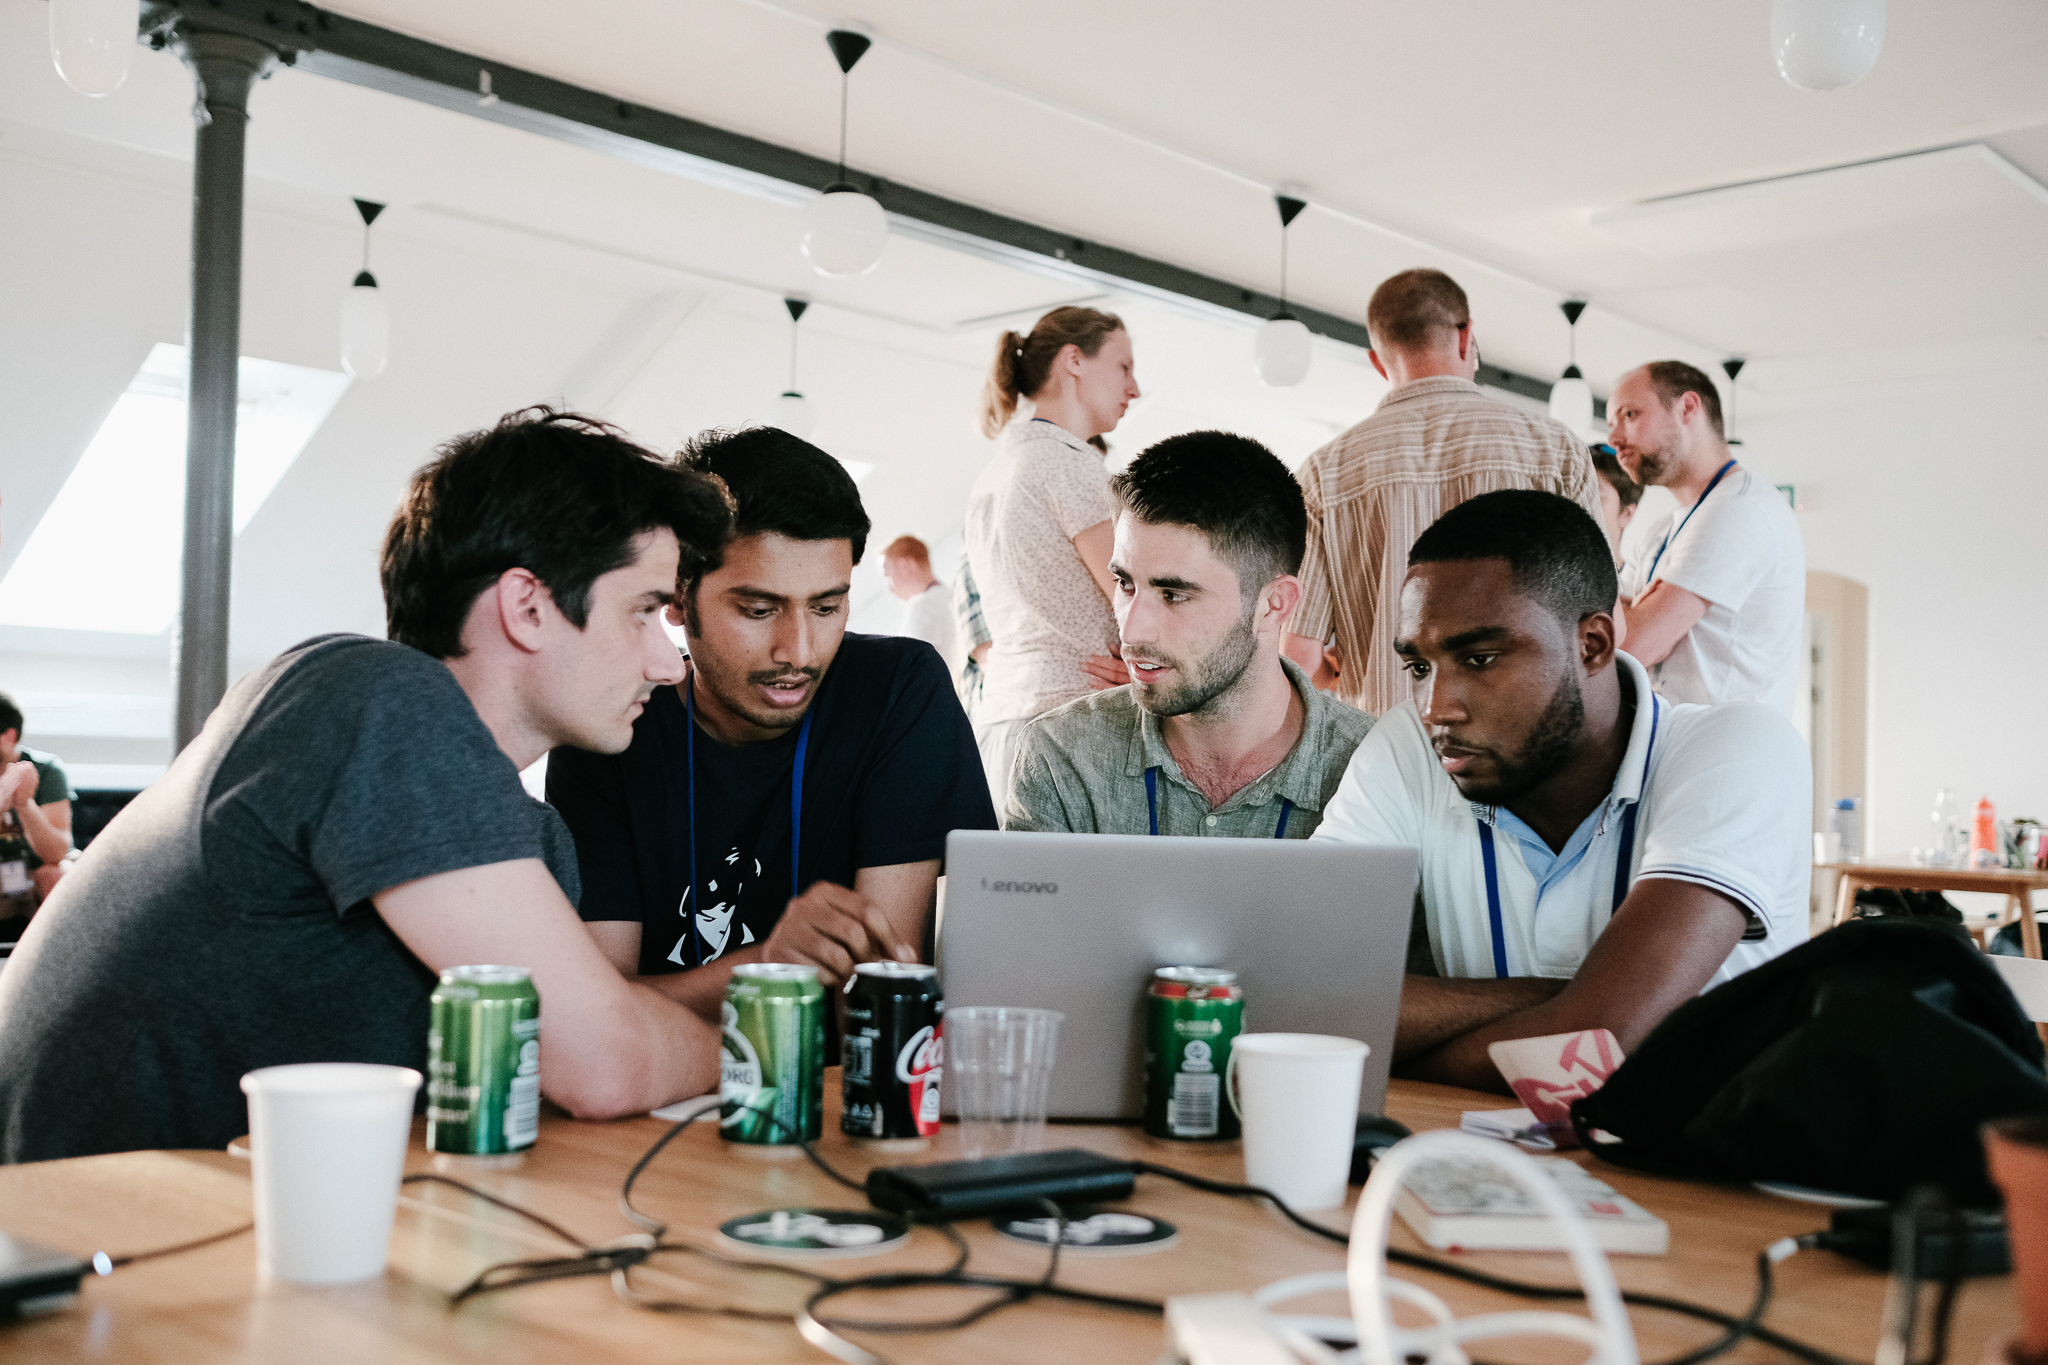
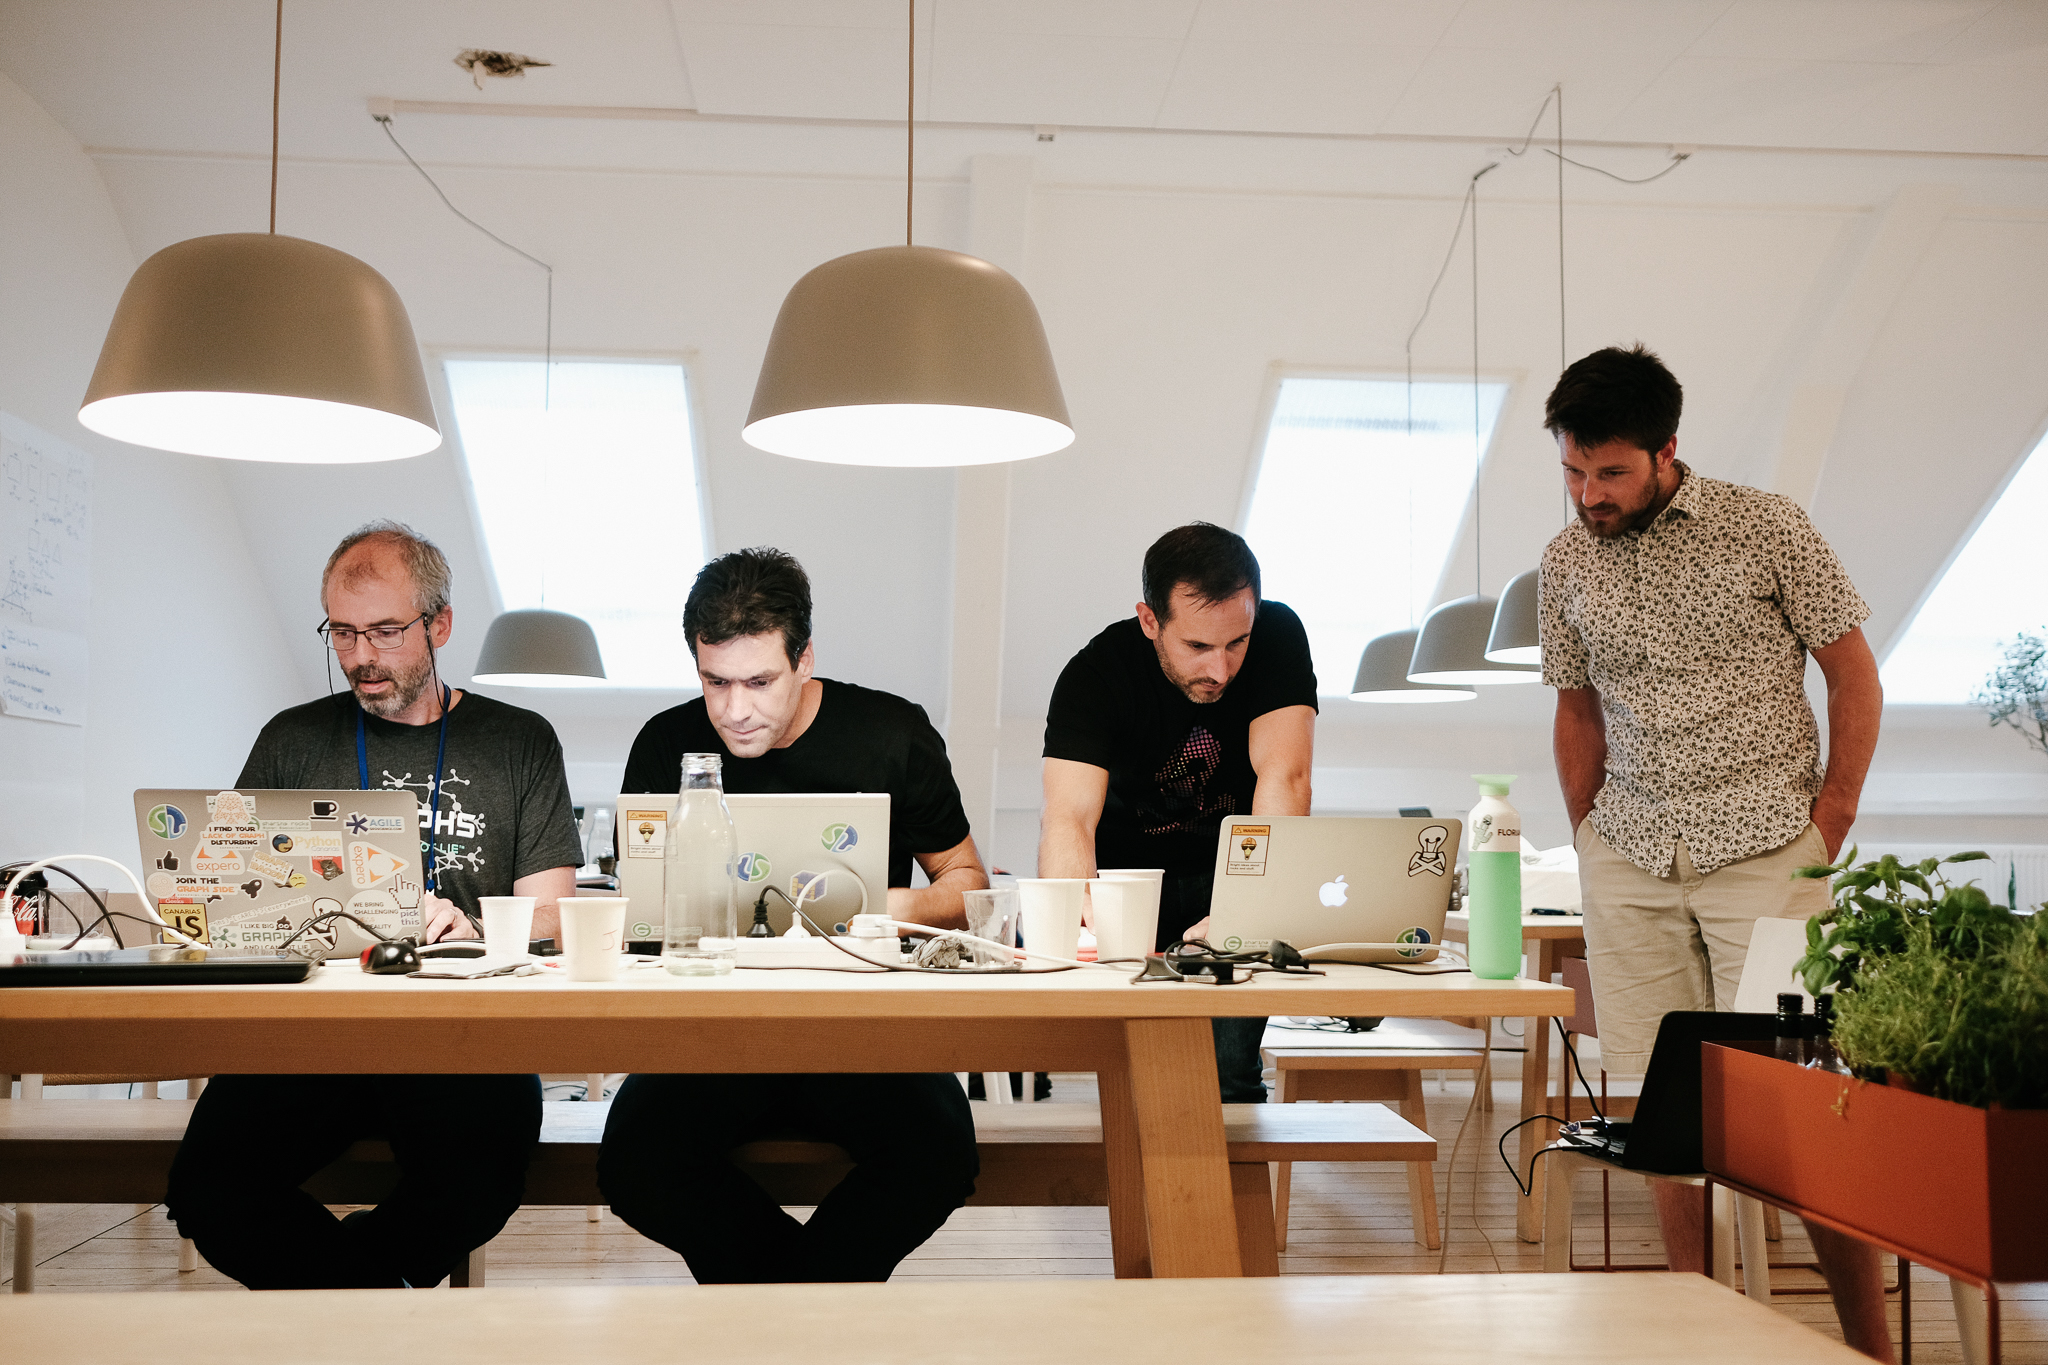
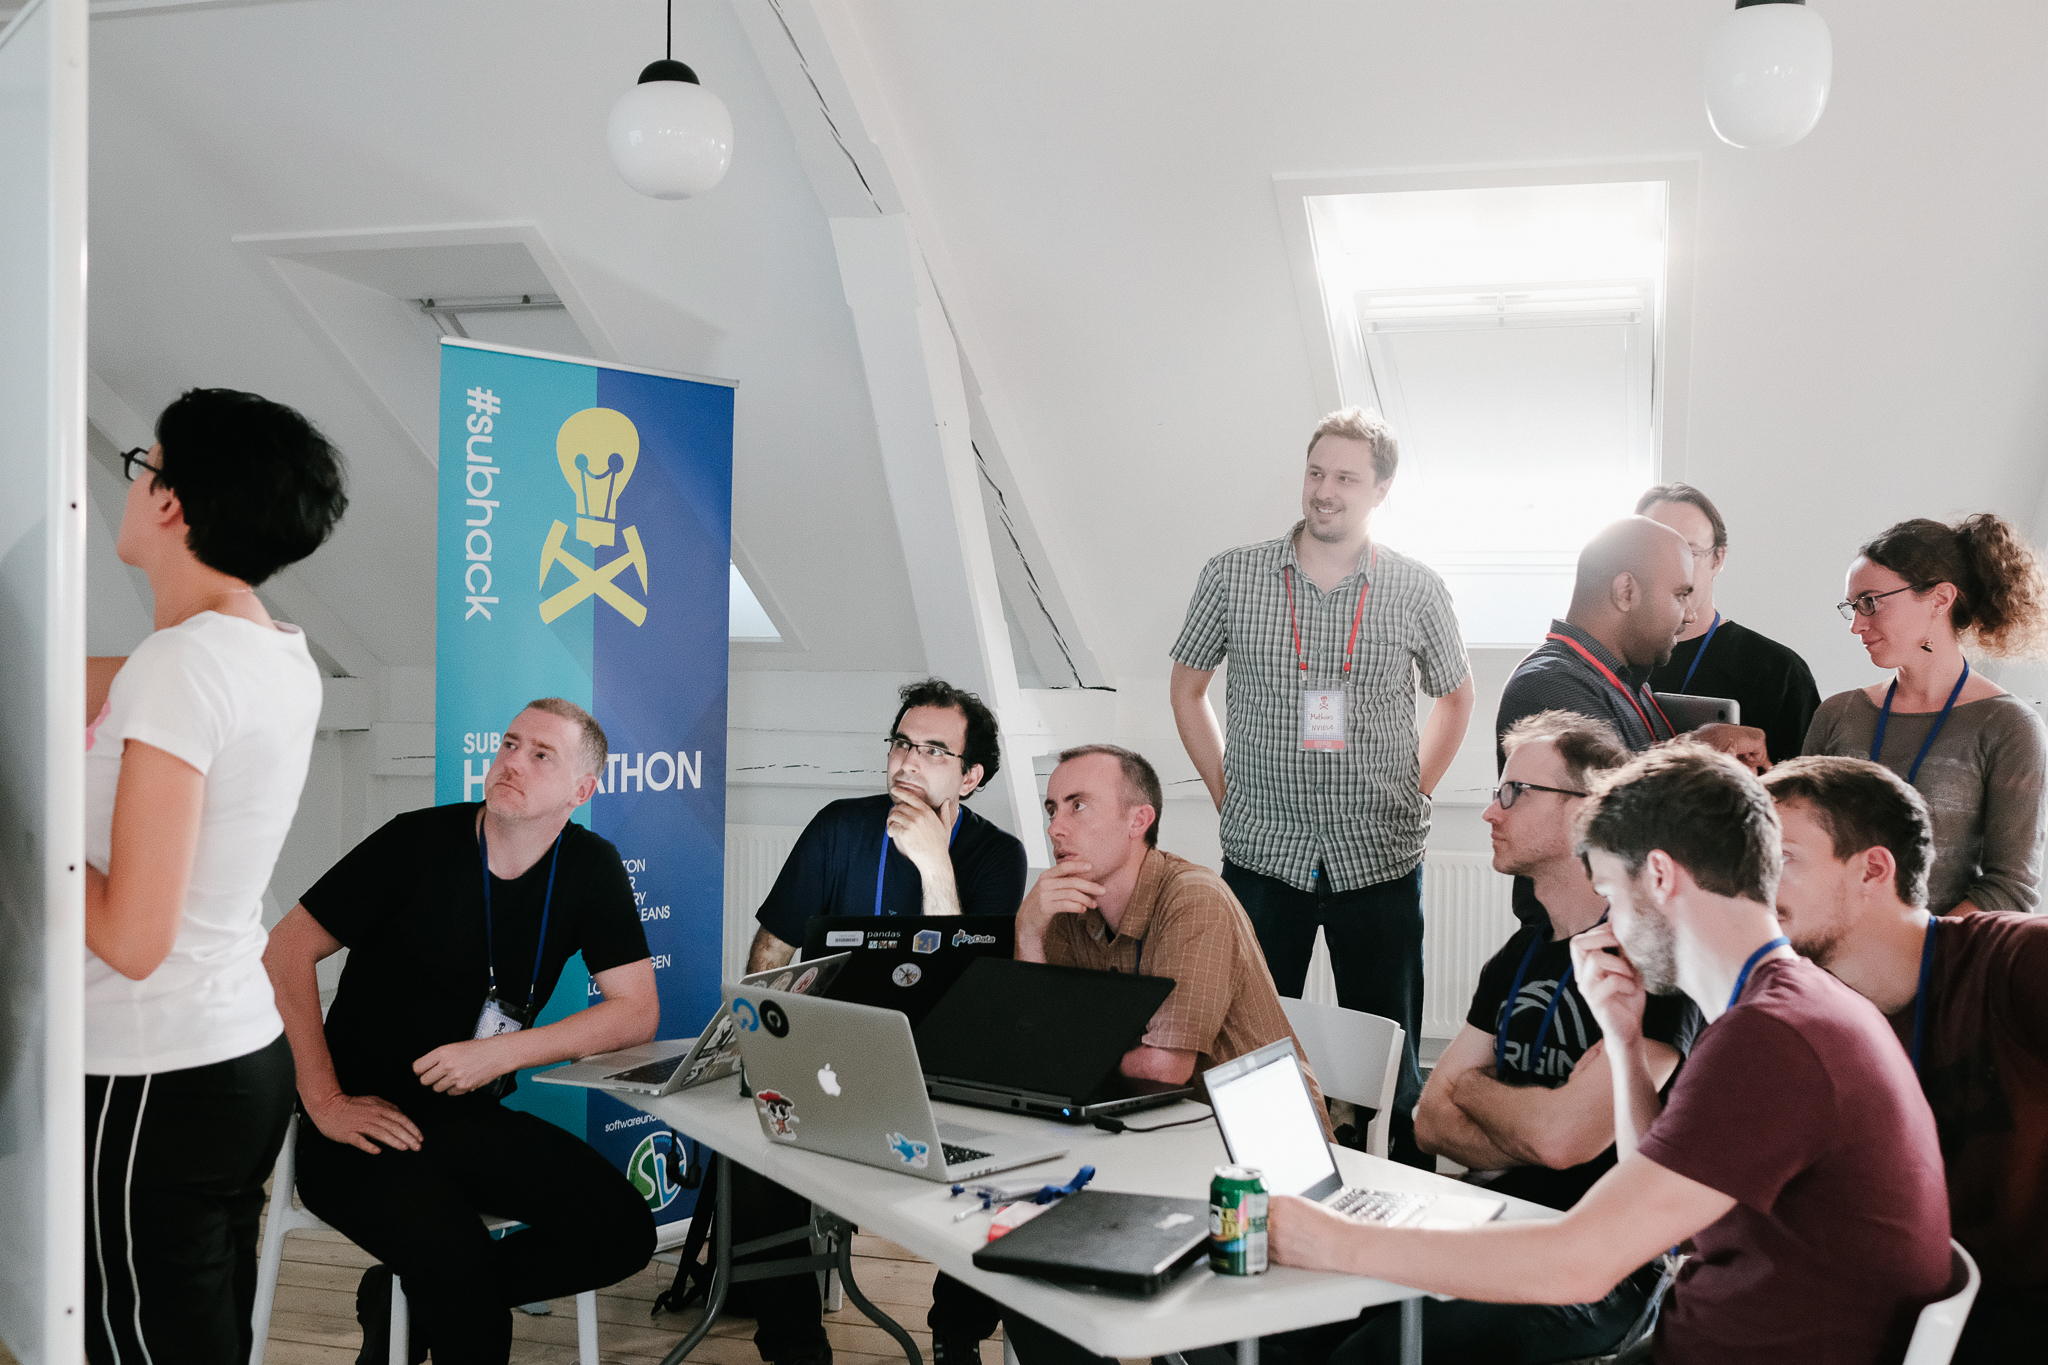
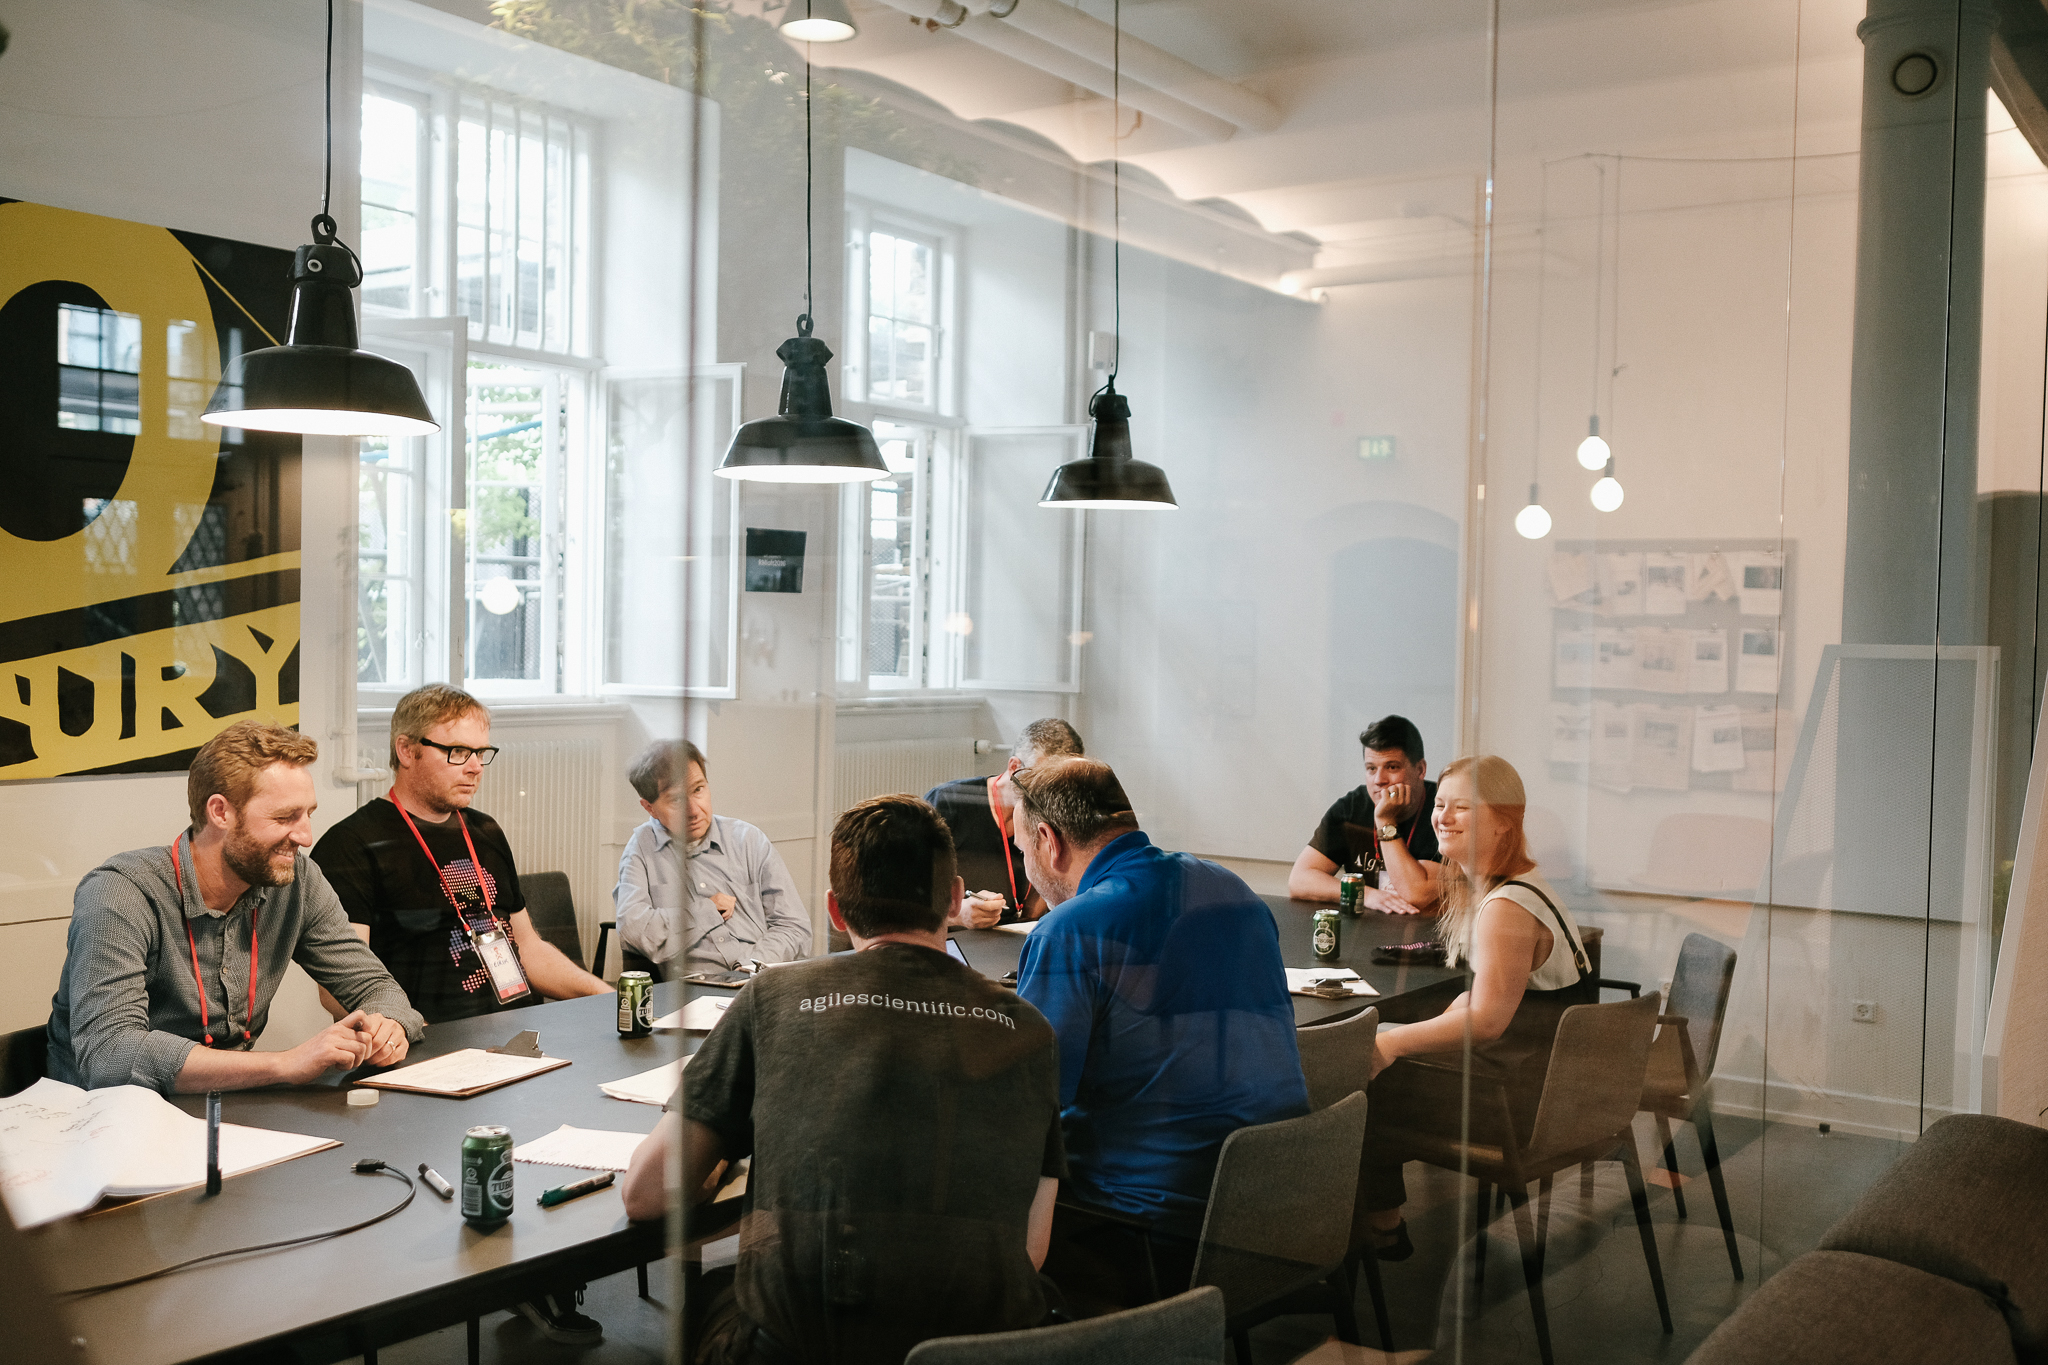
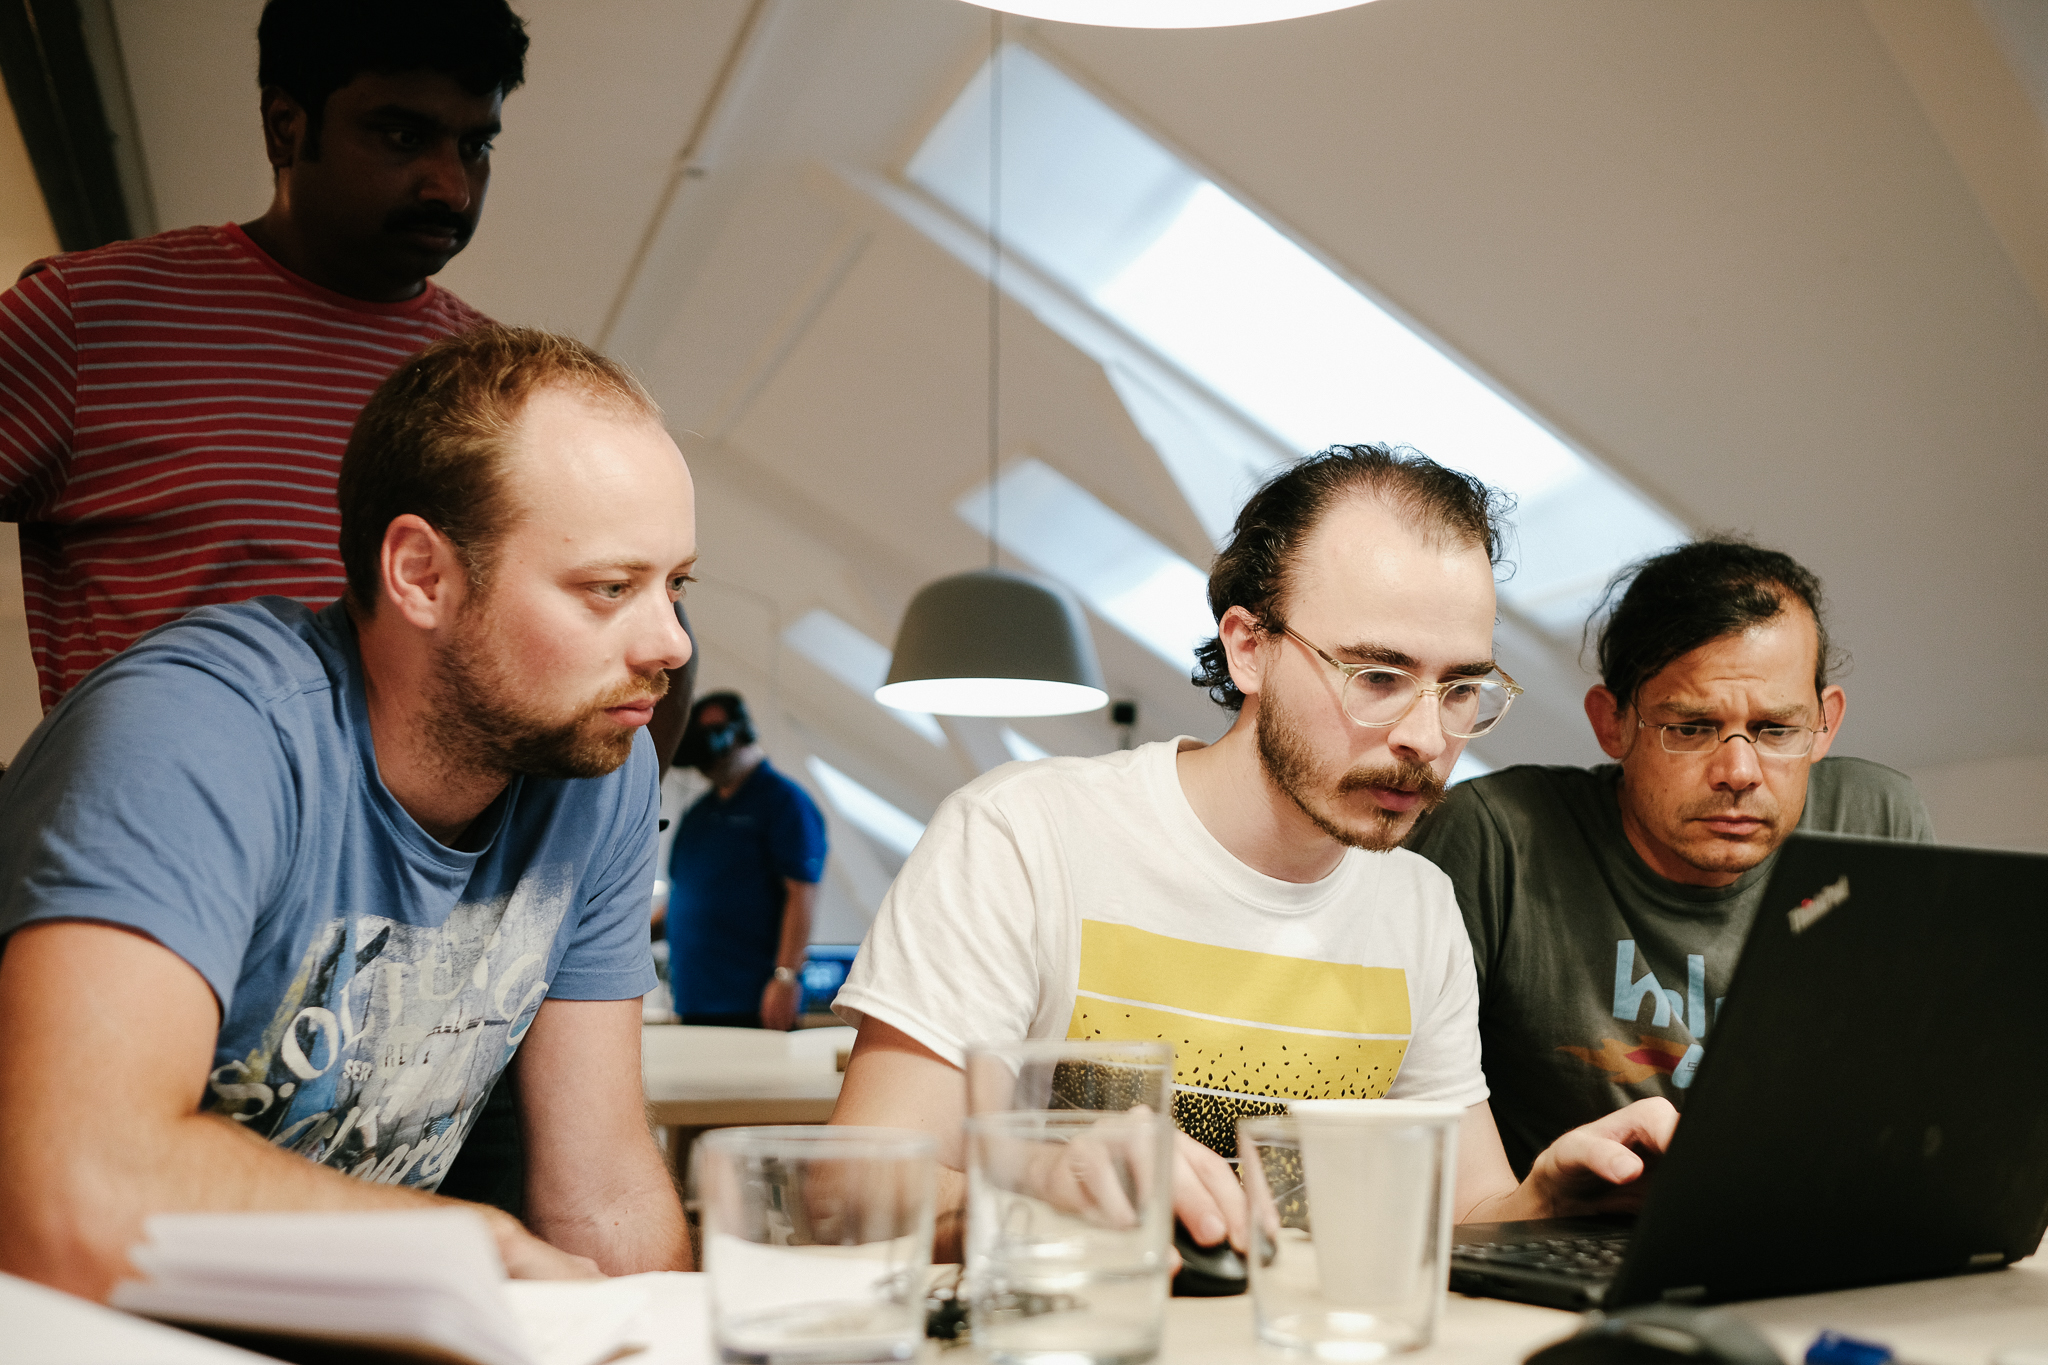
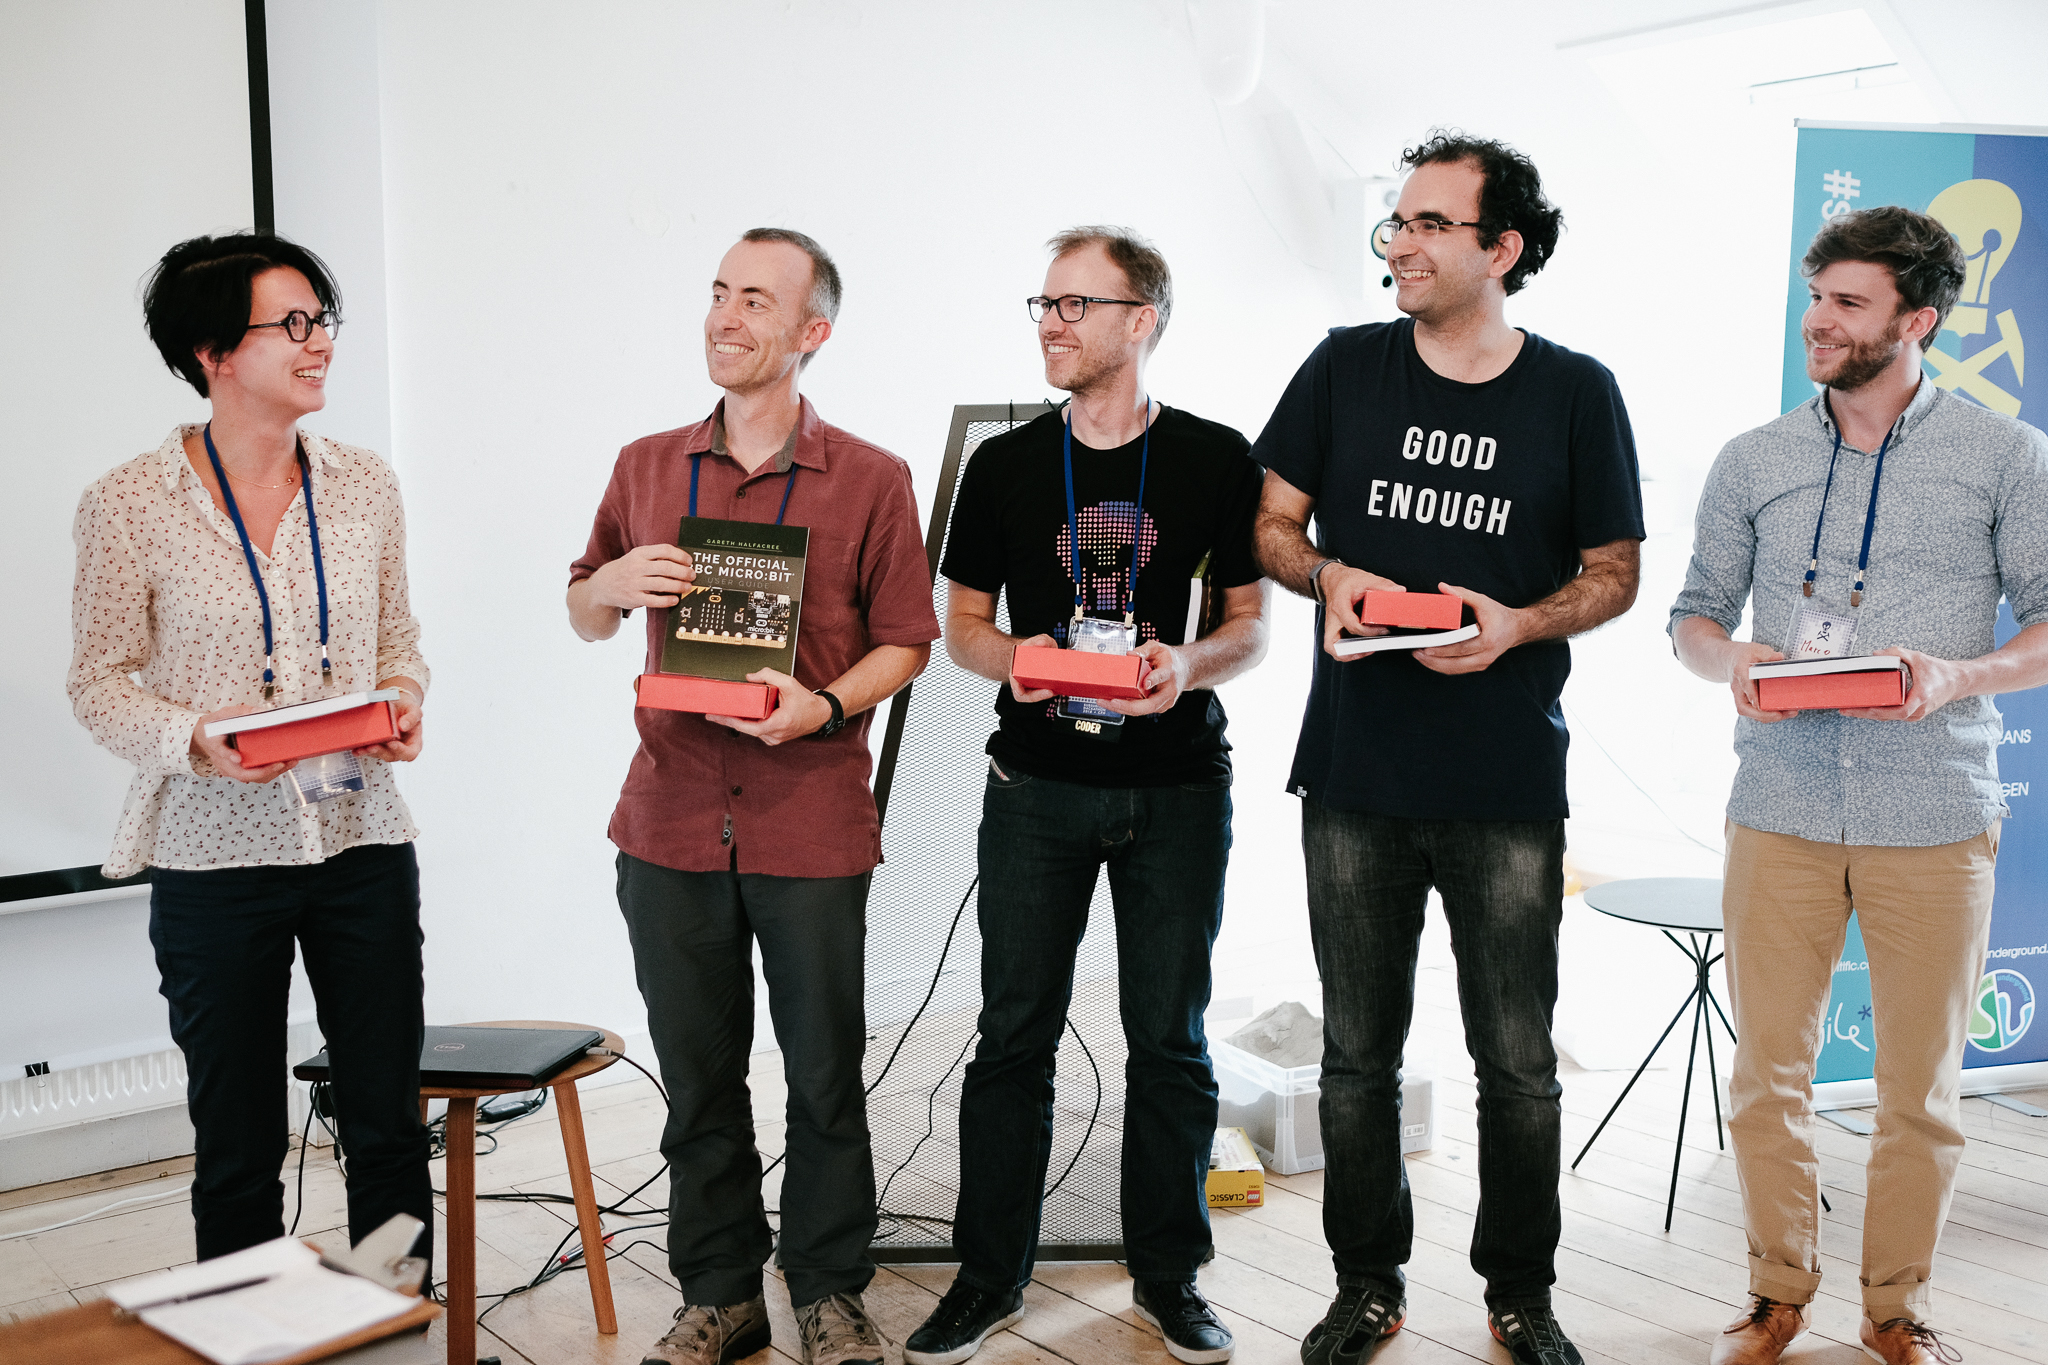
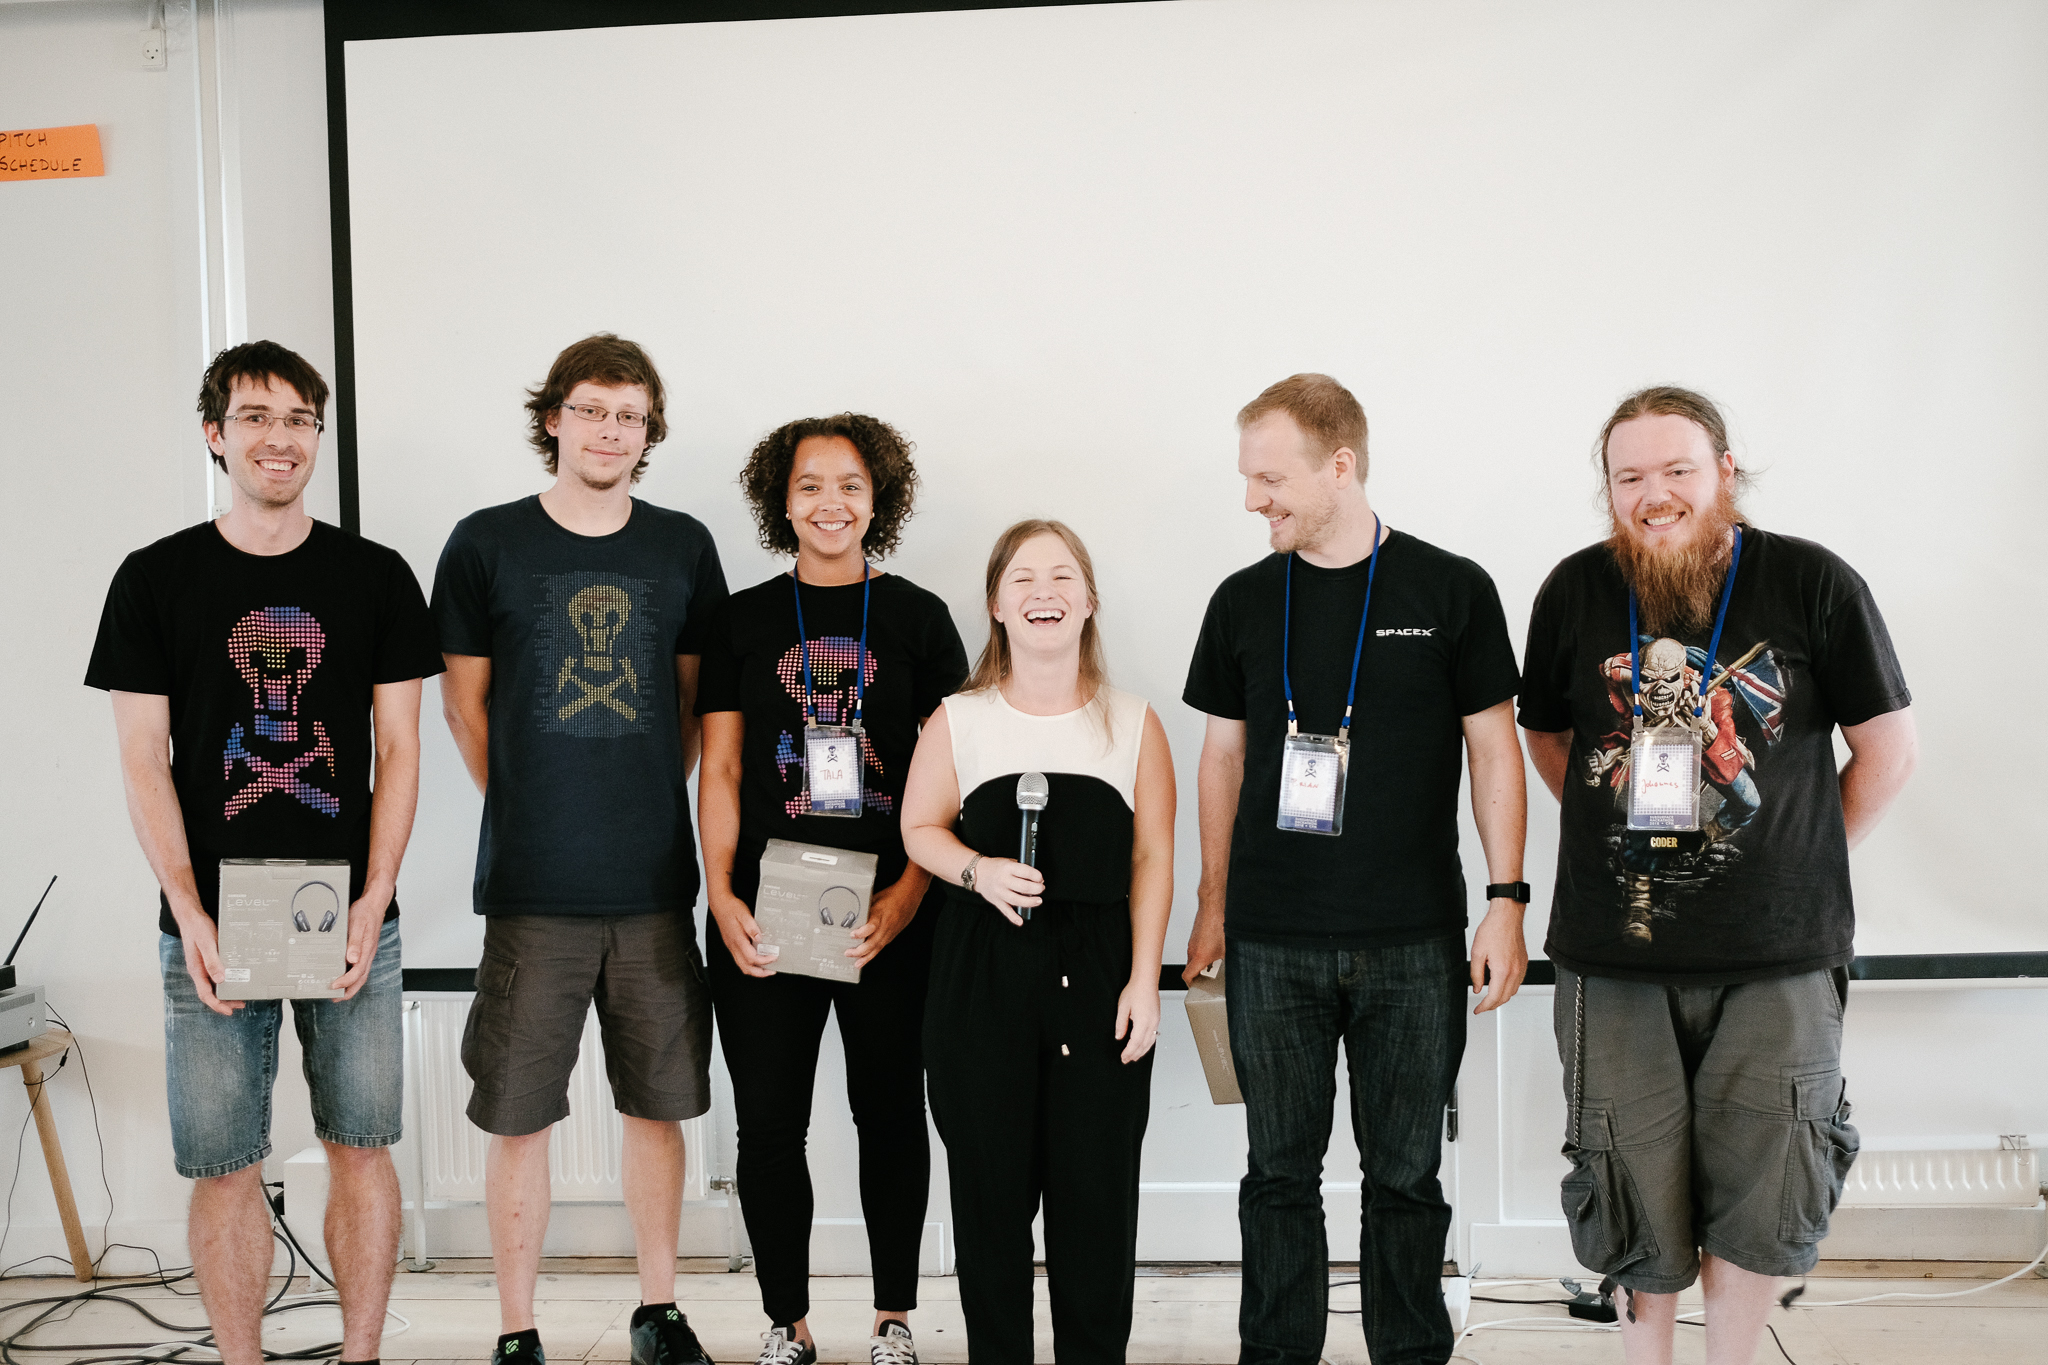
Thirty-seven digital geoscientists participated in the event at Robert Gordon University; most of them appear below. Many of them had not coded at all before the bootcamp on Friday, so a lot of people were well outside their comfort zones when we sat down on Saturday. Kudos to everyone!

The projects included the usual mix of seismic-based tasks, automated well log picking, a bit of natural language processing, some geospatial processing, and seals (of the mammalian variety). Here’s a rundown of what people got up to:


Counting seals on Scottish islands

Seal Team 6: Julien Moreau, James Mullins, Alex Schaaf, Balazs Kertesz, Hassan Tolba, Tom Buckley.

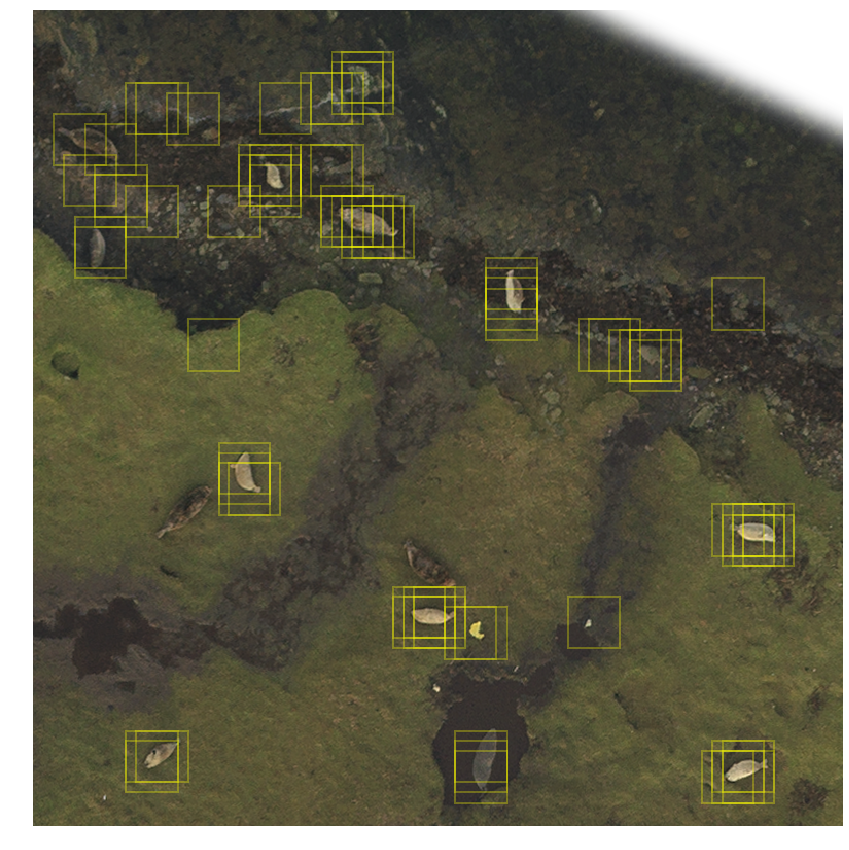
Project: Julien arrived with a cool dataset: over 6000 seals located on two large TIFFs images of Linga Holm, an island off Stronsay in the Orkneys. The challenge: locate the seals automatically. The team came up with a pipeline to generate HOG descriptors, train a support vector machine on about 20,000 labelled image tiles, then scan the large TIFFs to try to identify seals. Shown here is the output of one such scan, with a few false positive and false negatives. GitHub repo.

This project won the Most Impact award.

seals_test_image.png

Automatic classification of seismic sections

Team Seis Class: Jo Bagguley, Laura Bardsley, Chio Martinez, Peter Rowbotham, Mike Atkins, Niall Rowantree, James Beckwith.

Project: Can you tell if a section has been spectrally whitened? Or AGC’d? This team set out to attempt to teach a neural network the difference. As a first step, they reduced it to a binary classification problem, and showed 110 ‘final’ and 110 ‘raw’ lines from the OGA ESP 2D 2016 dataset to a convolutional neural net. The AI achieved an accuracy of 98% on this task. GitHub repro.

This project won recognition for a Job Well Done.


Why do get blocks relinquished?

Team Relinquishment Surprise: Tanya Knowles, Obiamaka Agbaneje, Kachalla Aliyuda, Daniel Camacho, David Wilkinson (not pictured).

Project: Recognizing the vast trove of latent information locked up in the several thousand reports submitted to the OGA. Despite focusing on relinquishment, they quickly discovered that most of the task is to cope with the heterogeneity of the dataset, but they did manage to extract term frequencies from the various Conclusions sections, and made an ArcGIS web app to map them.

relinquishment_team.jpg

Recognizing reflection styles on seismic

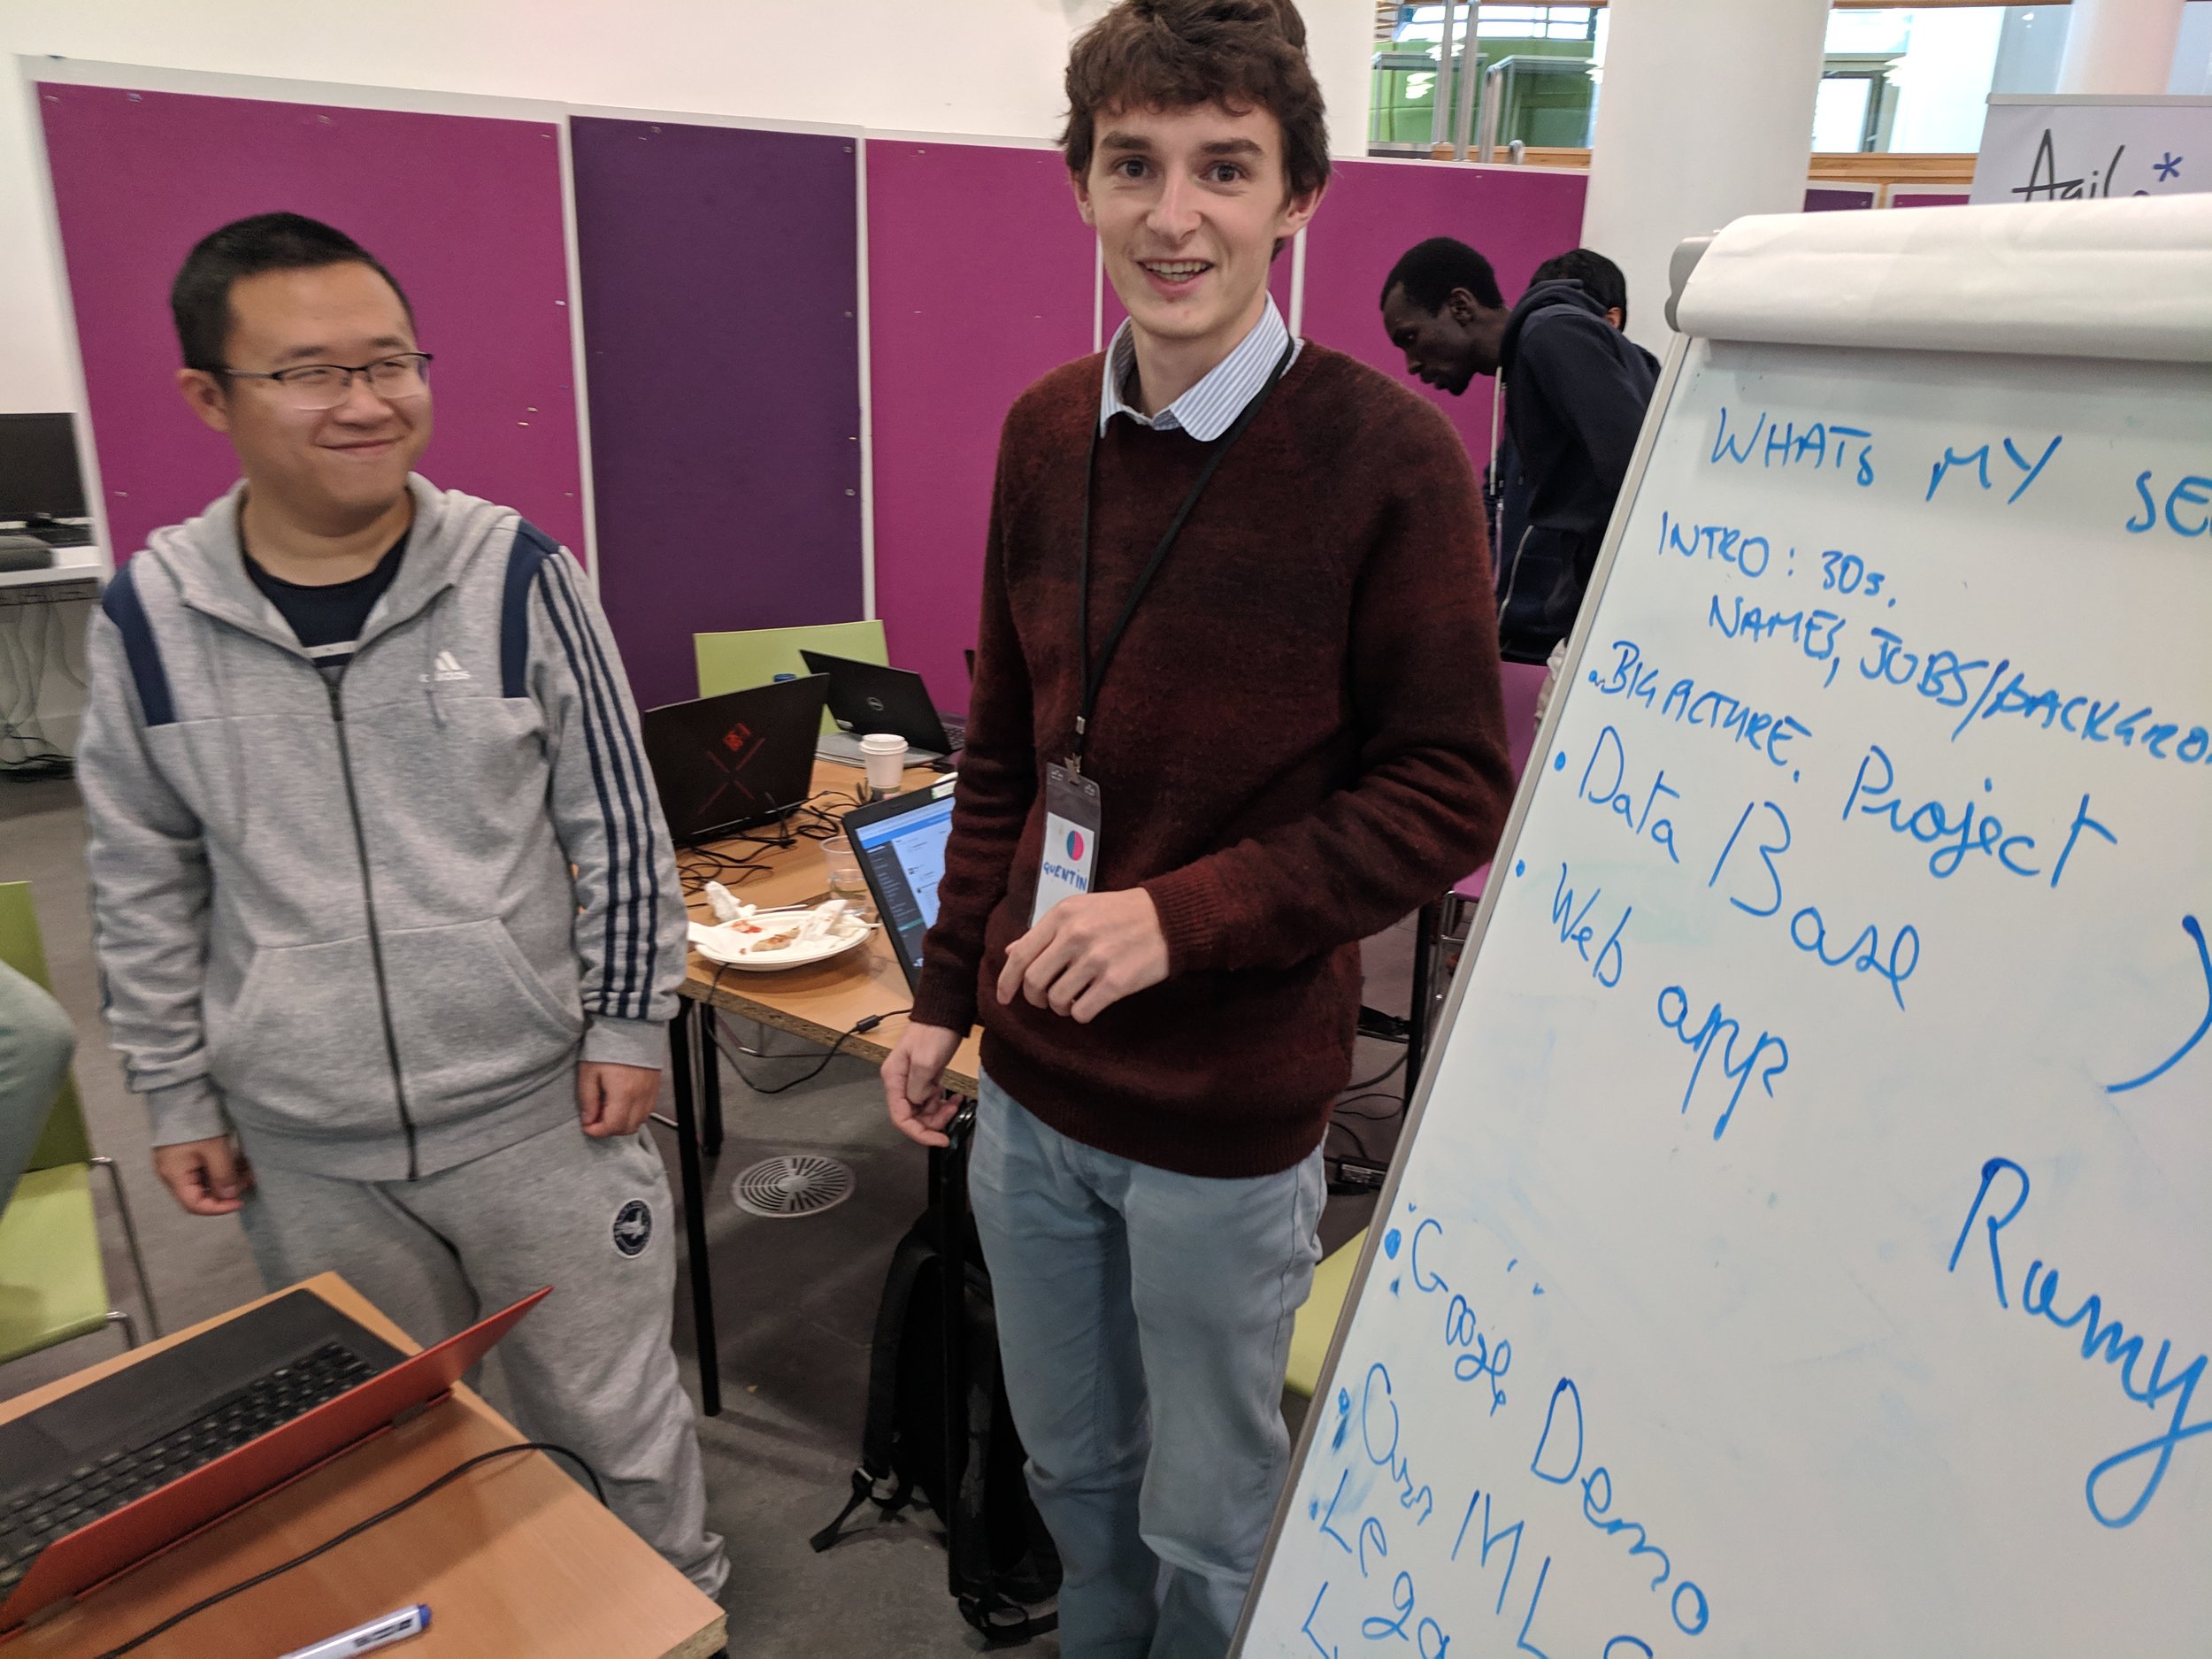
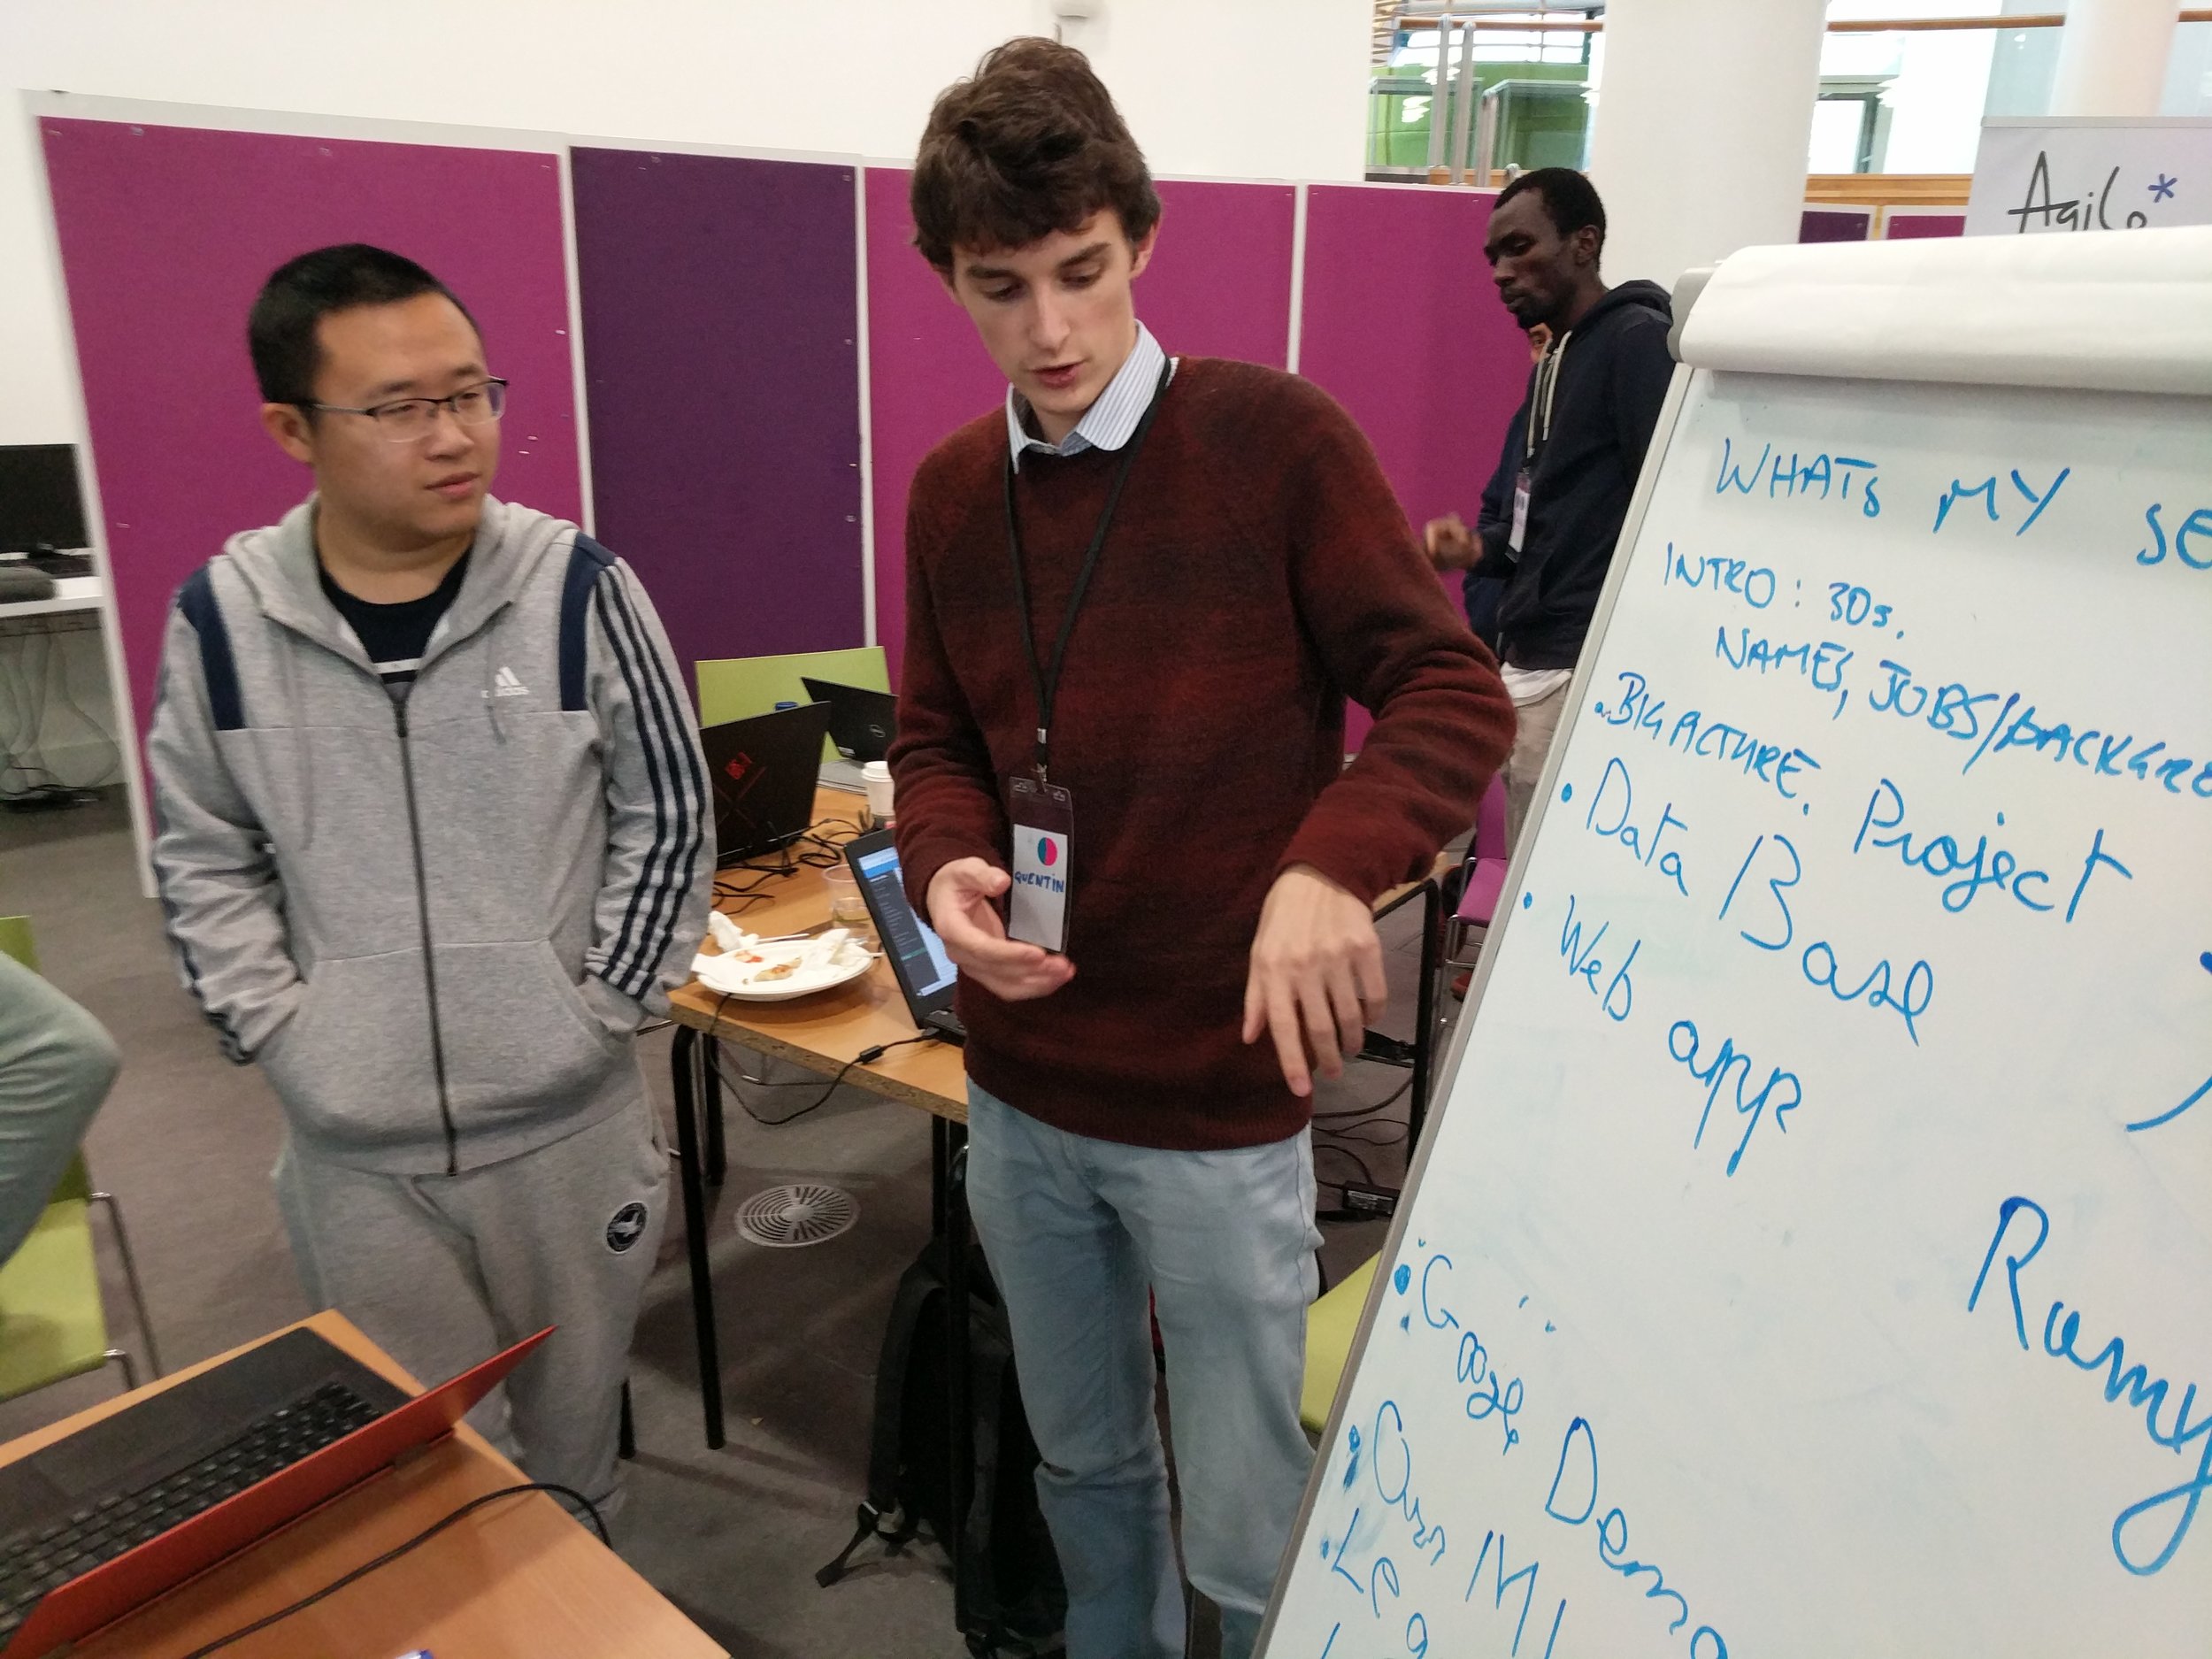
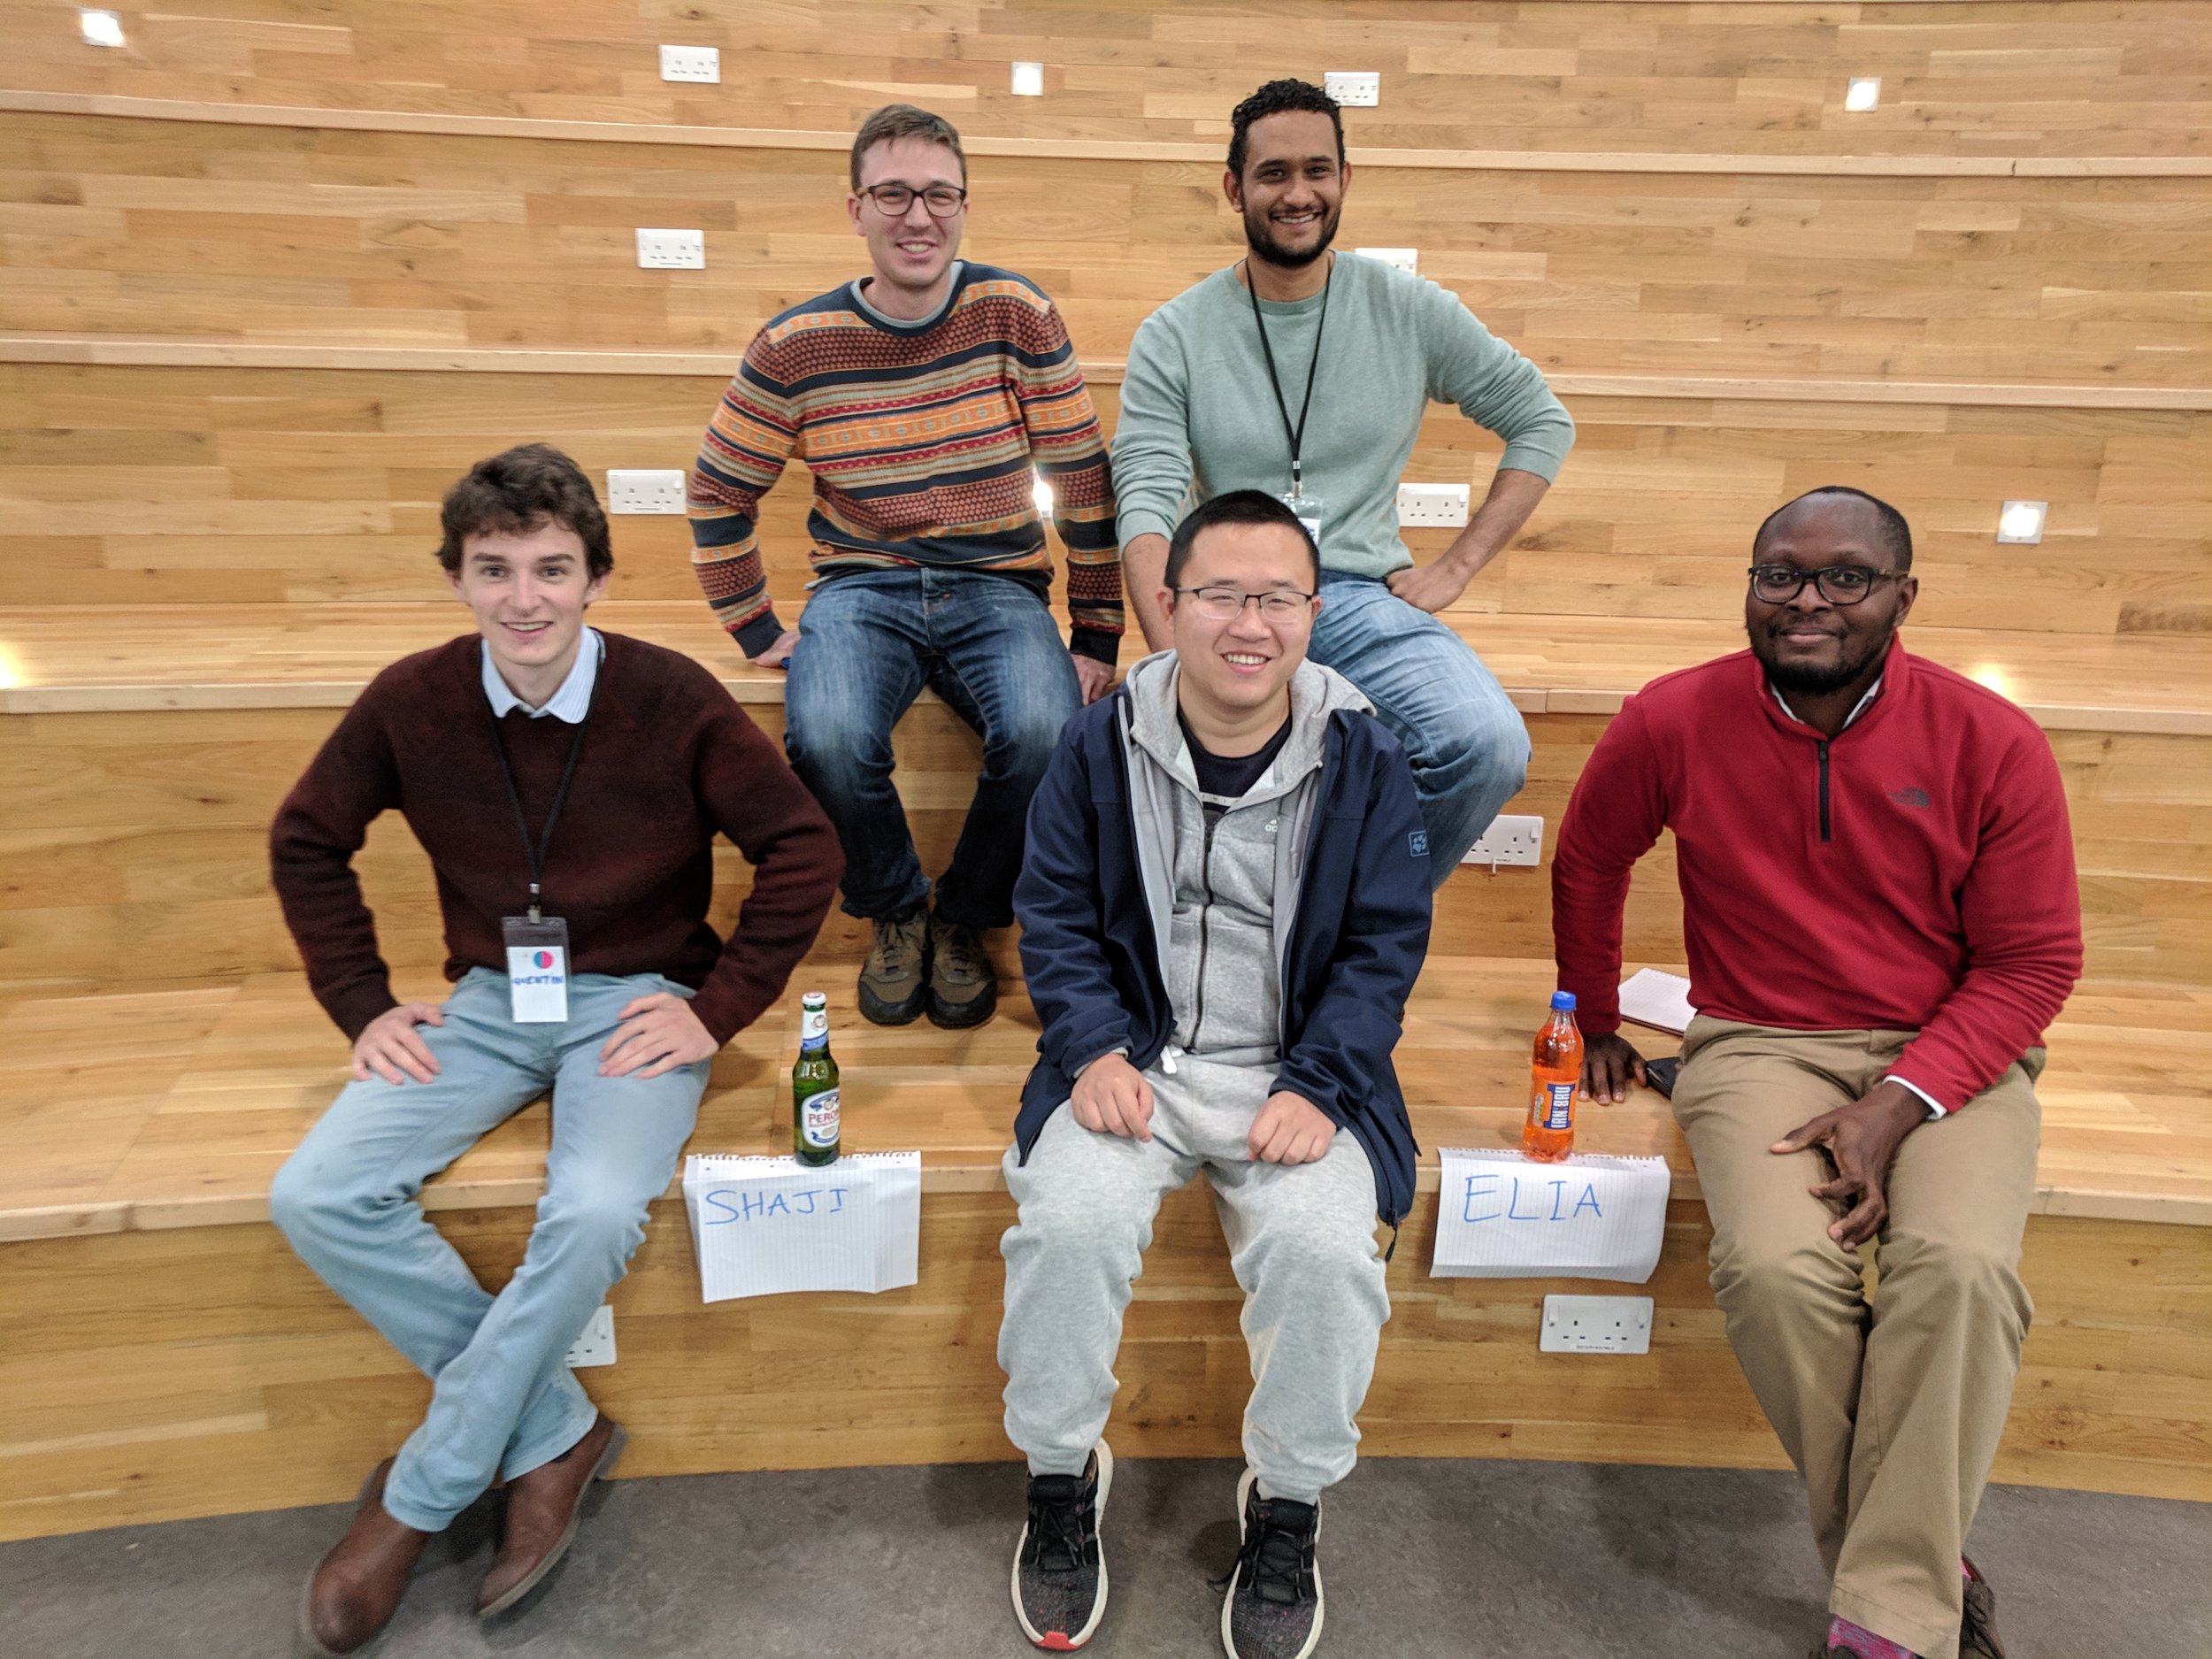
Team What’s My Seismic? Quentin Corlay, Tony Hallam, Ramy Abdallah, Zhihua Cui, Elia Gubbala, Amechi Halim.

Project: The team wanted to detect the presence of various seismic facies in a small segment of seismic data (with a view to later interpreting entire datasets). They quickly generated a training dataset, then explored three classifiers: XGBoost, Google’s AutoML, and a CNN. All of the methods gave reasonable results and were promising enough that the team vowed to continue investigating the problem. Project website. GitHub repo.

This project won the Best Execution award.

whats-my-seismic.png

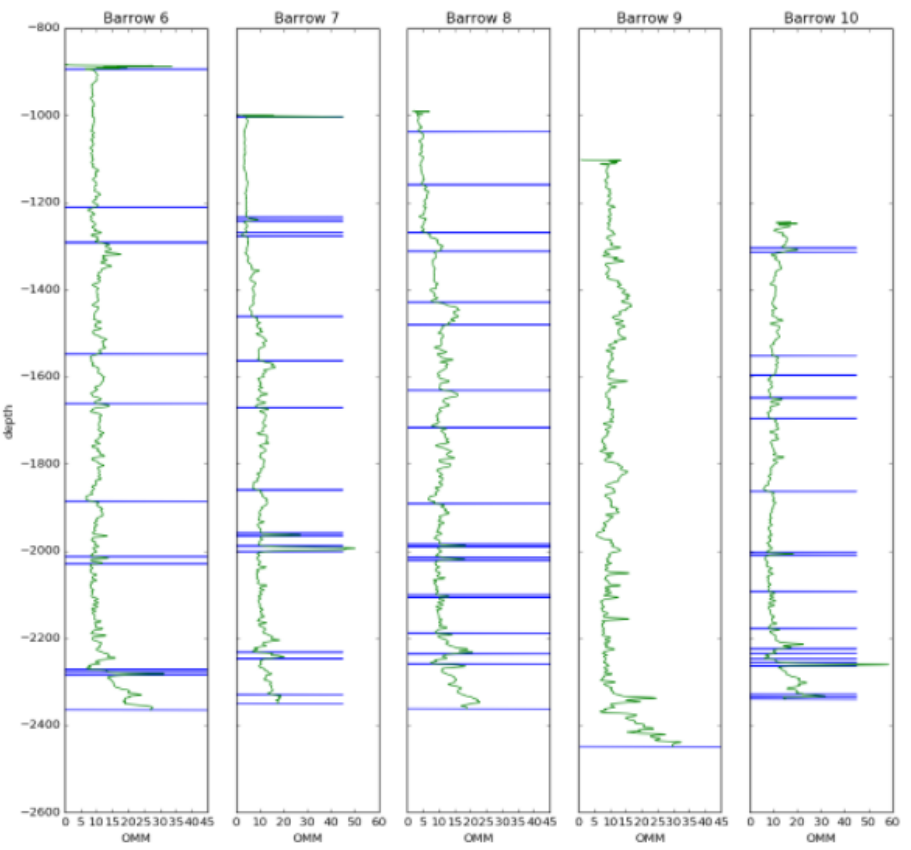
Stretchy-squeezey well log correlation

Team Dynamic Depth Warping: Jacqueline Booth, Sarah Weihmann, Khaled Muhammad, Sadiq Sani, Rahman Mukras, Trent Piaralall, Julio Rodriguez.

Project: Making picks and correlations in wireline data is hard, partly because the stratigraphic signal changes spatially — thinning and thickening, and with missing or extra sections. To try to cope with this, the team applied a dynamic time (well, depth) warping algorithm to the logs, then looking for similar sections in adjacent wells. The image shows a target GR log (left) with the 5 most similar sections. Two, maybe four, of them seem reasonable. Next the team planned to incorporate more logs, and attach probabilities to the correlations. Early results looked promising. GitHub repo.


Making lithostrat picks

Team Marker Maker: Nick Hayward, Frédéric Ramon, Can Yang, Peter Crafts, Malcolm Gall

Project: The team took on the task of sorting out lithostratigraphic well tops in a mature basin. But there are speedbumps on the road to glory, e.g. recognizing which picks are lithological (as opposed to chronological), and which pick names are equivalent. The team spent time on various subproblems, but there’s a long road ahead.

This project won recognition for a Job Well Done.

marker-maker.jpg

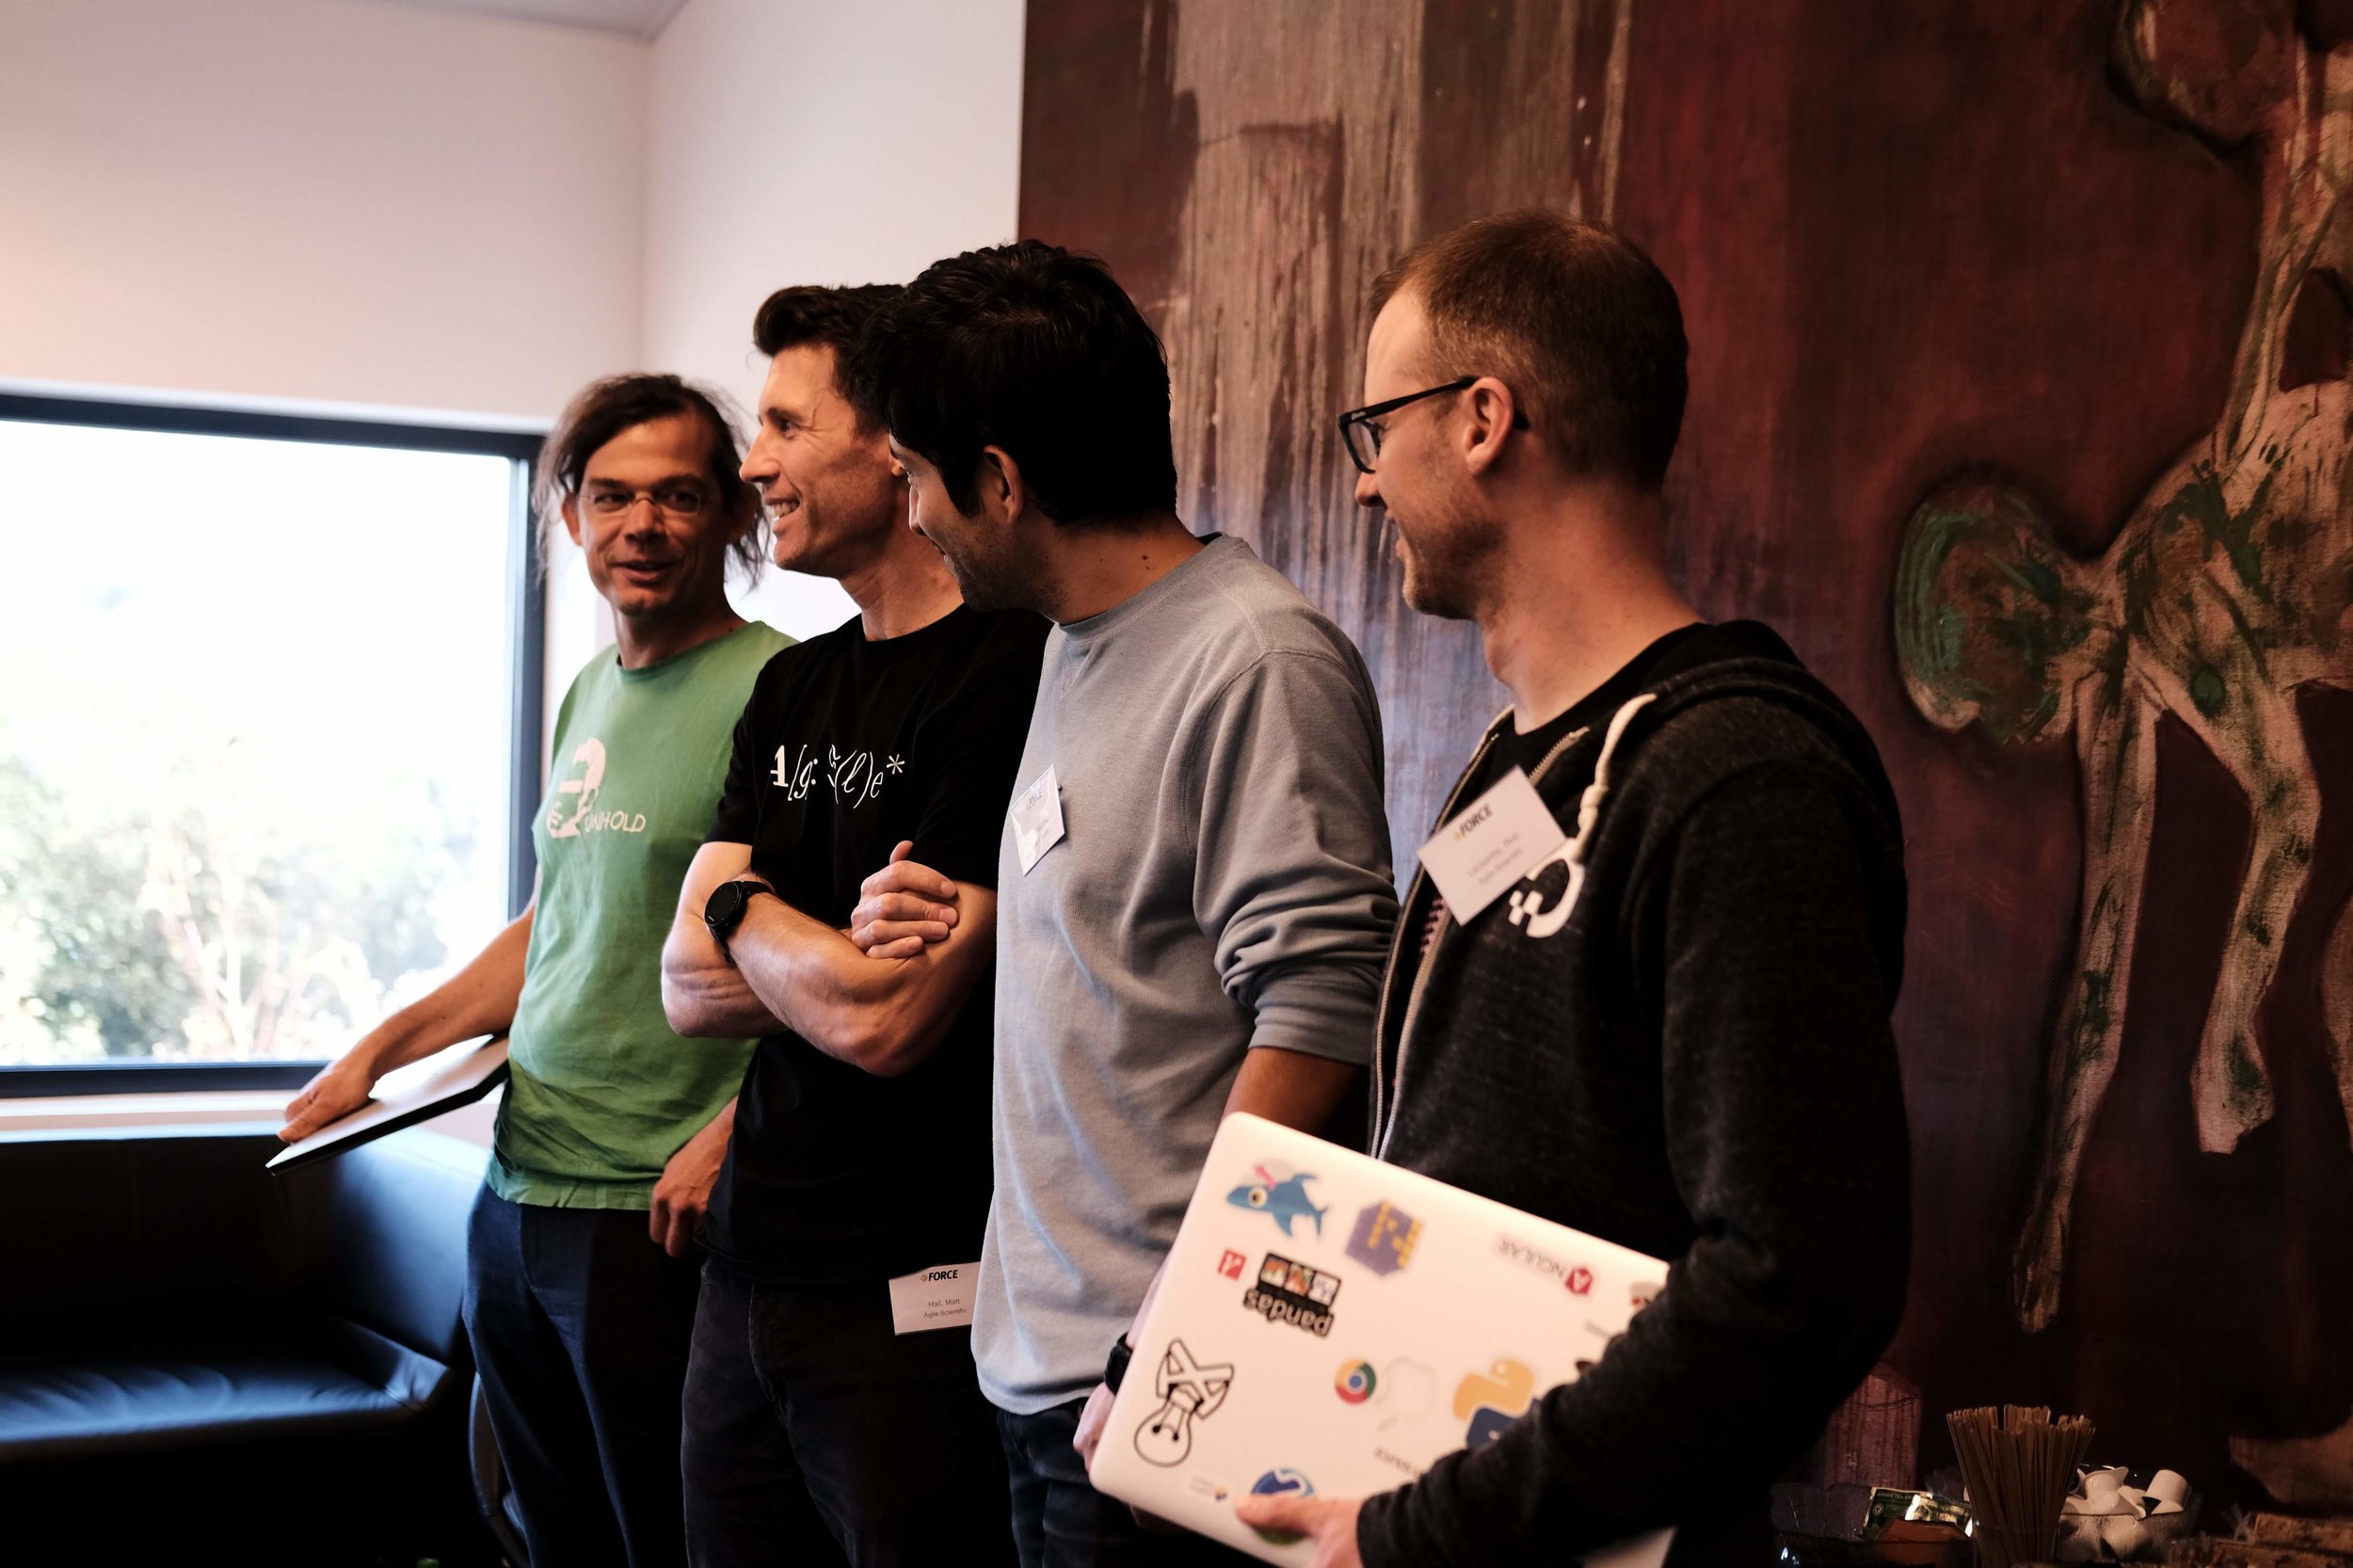
Alongside these projects, Rob and I floated around trying to help, and James Beckwith hacked on a cool project of his own for a while — Paint By Seismic, a look at unsupervised classification on seismic sections. In between generating attributes and clustering, he somehow managed to help and mentor most of the other teams — thanks James!

Thank you!

Thank you to The OGA for these events, and in particular to Jo Bagguley, whose organizational skills I much appreciated over the last few weeks (as my own skills gradually fell apart). The OGA’s own Nick Richardson, the OGTC’s Gillian White, and Robert Gordon Universty’s Eyad Elyan acted as judges.

These organizations contributed to the success of these events — please say Thank You to them when you can!

oga-sponsors.png

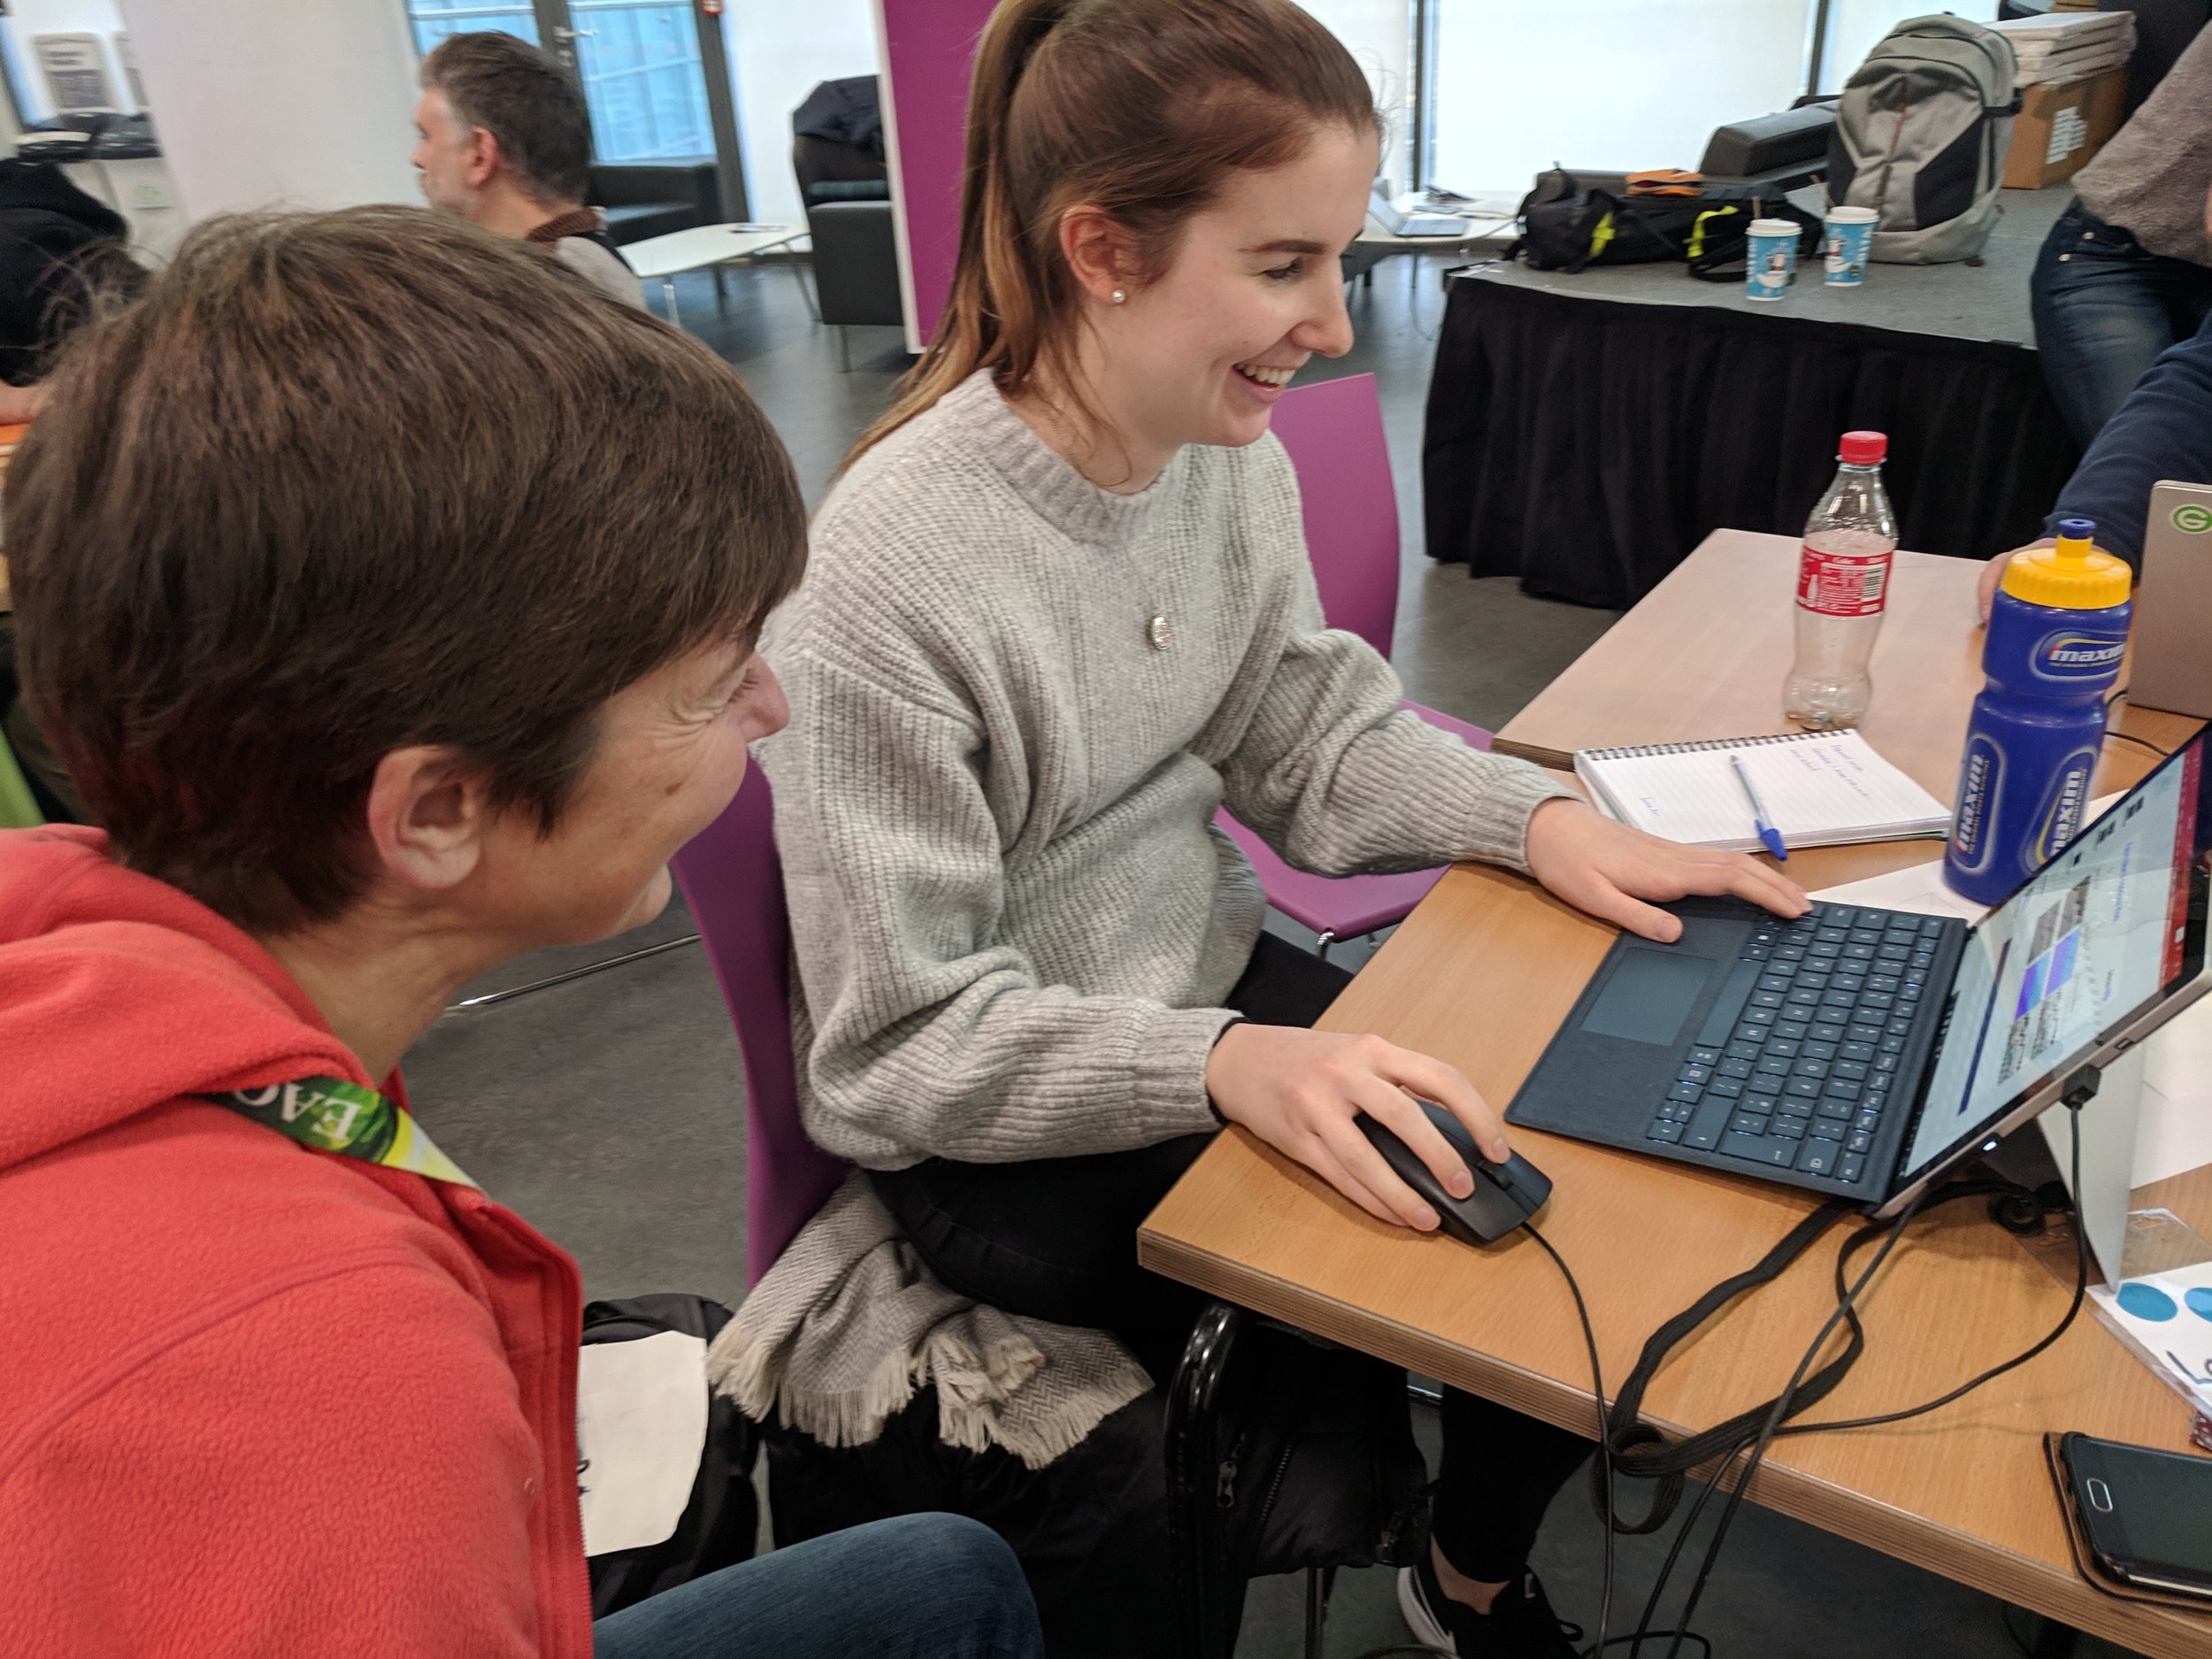
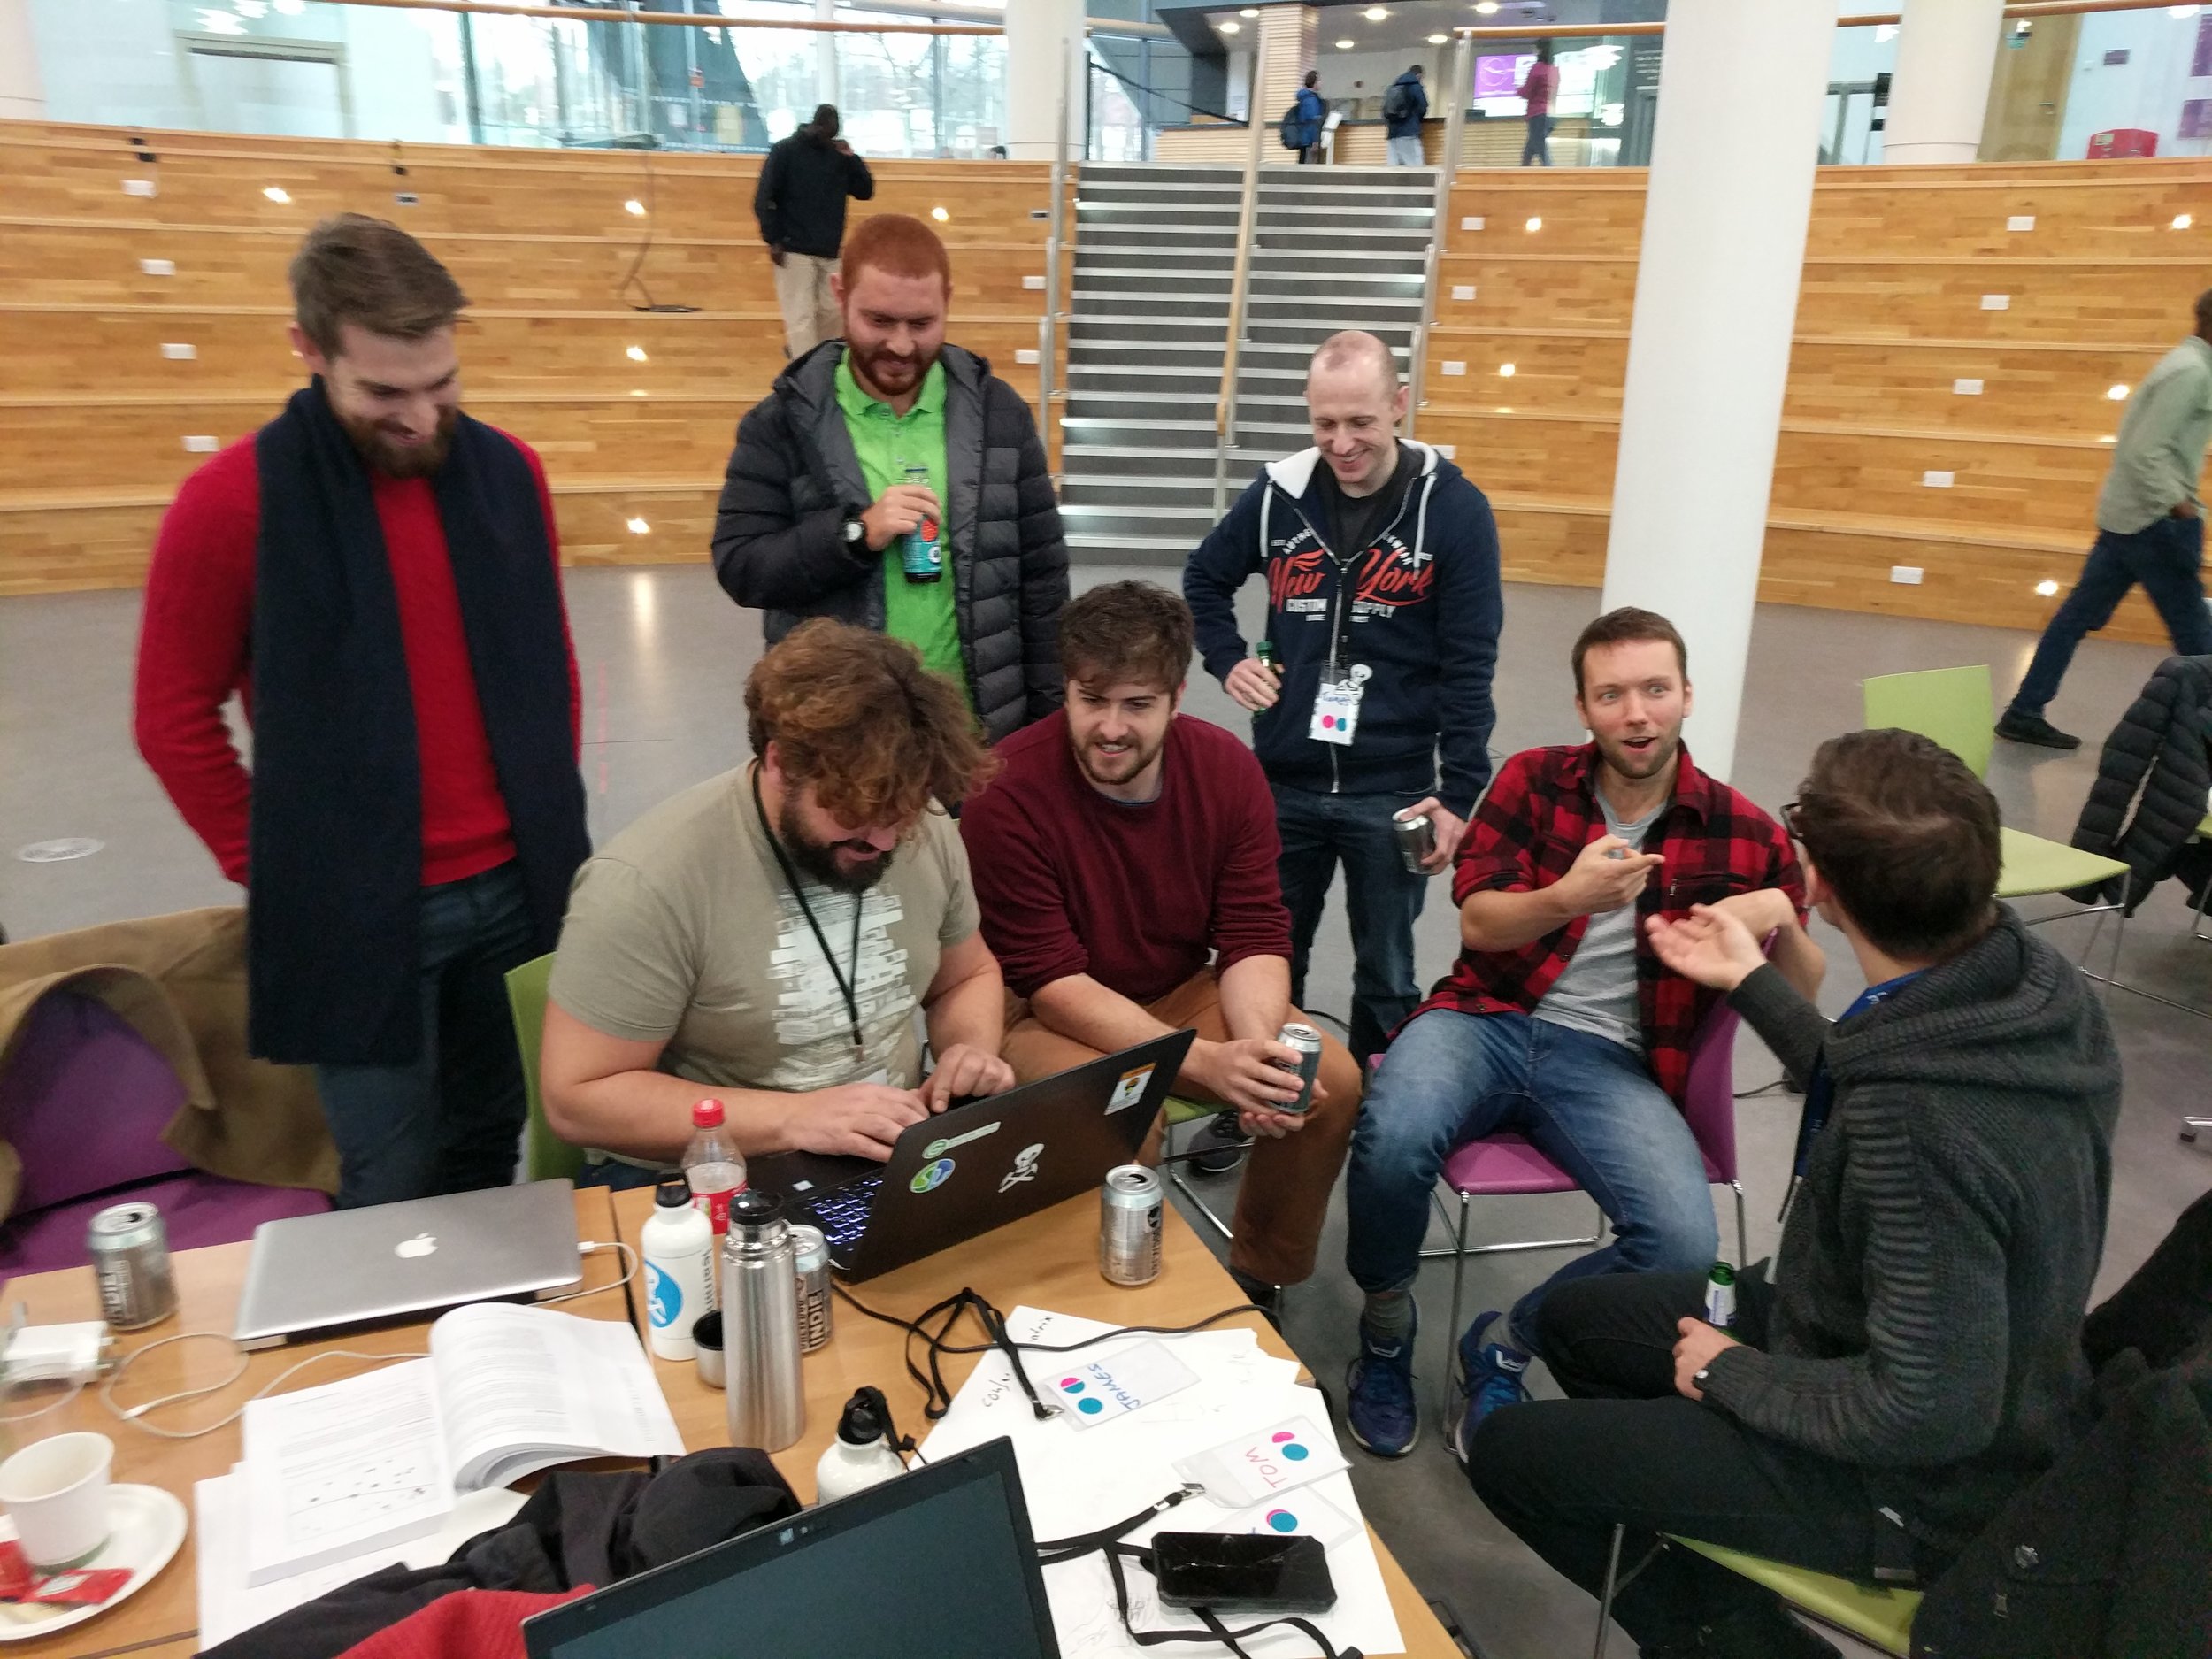
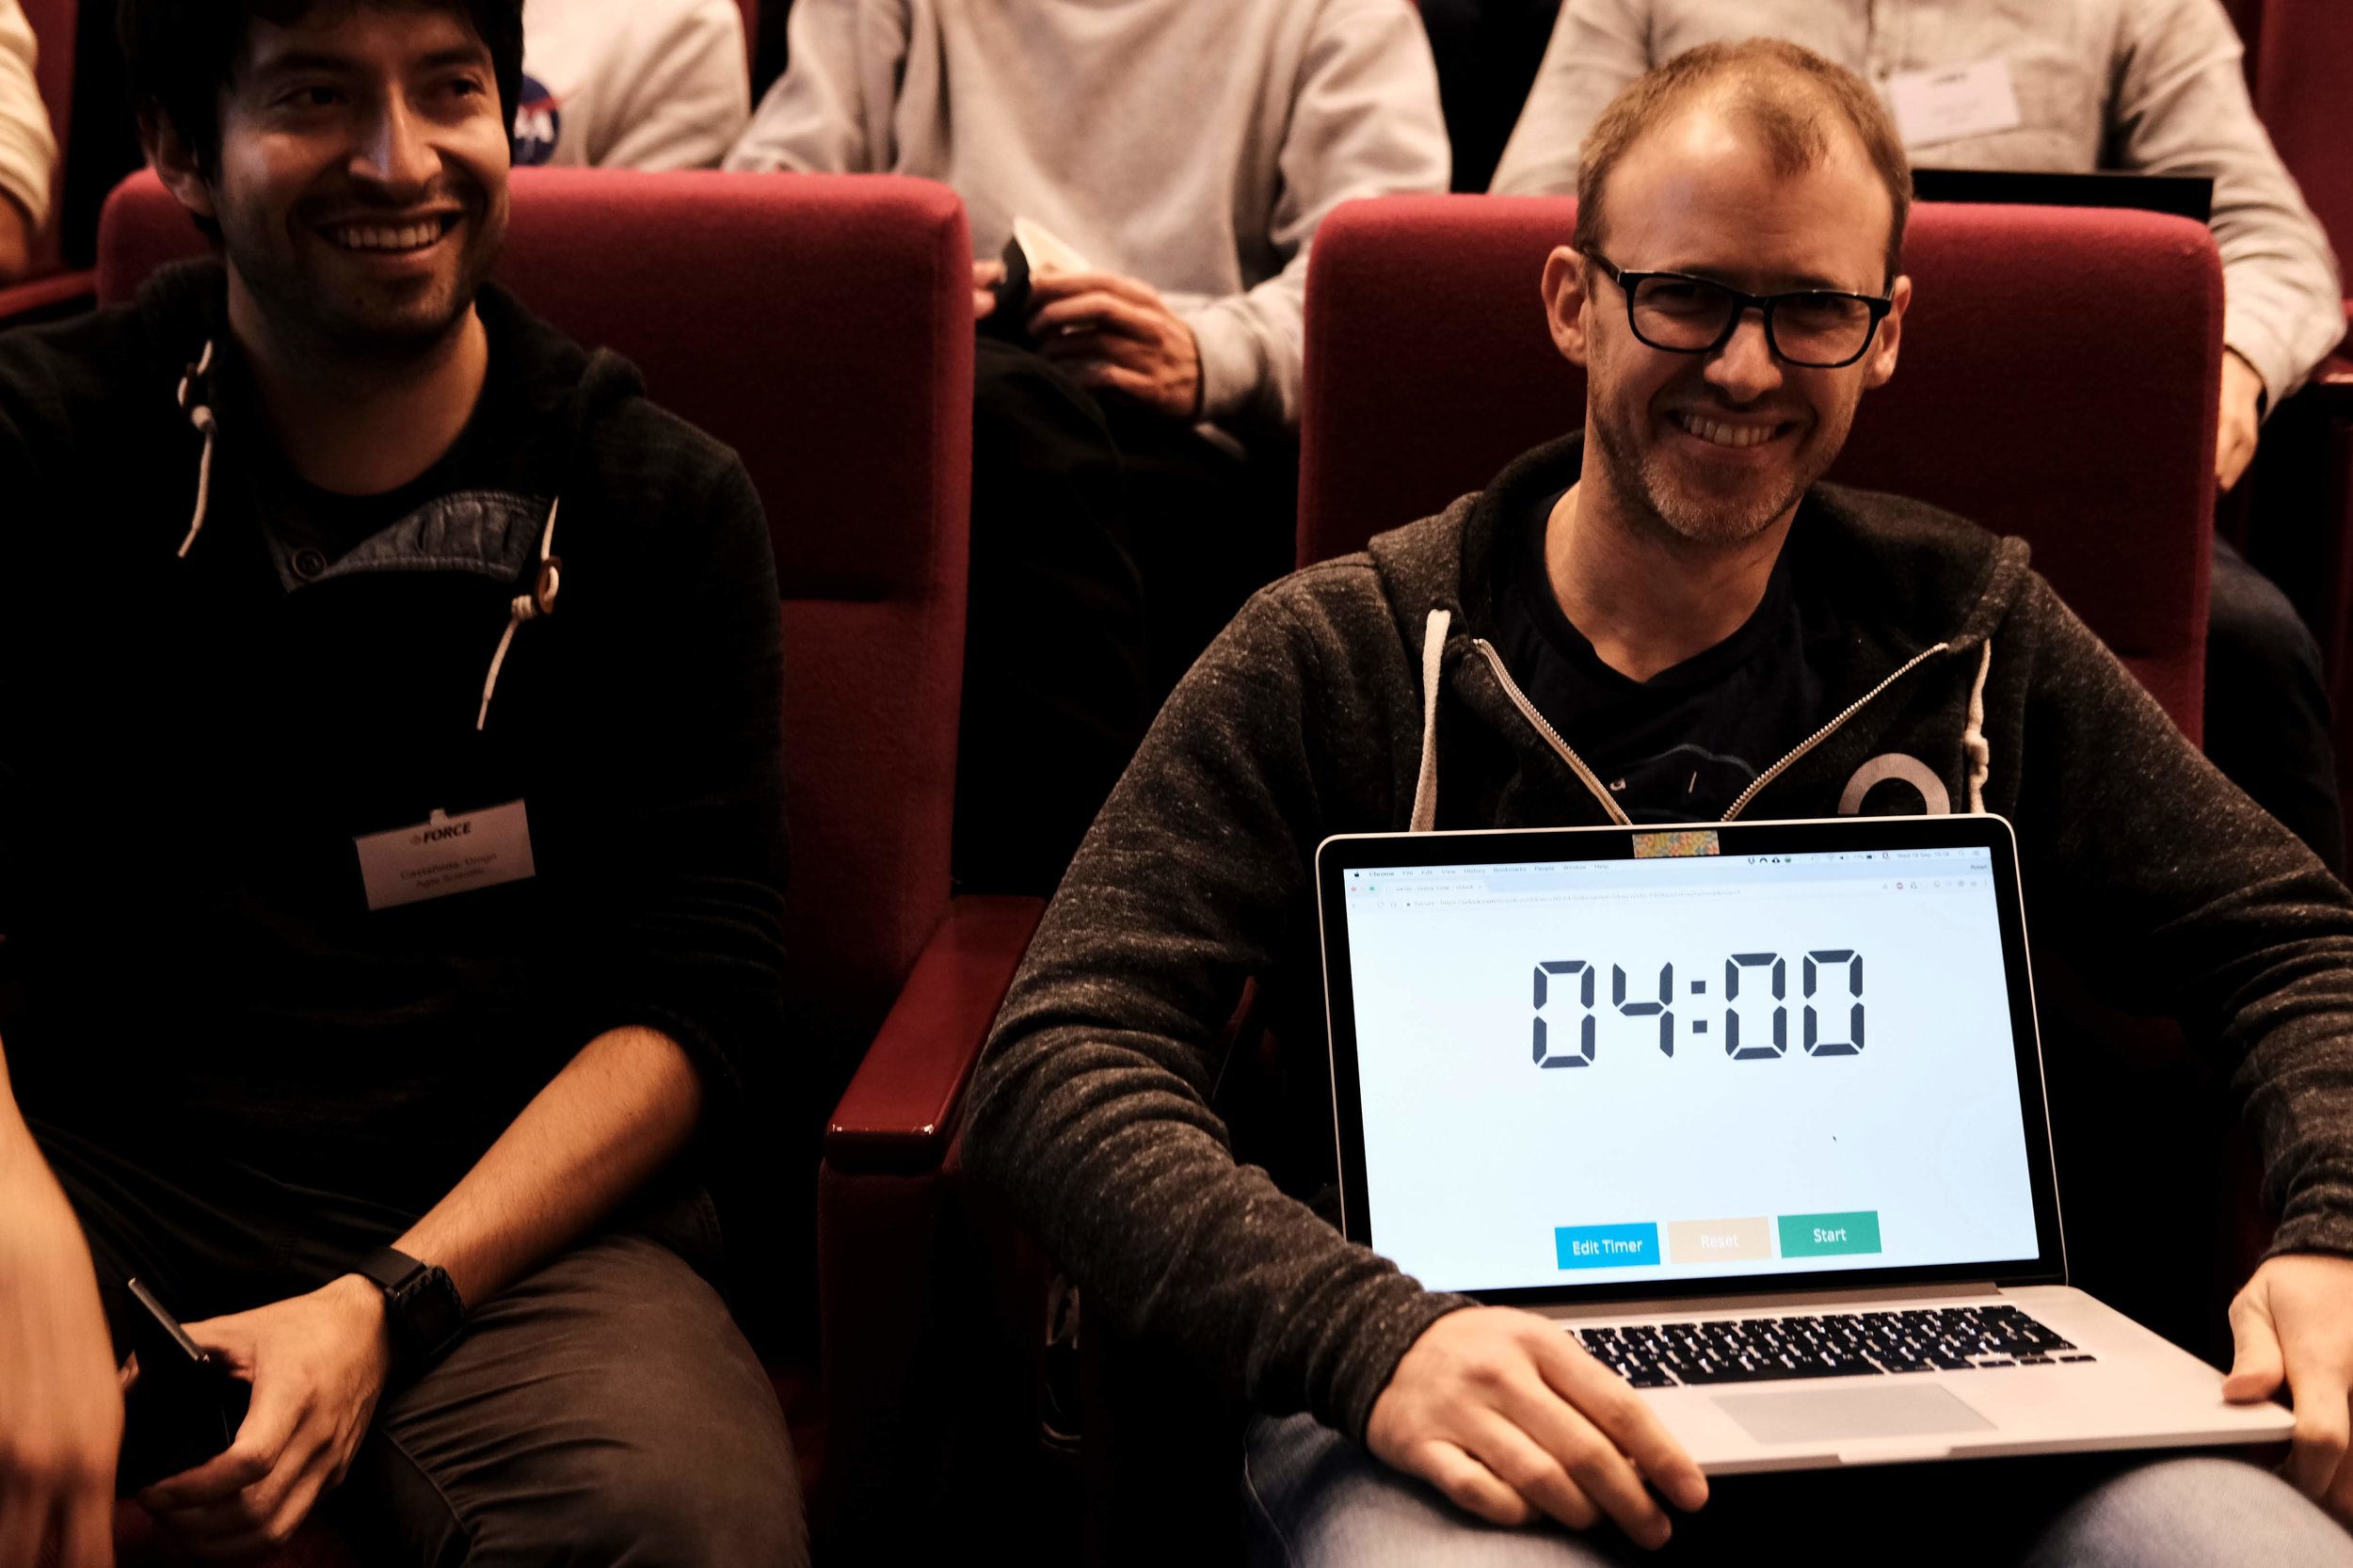
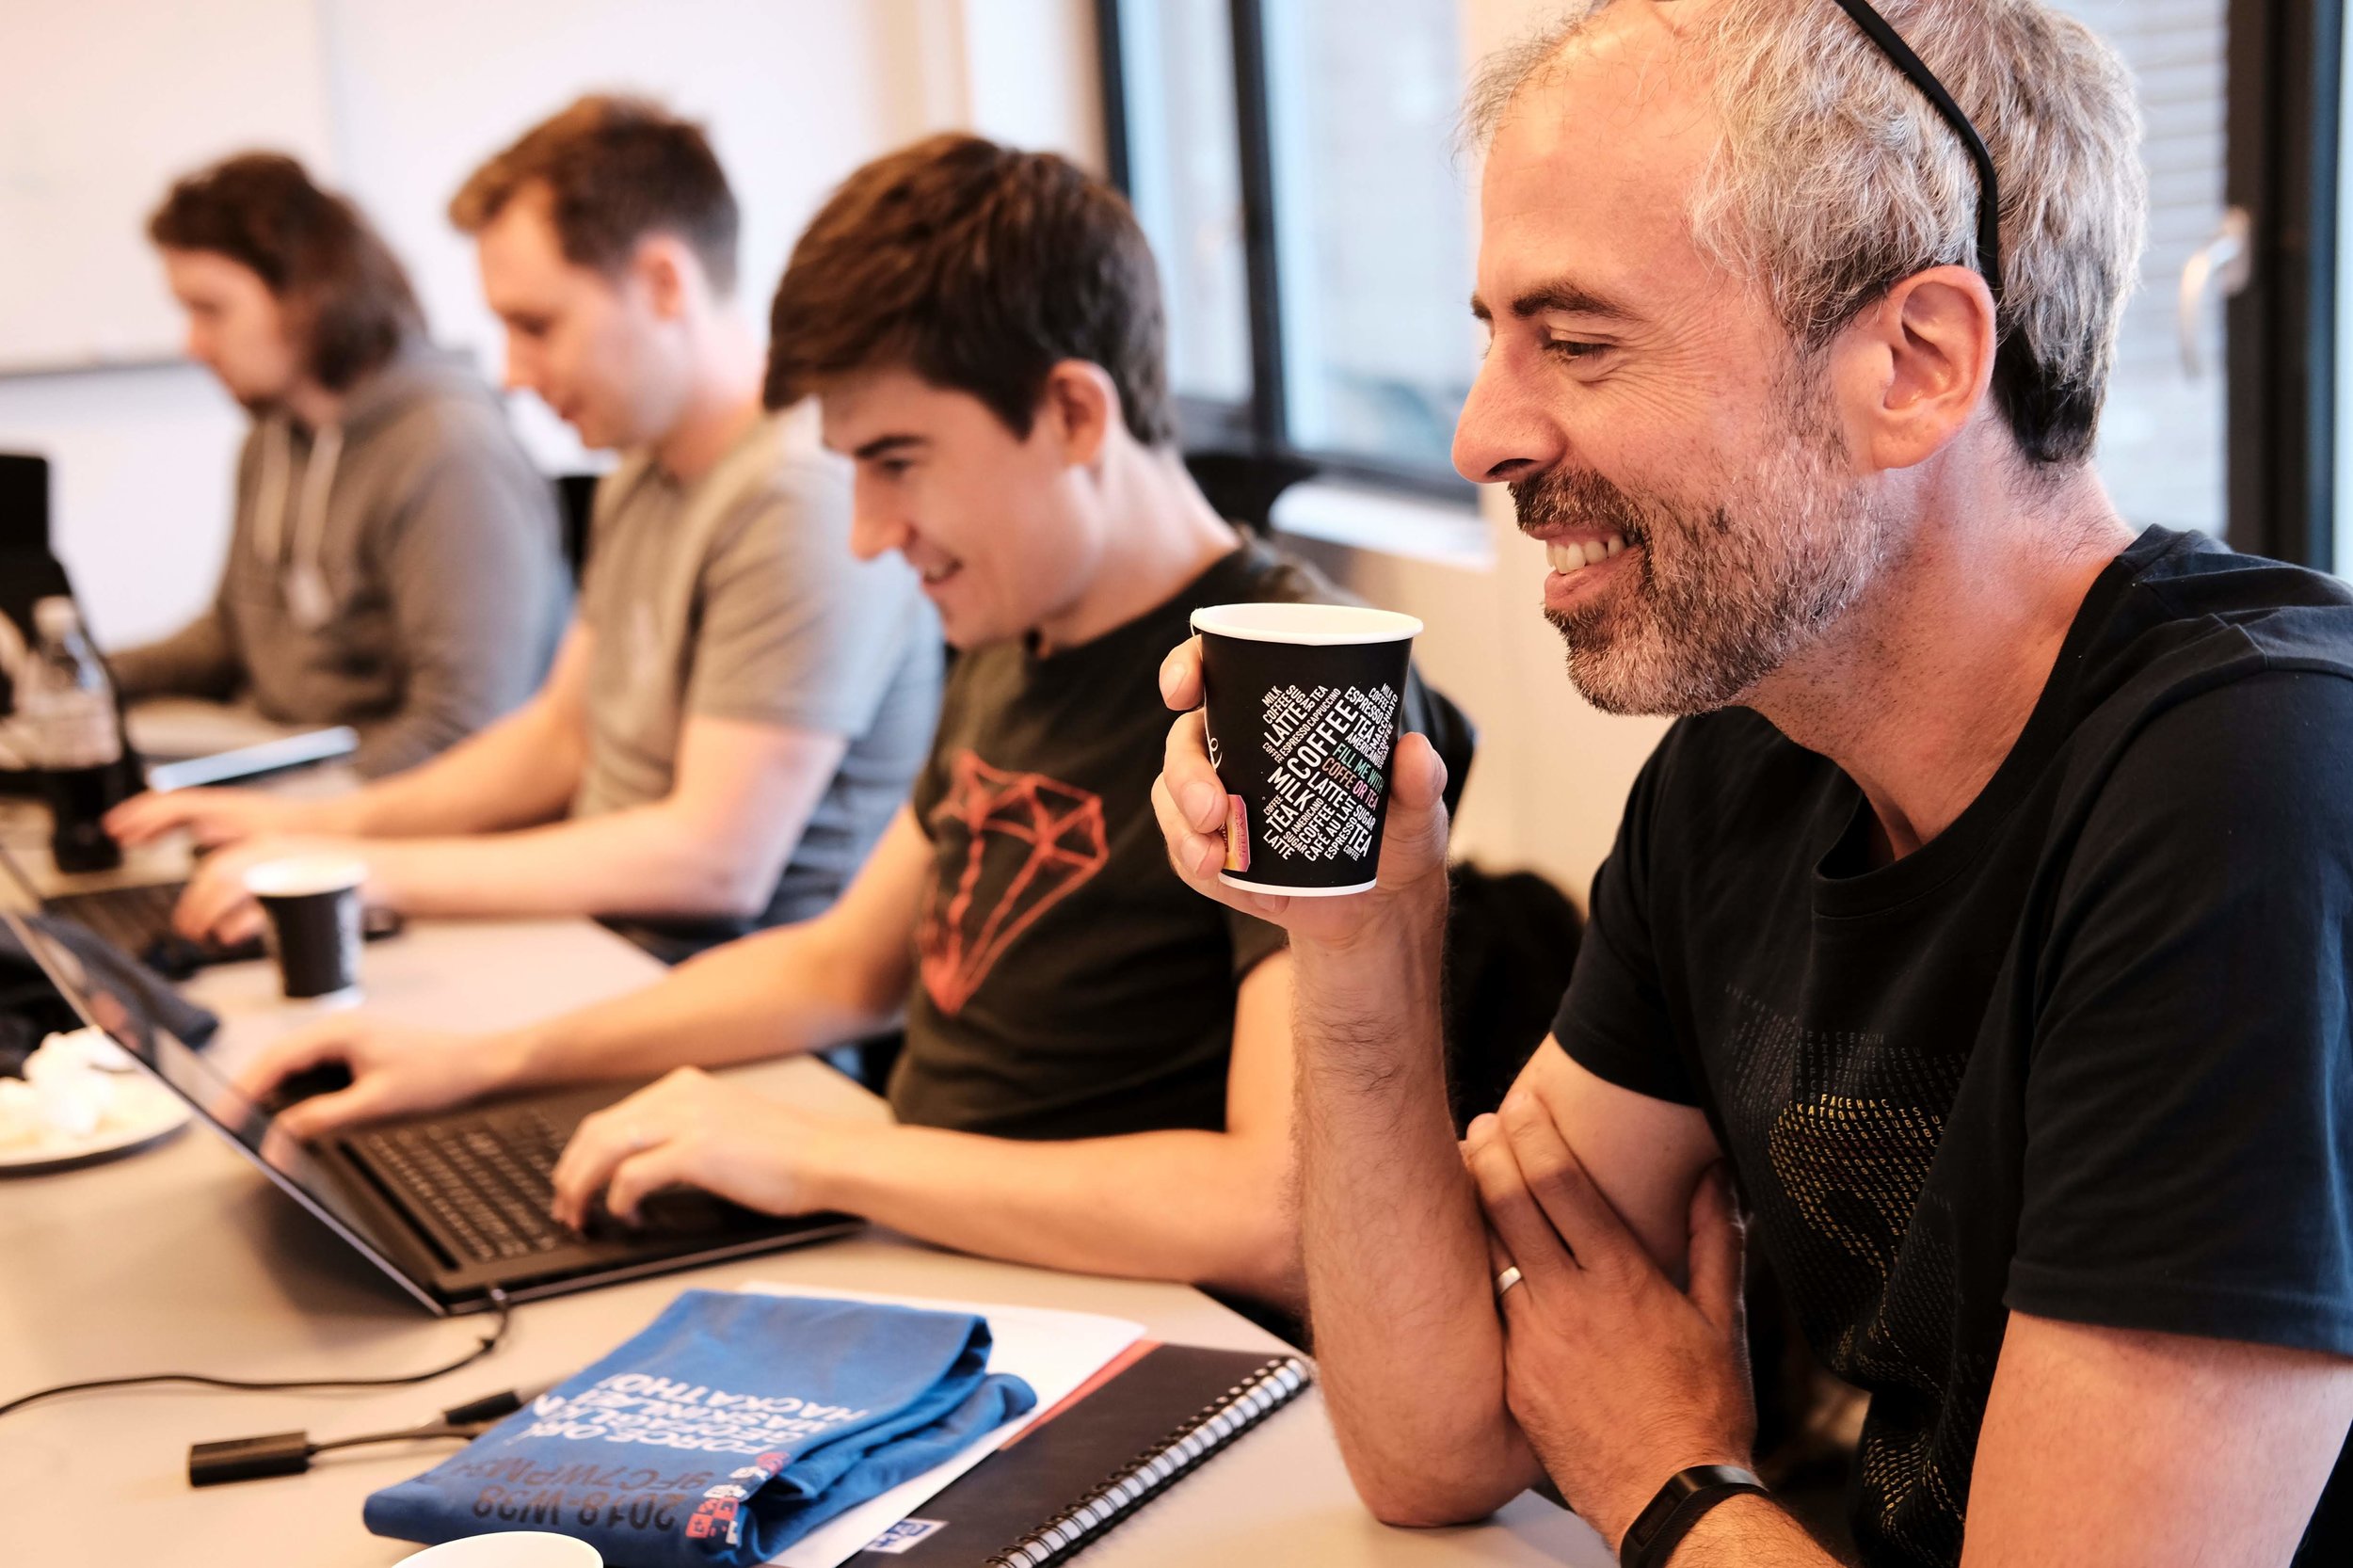
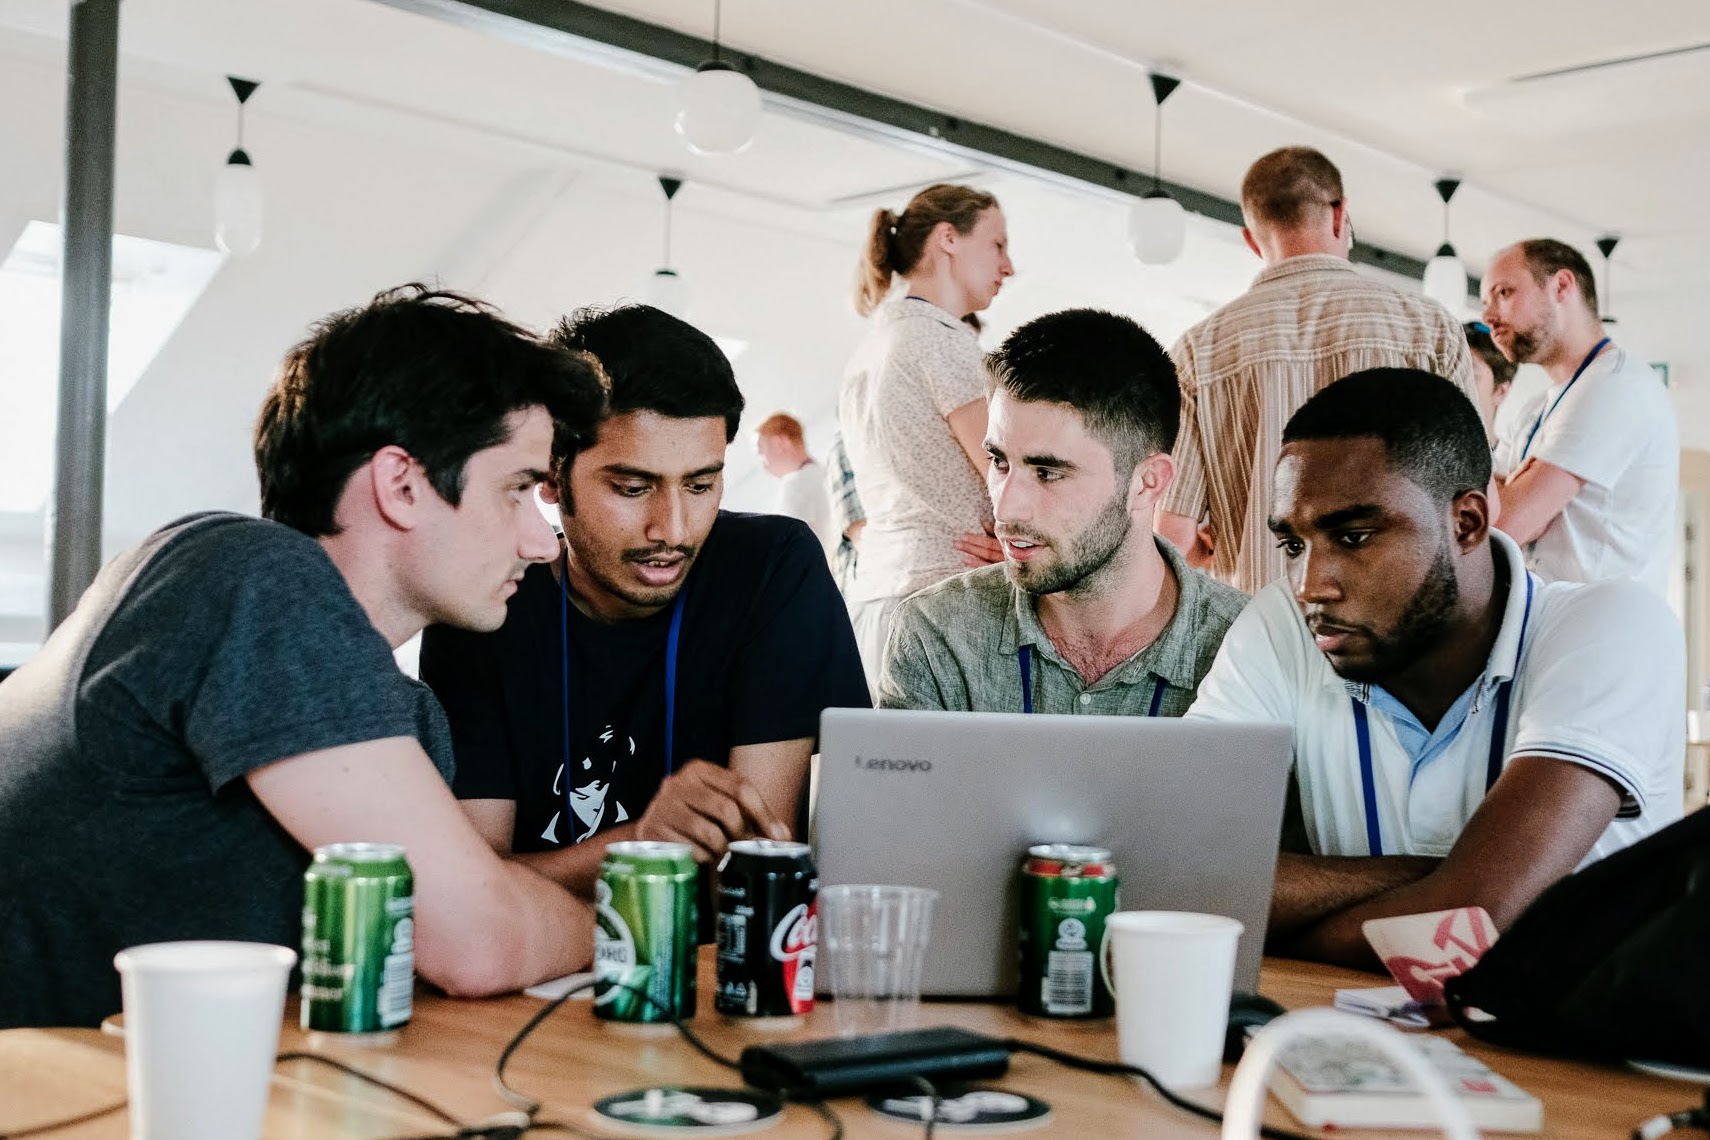
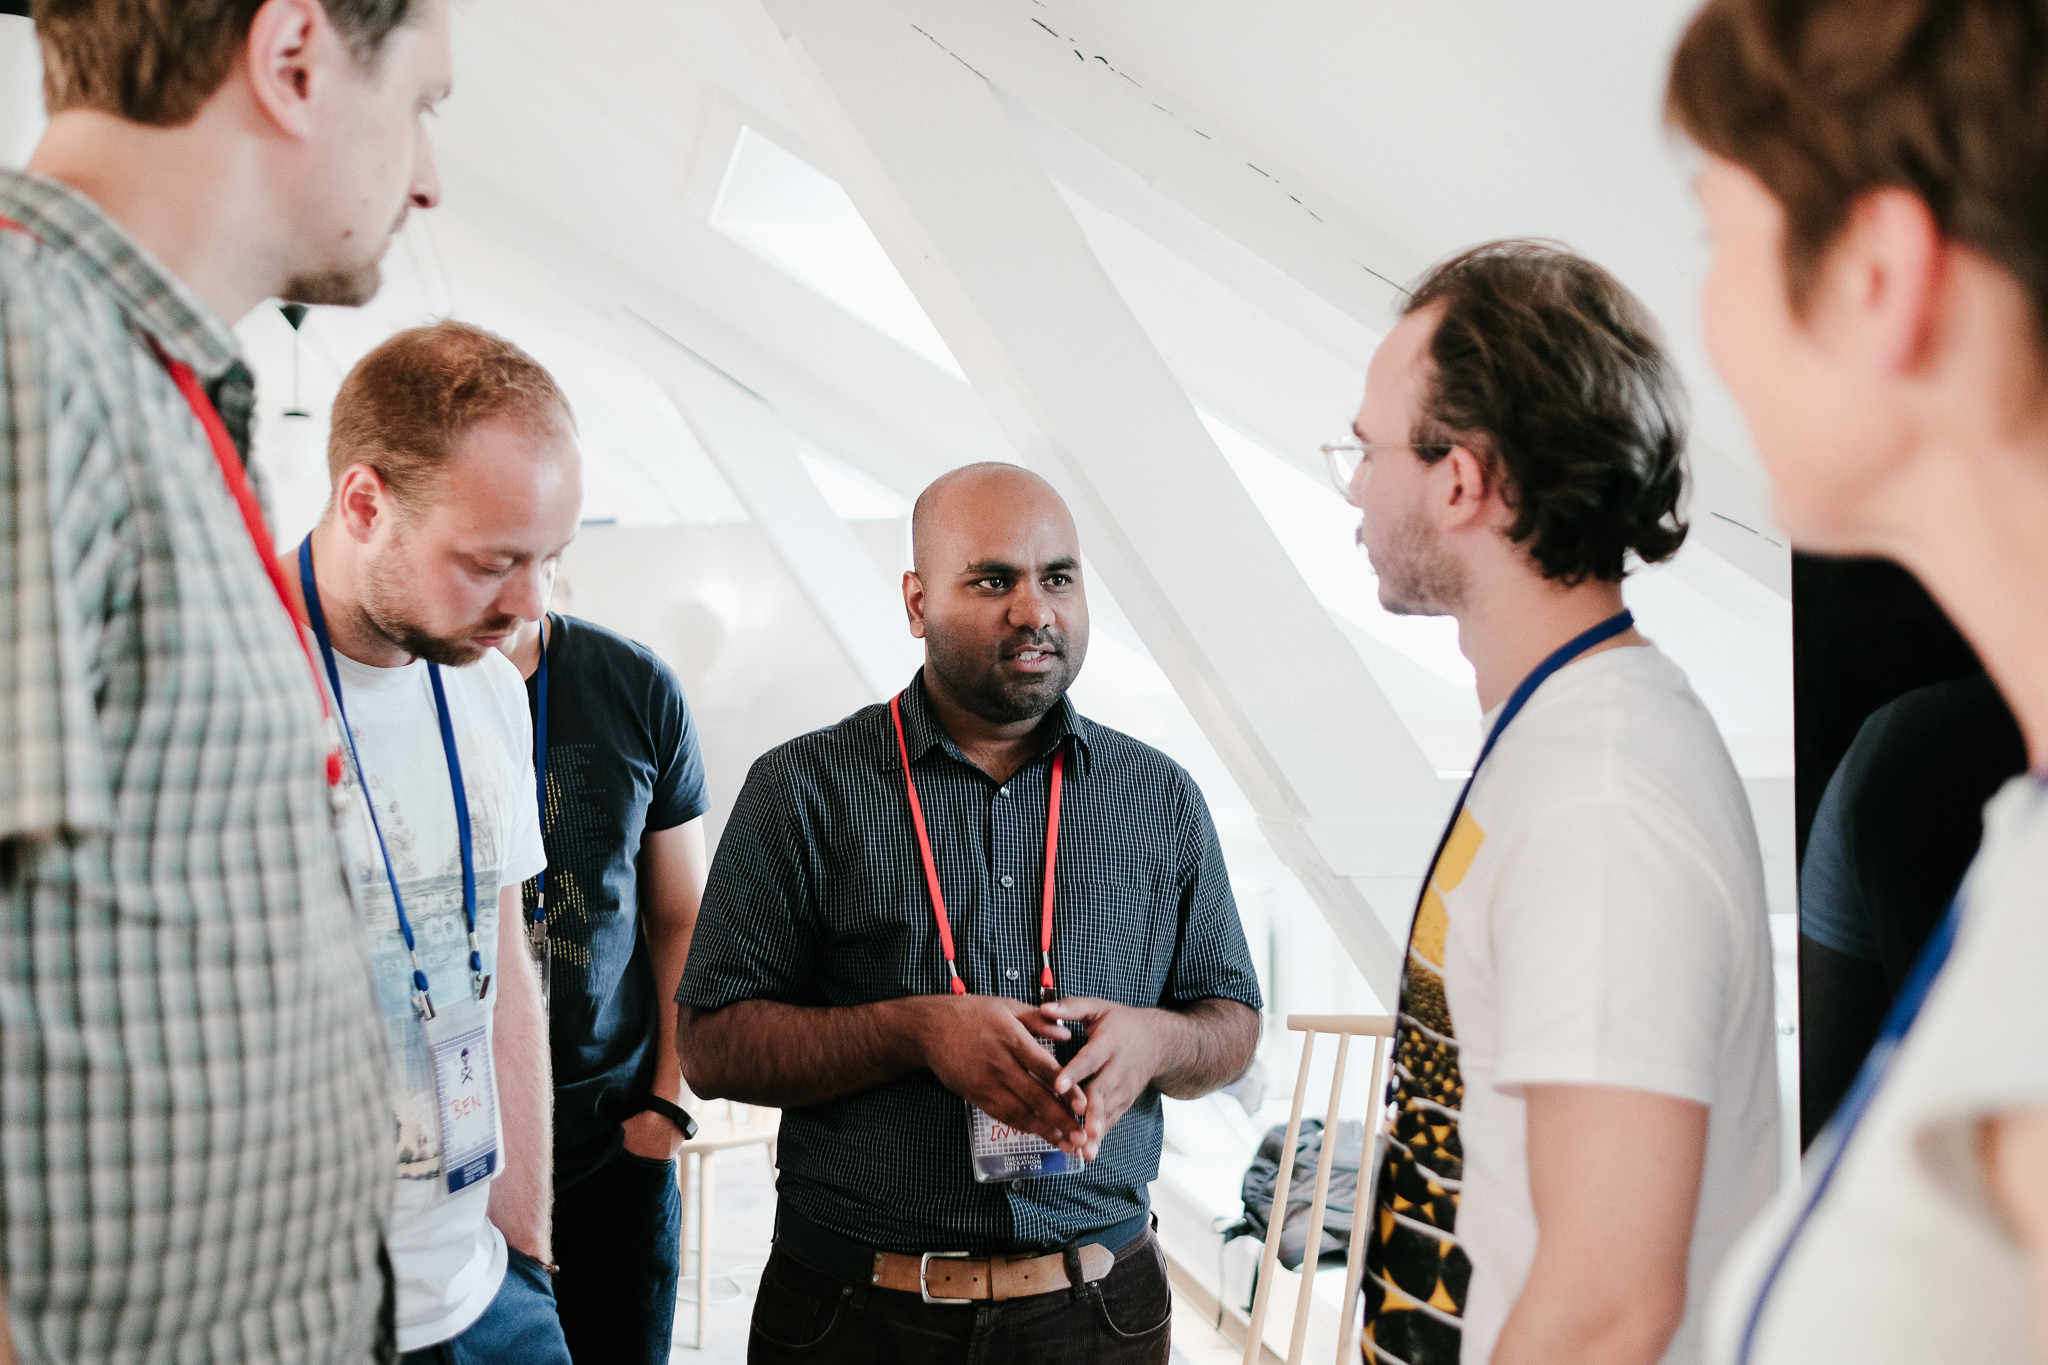
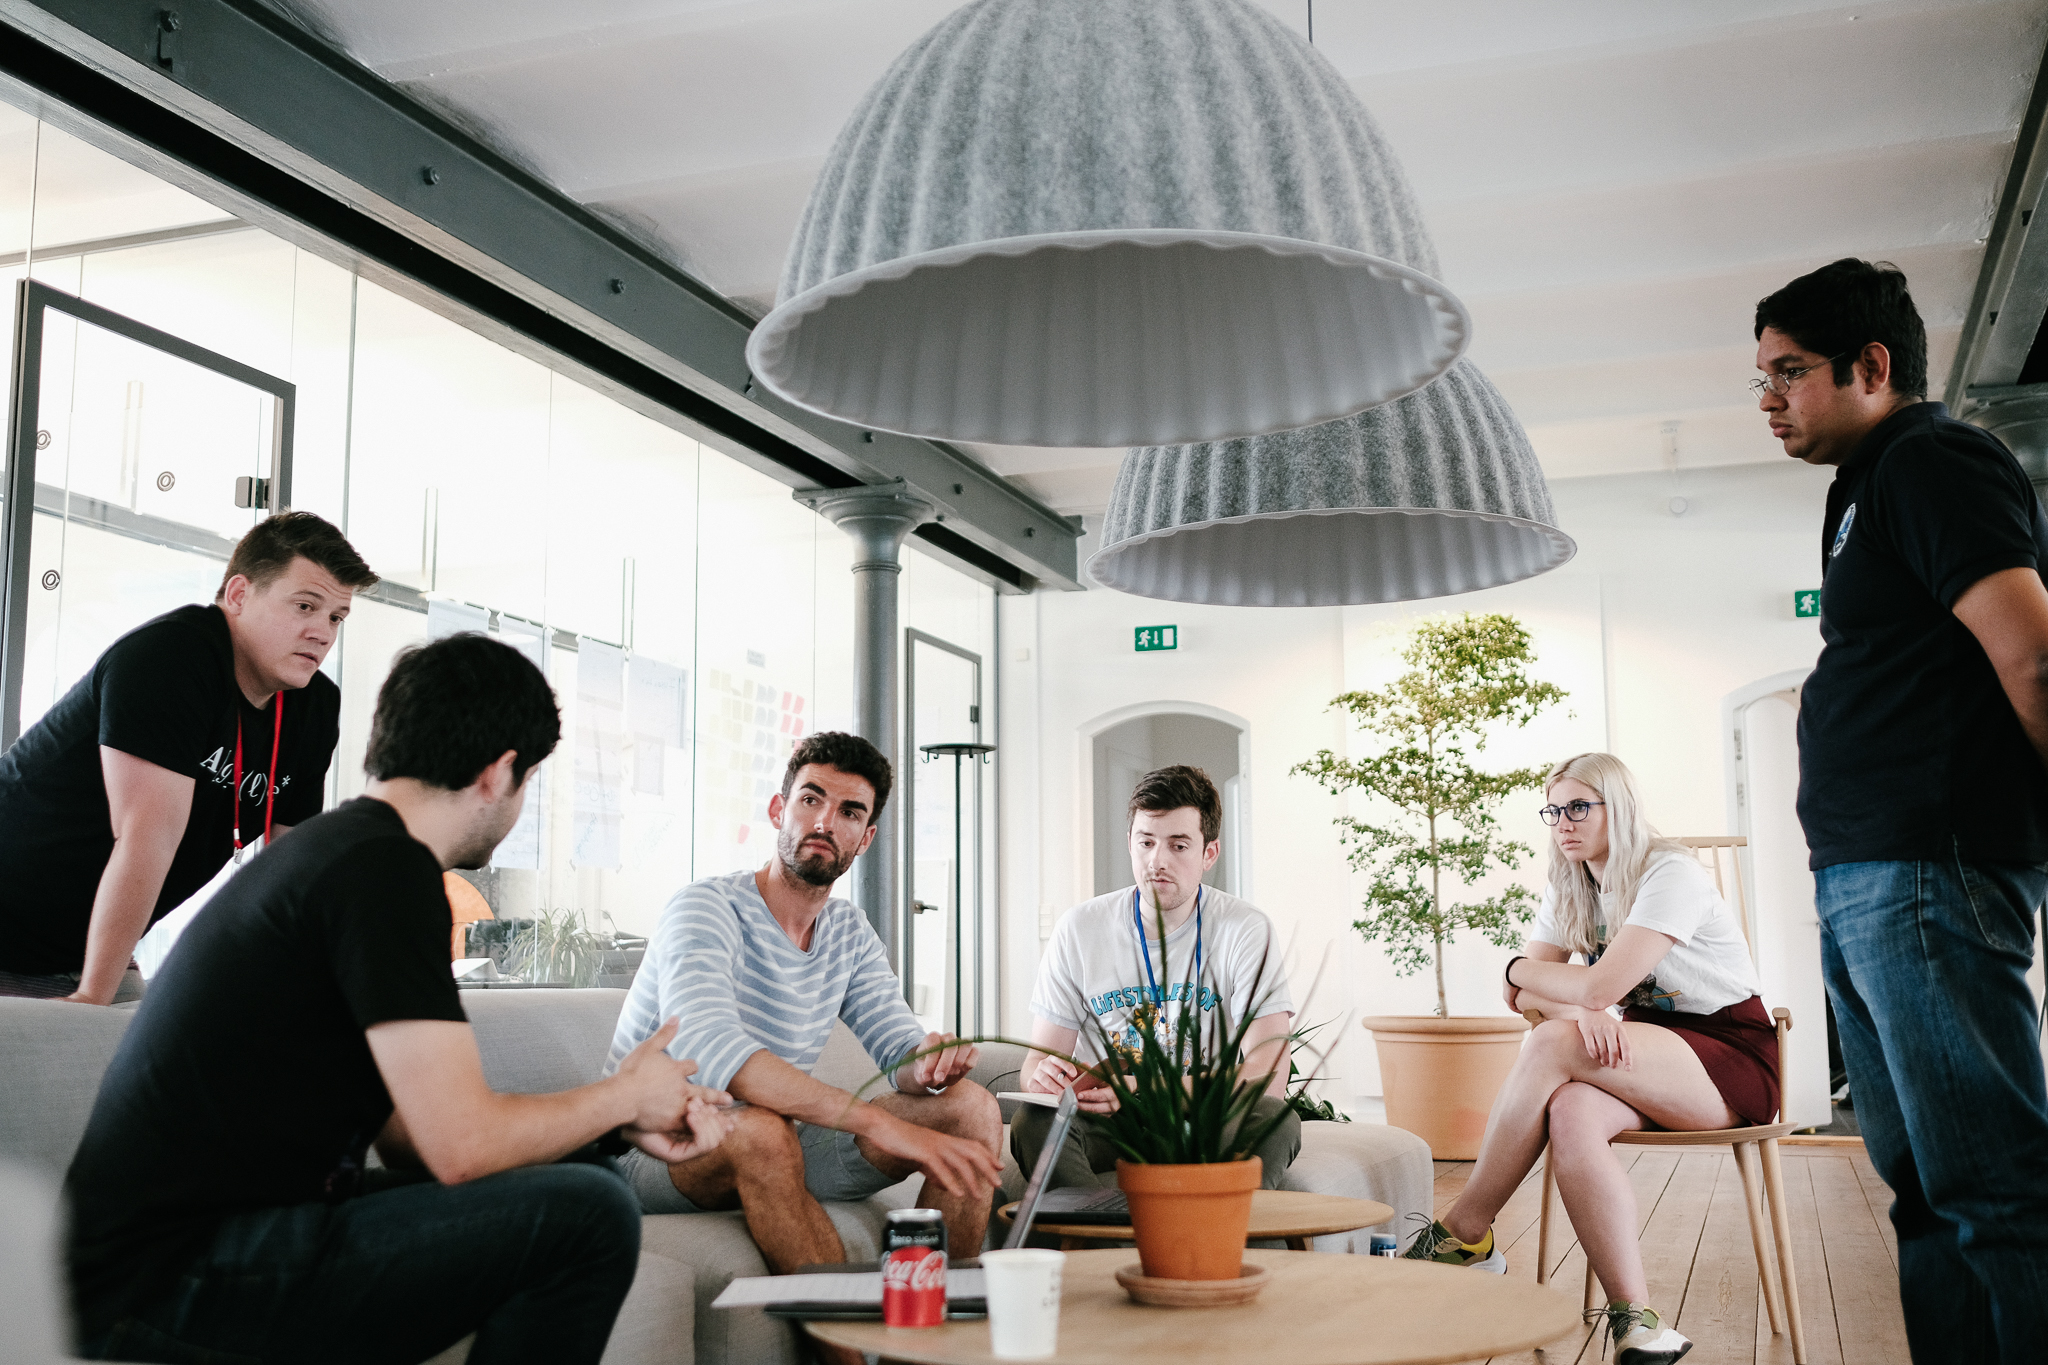
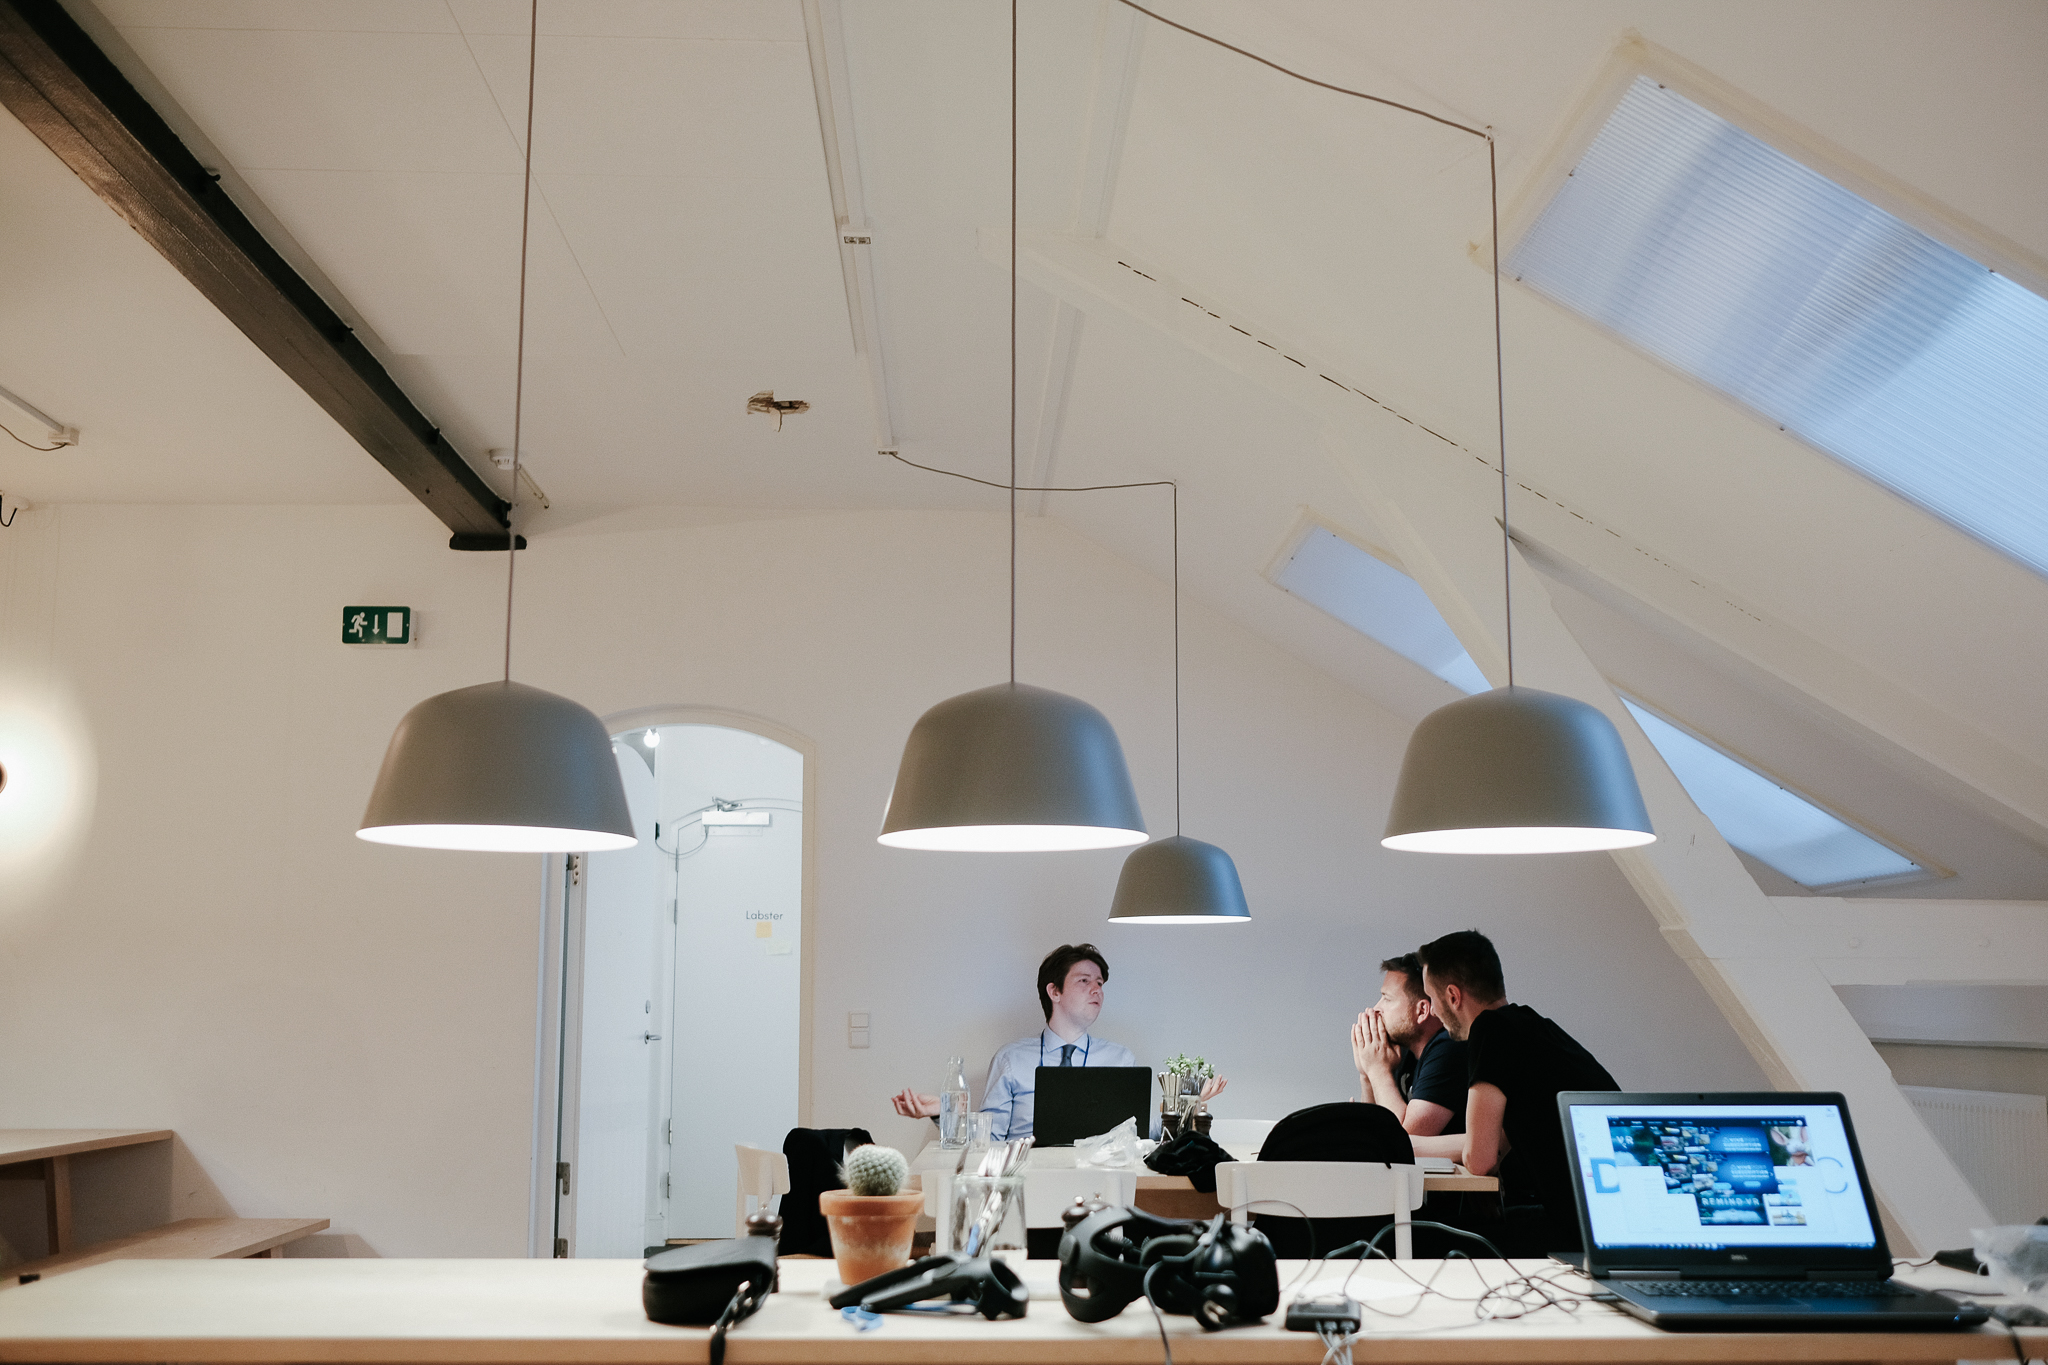
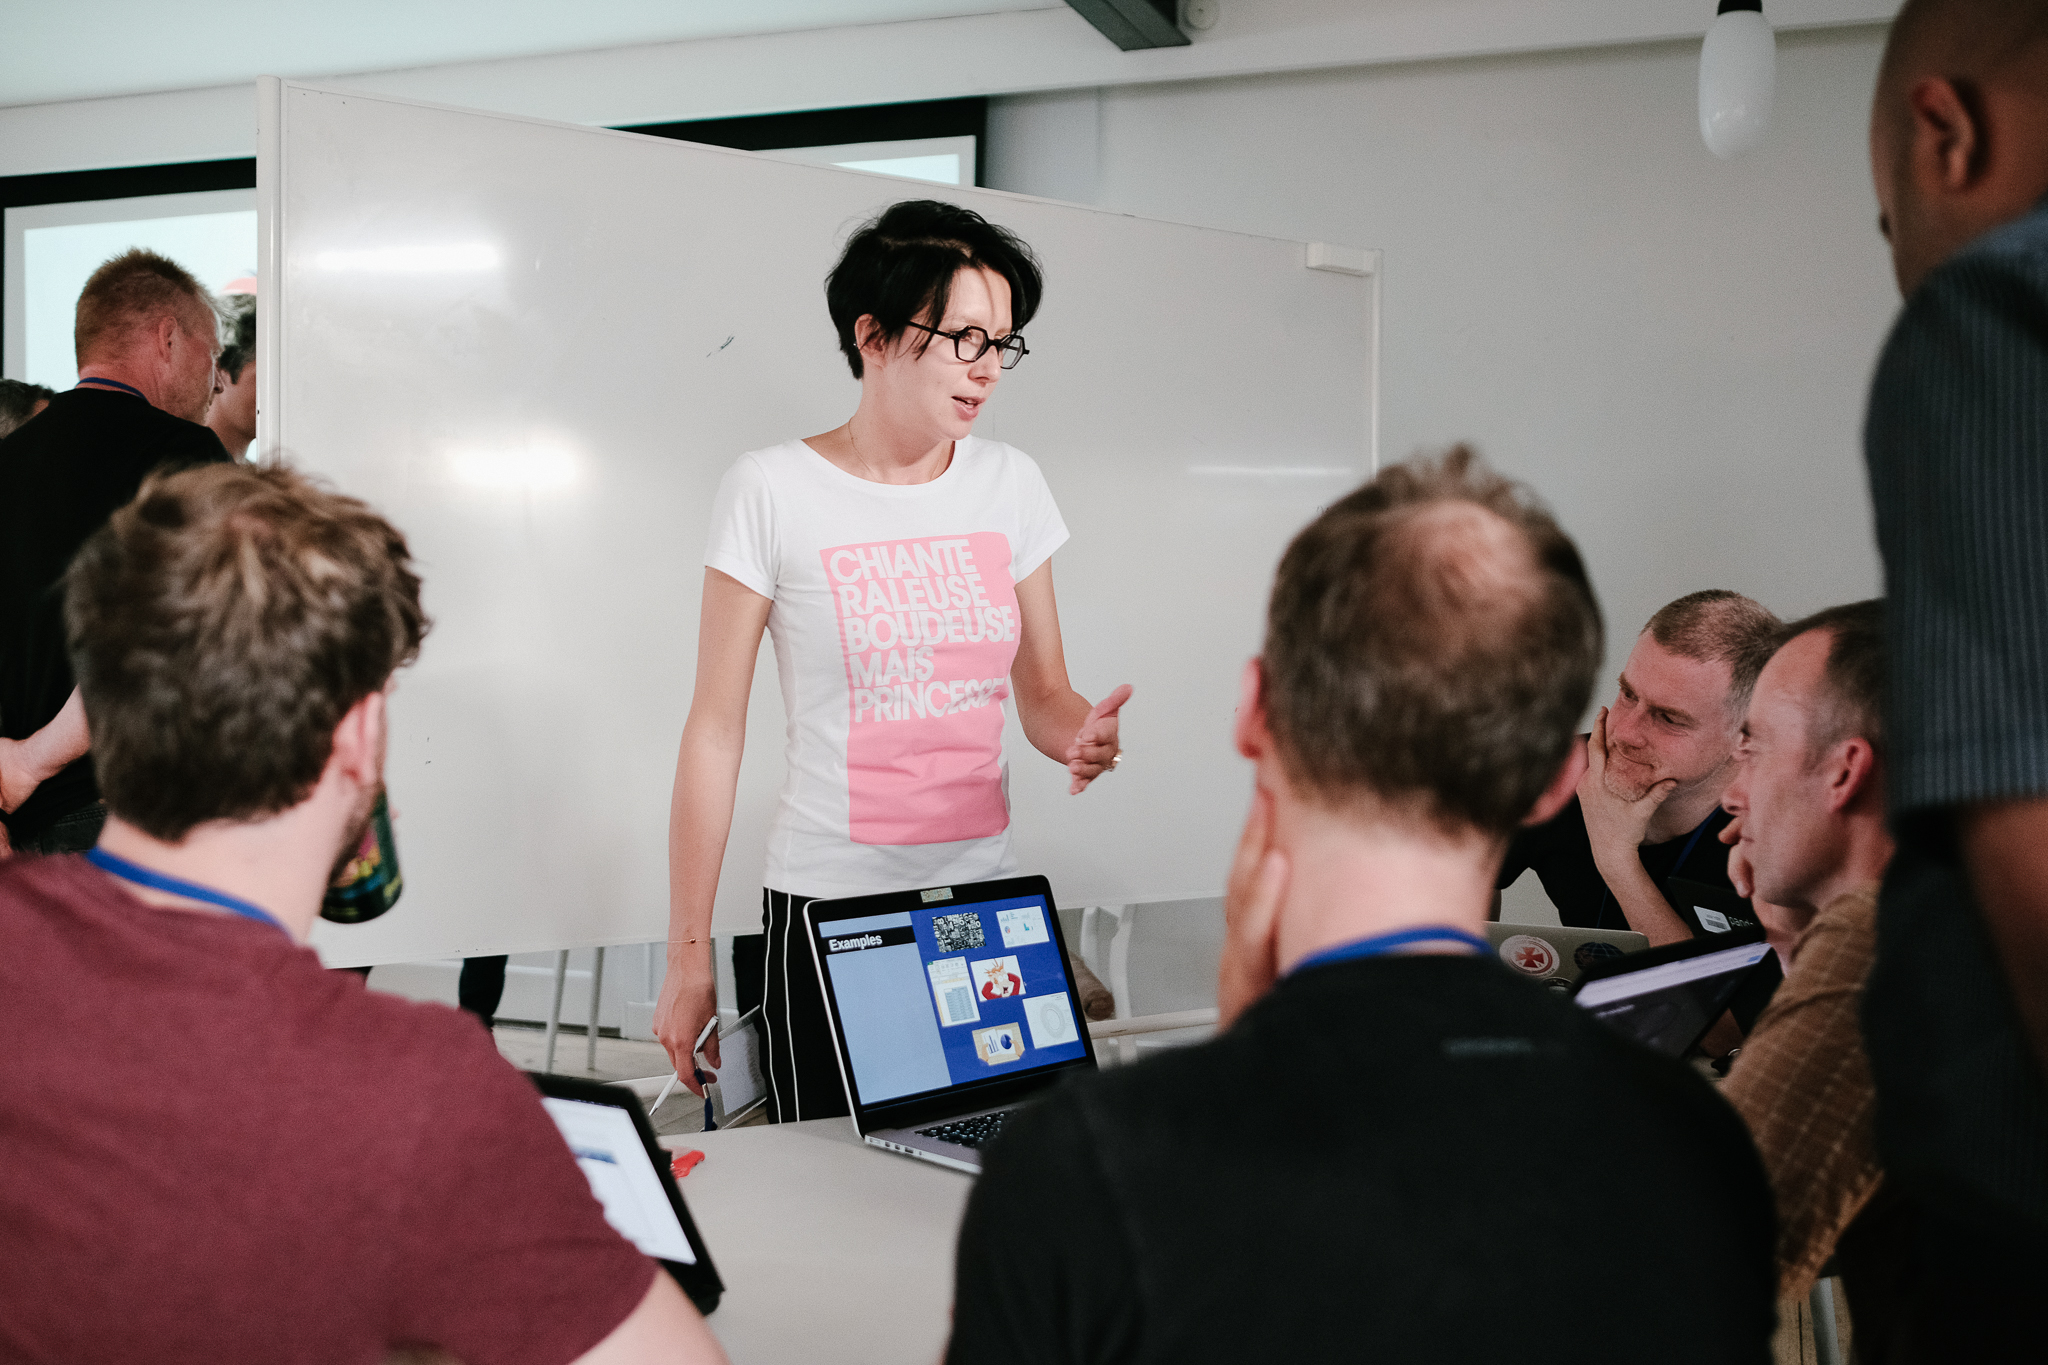
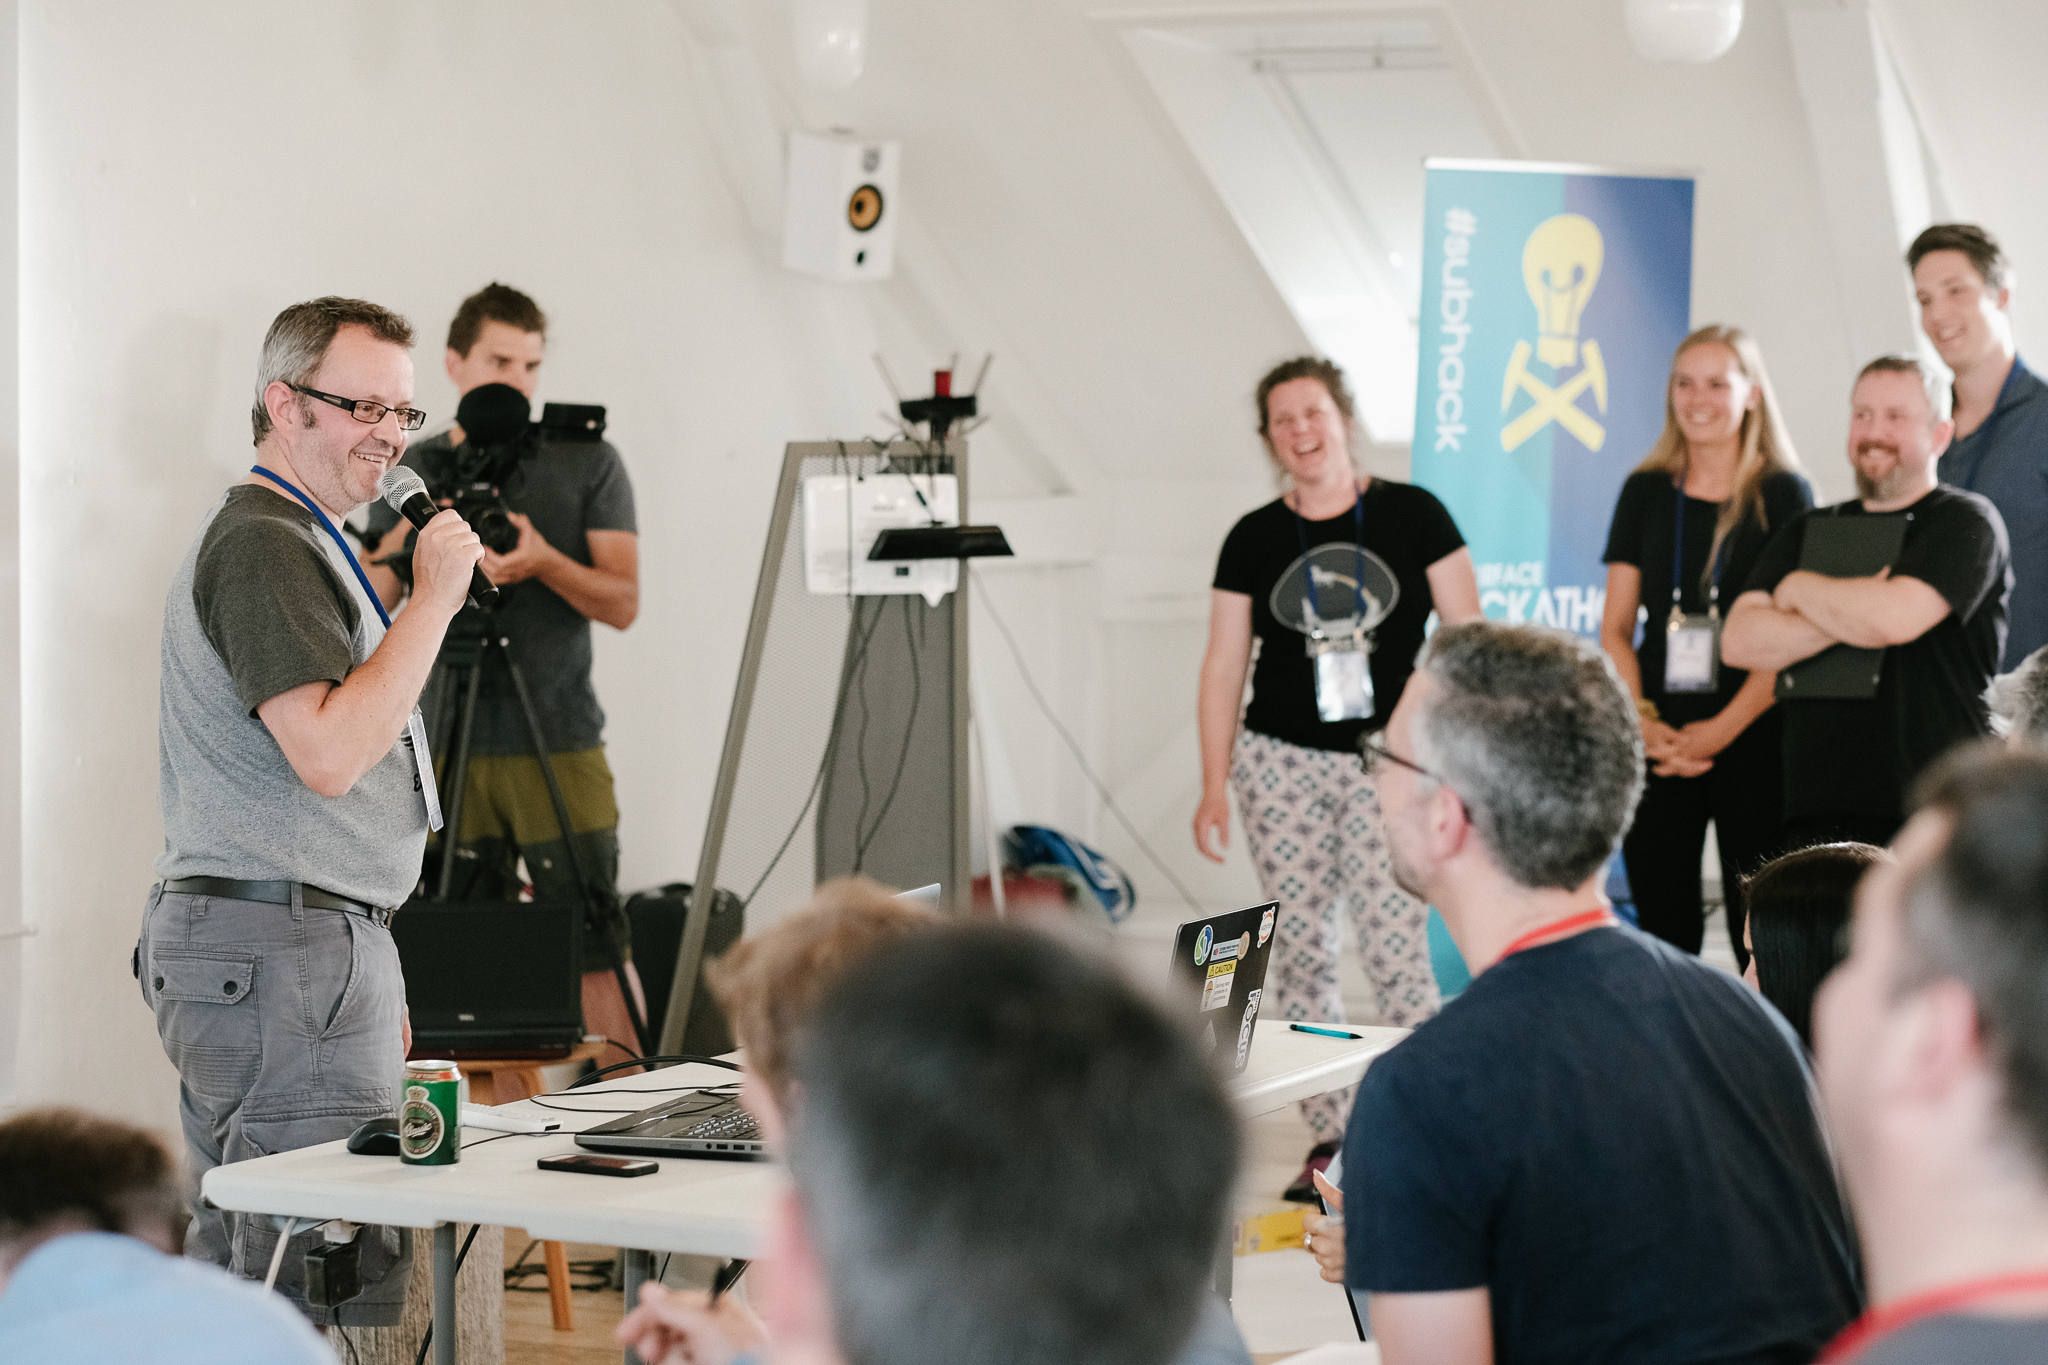
I’ll leave you with some more photos from the event. Enjoy!

FORCE ML Hackathon: project round-up

The FORCE Machine Learning Hackathon last week generated hundreds of new relationships and nine new projects, including seven new open source tools. Here’s the full run-down, in no particular order…


Predicting well rates in real time

Team Virtual Flow Metering: Nils Barlaug, Trygve Karper, Stian Laagstad, Erlend Vollset (all from Cognite) and Emil Hansen (AkerBP).

Tech: Cognite Data Platform, scikit-learn. GitHub repo.

Project: An engineer from AkerBP brought a problem: testing the rate from a well reduces the pressure and therefore reduces the production rate for a short time, costing about $10k per day. His team investigated whether they could instead predict the rate from other known variables, thereby reducing the number of expensive tests.

This project won the Most Commercial Potential award.

The predicted flow rate (blue) compared to the true flow rate (orange). The team used various models, from multilinear regression to boosted trees.


Reinforcement learning tackles interpretation

Team Gully Attack: Steve Purves, Eirik Larsen, JB Bonas (all Earth Analytics), Aina Bugge (Kalkulo), Thormod Myrvang (NTNU), Peder Aursand (AkerBP).

Tech: keras-rl. GitHub repo.

Project: Deep reinforcement learning has proven adept at learning, and winning, games, and at other tasks including image segmentation. The team tried training an agent to pick these channels in the Parihaka 3D, as well as some other automatic interpretation approaches.

The agent learned something, but in the end it did not prevail. The team learned lots, and did prevail!

This project won the Most Creative Idea award.

Early in training, the learning agent wanders around the image (top left). After an hour of training, the agent tends to stick to the gullies (right).


A new kind of AVO crossplot?

Team ASAP: Per Avseth (Dig), Lucy MacGregor (Rock Solid Images), Lukas Mosser (Imperial), Sandeep Shelke (Emerson), Anders Draege (Equinor), Jostein Heredsvela (DEA), Alessandro Amato del Monte (ENI).

Tech: t-SNE, UMAP, VAE. GitHub repo.

Project: If you were trying to come up with a new approach to AVO analysis, these are the scientists you’d look for. The idea was to reduce the dimensionality of the input traces — using first t-SNE and UMAP then a VAE. This resulted in a new 2-space in which interesting clusters could be probed, chiefly by processing synthetics with known variations (e.g. in thickness or porosity).

This project won the Best In Show award. Look out for the developments that come from this work!

Top: Illustration of the variational autoencoder, which reduces the input data (top left) into some abstract representation — a crossplot, essentially (top middle) — and can also reconstruct the data, but without the features that did not discriminate between the datasets, effectively reducing noise (top right).

The lower image shows the interpreted crossplot (left) and the implied distribution of rock properties (right).


Acquiring seismic with crayons

Team: Jesper Dramsch (Technical University of Denmark), Thilo Wrona (University of Bergen), Victor Aare (Schlumberger), Arno Lettman (DEA), Alf Veland (NPD).

Tech: pix2pix GAN (TensorFlow). GitHub repo.

Project: Not everything tht looks like a toy is a toy. The team spent a few hours drawing cartoons of small seismic sections, then re-trained the pix2pix GAN on them. The result — an app (try it!) that turns sketches into seismic!

This project won the People’s Choice award.

A sketch of a salt diapir penetrating geological layers (left) and the inferred seismic expression, generated by the neural network. In principal, the model could also be trained to work in the other direction.

A sketch of a salt diapir penetrating geological layers (left) and the inferred seismic expression, generated by the neural network. In principal, the model could also be trained to work in the other direction.


Extracting show depths and confidence from PDFs

Team: Florian Basier (Emerson), Jesse Lord (Kadme), Chris Olsen (ConocoPhillips), Anne Estoppey (student), Kaouther Hadji (Accenture).

Tech: sklearn, PyPDF2, NLTK, JavaScript. GitHub repo.

Project: A couple of decades ago, the last great digital revolution gave us PDFs. Lots of PDFs. But these pseudodigital documents still need to be wrangled into Proper Data. This team took on that project, trying in particular to extract both the depth of a show, and the confidence in its identification, from well reports.

This project won the Best Presentation award.

Kaouther Hadji (left), Florian Basier, Jesse Lord, and Anne Estoppey (right).

Kaouther Hadji (left), Florian Basier, Jesse Lord, and Anne Estoppey (right).


Grain size and structure from core images

Team: Eirik Time, Xiaopeng Liao, Fahad Dilib (all Equinor), Nathan Jones (California Resource Corp), Steve Braun (ExxonMobil), Silje Moeller (Cegal).

Tech: sklearn, skimage, fast.ai. GitHub repo.

Project: One of the many teams composed of professionals from all over the industry — it’s amazing to see this kind of collaboration. The team did a great job of breaking the problem down, going after what they could and getting some decent results. An epic task, but so many interesting avenues — we need more teams on these problems!

The pipeline was as ambitious as it looks. But this is a hard problem that will take some time to get good at. Kudos to this team for starting to dig into it and for making amazing progress in just 2 days.


Learning geological age from bugs

Team: David Wade (Equinor), Per Olav Svendsen (Equinor), Bjoern Harald Fotland (Schlumberger), Tore Aadland (University of Bergen), Christopher Rege (Cegal).

Tech: scikit-learn (random forest). GitHub repo.

Project: The team used DEX files from five wells from the recently released Volve dataset from Equinor. The goal was to learn to predict geological age from biostratigraphic species counts. They made substantial progress — and highlighted what a great resource Volve will be as the community explores it and publishes results like these.

David Wade and Per Olav Svendsen of Equinor (top), and some results (bottom)


Lost in 4D space!

Team: Andres Hatloey, Doug Hakkarinen, Mike Brhlik (all ConocoPhillips), Espen Knudsen, Raul Kist, Robin Chalmers (all Cegal), Einar Kjos (AkerBP).

Tech: scikit-learn (random forest regressor). GitHub repo.

Project: Another cross-industry collaboration. In their own words, the team set out to “identify trends between 4D seismic and well measurements in order to calculate reservoir pressures and/or thickness between well control”. They were motivated by real data from Valhall, and did a great job making sense of a lot of real-world data. One nice innovation: using the seismic quality as a weighting factor to try to understand the role of uncertainty. See the team’s presentation.

4D-pressure.png

Clustering reveals patterns in 4D maps

Team: Tetyana Kholodna, Simon Stavland, Nithya Mohan, Saktipada Maity, Jone Kristoffersen Bakkevig (all CapGemini), Reidar Devold Midtun (ConocoPhillips).

Project: The team worked on real 4D data from an operating field. Reidar provided a lot of maps computed with multiple seismic attributes. Groups of maps represent different reservoir layers, and thirteen different time-lapse acquisitions. So… a lot of maps. The team attempted to correlate 4D effects across all of these dimensions — attributes, layers, and production time. Reidar, the only geoscientist on a team of data scientists, also provided one of the quotes of the hackathon: “I’m the geophysicist, and I represent the problem”.

4D-layers.png

That’s it for the FORCE Hackathon for 2018. I daresay there may be more in the coming months and years. If they can build on what we started last week, I think more remarkable things are on the way!


all_small.png

One more thing…

I mentioned the UK hackathons last time, but I went and forgot to include the links to the events. So here they are again, in case you couldn’t find them online…

What are you waiting for? Get signed up and tell your friends!

Machine learning goes mainstream

At our first machine-learning-themed hackathon, in New Orleans in 2015, we had fifteen hackers. TImes were hard in the industry. Few were willing or able to compe out and play. Well, it’s now clear that times have changed! After two epic ML hacks last year (in Paris and Houston), at which we hosted about 115 scientists, it’s clear this year is continuing the trend. Indeed, by the end of 2018 we expect to have welcomed at least 240 more digital scientists to hackathons in the US and Europe.

Conclusion: something remarkable is happening in our field.

The FORCE hackathon

Last Tuesday and Wednesday, Agile co-organized the FORCE Machine Learning Hackathon in Stavanger, Norway. FORCE is a cross-industry geoscience organization, coordinating meetings and research in subsurface. The event preceeded a 1-day symposium on the same theme: machine learning in geoscience. And it was spectacular.

Get a flavour of the spectacularness in Alessandro Amato’s beautiful photographs:

Fifty geoscientists and engineers spent two days at the Norwegian Petroleum Directorate (NPD) in Stavanger. Our hosts were welcoming, accommodating, and generous with the waffles. As usual, we gently nudged the participants into teams, and encouraged them to define projects and find data to work on. It always amazes me how smoothly this potentially daunting task goes; I think this says something about the purposefulness and resourcefulness of our community.

Here’s a quick run-down of the projects:

  • Biostrat! Geological ages from species counts.

  • Lost in 4D Space. Pressure drawdown prediction.

  • Virtual Metering. Predicting wellhead pressure in real time.

  • 300 Wells. Extracting shows and uncertainty from well reports.

  • AVO ML. Unsupervised machine learning for more geological AVO.

  • Core Images. Grain size and lithology from core photos.

  • 4D Layers. Classification engine for 4D seismic data.

  • Gully Attack. Strat trap picking with deep reinforcement learning.

  • sketch2seis. Turning geological cartoons into seismic with pix2pix.

I will do a complete review of the projects in the coming few days, but notice the diversity here. Five of the projects straddle geological topics, and five are geophysical. Two or three involve petroleum engineering issues, while two or three move into sed/strat. We saw natural language processing. We saw random forests. We saw GANs, VAEs, and deep reinforcement learning. In terms of input data, we saw core photos, PDF reports, synthetic seismograms, real-time production data, and hastily assembled label sets. In short — we saw everything.

Takk skal du ha

Many thanks to everyone that helped the event come together:

  • Peter Bormann, the mastermind behind the symposium, was instrumental in making the hackathon happen.

  • Grete Block Vargle (AkerBP) and Pernille Hammernes (Equinor) kept everyone organized and inspired.

  • Tone Helene Mydland (NPD) and Soelvi Amundrud (NPD) made sure everything was logistically honed.

  • Eva Halland (NPD) supported the event throughout and helped with the judging.

  • Alessandro Amato del Monte (Eni) took some fantastic photos — as seen in this post.

  • Diego Castaneda and Rob Leckenby helped me on the Agile side of things, and helped several teams.

And a huge thank you to the sponsors of the event — too many to name, but here they all are:

all_small.png

There’s more to come!

If you’re reading this thinking, “I’d love to go to a geoscience hackathon”, and you happen to live in or near the UK, you’re in luck! There are two machine learning geoscience hackathons coming up this fall:

Don’t miss out! Get signed up and we’ll see you there.

What is a sprint?

In October we're hosting our first 'code sprint'! What is that?

A code sprint is a type of hackathon, in which efforts are focused around a small number of open source projects. They are related to, but not really the same as, sprints in the Scrum software development framework. They are non-competitive — the only goal is to improve the software in question, whether it's adding functionality, fixing bugs, writing tests, improving documentation, or doing any of the other countless things that good software needs. 

On 13 and 14 October, we'll be hacking on 3 projects:

  • Devito: a high-level finite difference library for Python. Devito featured in three Geophysical Tutorials at the end of 2017 and beginning of 2018 (see Witte et al. for Part 3). The project needs help with code, tests, model examples, and documentation. There will be core devs from the project at the sprint. GitHub repo is here.
  • Bruges: a simple collection of Python functions representing basic geophysical equations. We built this library back in 2015, and have been chipping away ever since. It needs more equations, better docs, and better tests — and the project is basic enough for anyone to contribute to it, even a total Python newbie. GitHub repo is here.
  • G3.js: a JavaScript wrapper for D3.js, a popular plotting toolkit for web developers. When we tried to adapt D3.js to geoscience data, we found we wanted to simplify basic tasks like making vertical plots, and plotting raster-like data (e.g. seismic) with line plots on top (e.g. horizons). Experience with JavaScript is a must. GitHub repo is here.

The sprint will be at a small joint called MAZ Café Con Leche, located in Santa Ana about 10 km or 15 minutes from the Anaheim Convention Center where the SEG Annual Meeting is happening the following week.

Thank you, as ever, to our fantastic sponsors: Dell EMC and Enthought. These two companies are powered by amazing people doing amazing things. I'm very grateful to them both for being such enthusiastic champions of the change we're working for in our science and our industry. 

If you like the sound of spending the weekend coding, talking geophysics, and enjoying the best coffee in southern California, please join us at the Geophysics Sprint! Register on Eventbrite and we'll see you there.

Visualization in Copenhagen, part 2

In Part 1, I wrote about six of the projects teams contributed at the Subsurface Hackathon in Copenhagen in June. Today I want to tell you about the rest of them. 


A data exploration tool

Team GeoClusterFu...n: Dan Stanton (University of Leeds), Filippo Broggini (ETH Zürich), Francois Bonneau (Nancy), Danny Javier Tapiero Luna (Equinor), Sabyasachi Dash (Cairn India), Nnanna Ijioma (geophysicist). 

Tech: Plotly Dash. GitHub repo.

Project: The team set out to build an interactive web app — a totally new thing for all of them — to make interactive plots from data in a CSV. They ended up with the basis of a useful tool for exploring geoscience data. Project page.

Four sixths of the GeoClusterFu...n team cluster around a laptop.

Four sixths of the GeoClusterFu...n team cluster around a laptop.


AR outcrop on your phone

Team SmARt_OGs: Brian Burnham (University of Aberdeen), Tala Maria Aabø (Natural History Museum of Denmark), Björn Wieczoreck, Georg Semmler and Johannes Camin (GiGa Infosystems).

Tech: ARKit/ARCore, WebAR, Firebase. GitLab repo. 

Project: Bjørn and his colleagues from GiGa Infosystems have been at all the European hackathons. This time, he knew he wanted to get virtual outcrops on mobiles phones. He found a willing team, and they got it done! Project page.

Three views from the SmartOGs's video. See the full version.

Three views from the SmartOGs's video. See the full version.


Rock clusters in latent space

The Embedders: Lukas Mosser (Imperial College London), Jesper Dramsch (Technical University of Denmark), Ben Fischer (PricewaterhouseCoopers), Harry McHugh (DUG), Shubhodip Konar (Cairn India), Song Hou (CGG), Peter Bormann (ConocoPhillips).

Tech: Bokeh, scikit-learn, Multicore-TSNE. GitHub repo.

Project: There has been a lot of recent interest in the t-SNE algorithm as a way to reduce the dimensionality of complex data. The team explored its application to subsurface data, and found promising applications. Web page. Project page.

The Embeders built a web app to cluster the data in an LAS file. The clusters (top left) are generated by the t-SNE algorithm.

The Embeders built a web app to cluster the data in an LAS file. The clusters (top left) are generated by the t-SNE algorithm.


Fully mixed reality

Team Hands On GeoLabs: Will Sanger (Western Geco), Chance Sanger (Houston Museum of Fine Arts), Pierre Goutorbe (Total), Fernando Villanueva (Institut de Physique du Globe de Paris).

Project: Starting with the ambitious goal of combining the mixed reality of the Meta AR gear with the mixed reality of the Gempy sandbox, the team managed to display and interact with some seismic data in the AR headset, which  allows interaction with simple hand gestures. Project page.

The team demonstrate the Meta AR headset.

The team demonstrate the Meta AR headset.


Huge grids over the web

Team Grid Vizards: Fabian Kampe, Daniel Buse, Jonas Kopcsek, Paul Gabriel (all from GiGa Infosystems)

Tech: three.js. GitHub repo.

Project: Paul and his team wanted to visualize hundreds of millions or billions of grid cells — all in the browser. They ended up with about 20 million points working very smoothly, and impressed everyone. Project page.

grid_vizards.png

Interpreting RGB displays for spec decomp

Team: Florian Smit (Technical University of Denmark), Gijs Straathof (SGS), Thomas Gazzola (Total), Julien Capgras (Total), Steve Purves (Euclidity), Tom Sandison (Shell)

Tech: Python, react.js. GitHub repos: Client. Backend.

Project: Spectral decomposition is still a mostly quantitative tool, especially the interpretation of RGB-blended displays. This team set out to make intuitive, attractive forward models of the spectral response of wells. This should help interpret seismic data, and perhaps make more useful RGB displays too. Intriguing and promising work. Project page.

RGB_log.png

That's it for another year! Twelve new geoscience visualization projects — ten of them open source. And another fun, creative weekend for 63 geoscientists — all of whom left with new connections and new skills. All this compressed into one weekend. If you haven't experienced a hackathon yet, I urge you to seek one out.

I will leave you with two videos — and an apology. We are so focused on creating a memorable experience for everyone in the room, that we tend to neglect the importance of capturing what's happening. Early hackathons only had the resulting blog post as the document of record, but lately we've been trying to livestream the demos at the end. Our success has been, er, mixed... but they were especially wonky this time because we didn't have livestream maestro Gram Ganssle there. So, these videos exist, and are part of the documentation of the event, but they barely begin to convey the awesomeness of the individuals, the teams, or their projects. Enjoy them, but next time — you should be there!

Visualization in Copenhagen, part 1

CPH_blog_banner.png

It's finally here! The round-up of projects from the Subsurface Hacakthon in Copenhagen last month. This is the first of two posts presenting the teams and their efforts, in the same random order the teams presented them at the end of the event.


Subsurface data meets Pokemon Go

Team Geo Go: Karine Schmidt, Max Gribner, Hans Sturm (all from Wintershall), Stine Lærke Andersen (University of Copenhagen), Ole Johan Hornenes (University of Bergen), Per Fjellheim (Emerson), Arne Kjetil Andersen (Emerson), Keith Armstrong (Dell EMC). 

Project: With Pokemon Go as inspiration, the team set out to prototype a geoscience visualization app that placed interactive subsurface data elements into a realistic 3D environment.

180610_agile_scientific_78.jpg

Visualizing blind spots in data

Team Blind Spots: Jo Bagguley (UK Oil & Gas Authority), Duncan Irving (Teradata), Laura Froelich (Teradata), Christian Hirsch (Aalborg University), Sean Walker (Campbell & Walker Geophysics).

Tech: Flask, Bokeh, AWS for hosting app. GitHub repo.

Project: Data management always comes up as an issue in conversations about geocomputing, but few are bold enough to tackle it head on. This team built components for checking the integrity of large amounts of raw data, before passing it to data science projects. Project page.

Sean, Laura, and Christian. Jo and Duncan were out doing research. Note the kanban board in the background — agile all the way!

Sean, Laura, and Christian. Jo and Duncan were out doing research. Note the kanban board in the background — agile all the way!


Volume uncertainties visualization

Team Fortuna: Natalia Shchukina (Total), Behrooz Bashokooh (Shell), Tobias Staal (University of Tasmania), Robert Leckenby (now Agile!), Graham Brew (Dynamic Graphics), Marco van Veen (RWTH Aachen). 

Tech: Flask, Bokeh, Altair, Holoviews. GitHub repo.

Project: Natalia brought some data with her: lots of surface grids. The team built a web app to compute uncertainty sections and maps, then display them dynamically and interactively — eliciting audible gasps from the room. Project page.

The Fortuna app: Probability of being the the zone (left) and entropy (right). Cross-sections are shown at the top, maps on the bottom.


Differences and similarities with RGB blends

Team RGBlend: Melanie Plainchault and Jonathan Gallon (Total), Per Olav Svendsen, Jørgen Kvalsvik and Max Schuberth (Equinor).

Tech: Python, Bokeh. GitHub repo.

Project: One of the more intriguing ideas of the hackathon was not just so much a fancy visualization technique, as a novel way of producing a visualization — differencing 3 images and visualizing the differences in RGB space. It reminded me of an old blog post about the spot the difference game. Project page.

The differences (lower right) between three time-lapse seismic amplitude maps.

The differences (lower right) between three time-lapse seismic amplitude maps.


Augmented reality geological maps

Team AR Sandbox: Simon Virgo (RWTH Aachen), Miguel de la Varga (RWTH Aachen), Fabian Antonio Stamm (RWTH Aachen), Alexander Schaaf (University of Aberdeen).

Tech: Gempy. GitHub repo.

Project: I don't have favourite projects, but if I did, this would be it. The GemPy group had already built their sandbox when they arrived, but they extended it during the hackathon. Wonderful stuff. Project page.

magic box of sand: Sculpting a landscape (left), and the projected map (right). You can't even imagine how much fun it was to play with.


Augmented reality seismic wavefields

Team Sandbox Seismics: Yuriy Ivanov (NTNU Trondheim), Ana Lim (NTNU Trondheim), Anton Kühl (University of Copenhagen), Jean Philippe Montel (Total).

Tech: GemPy, Devito. GitHub repo.

Project: This team worked closely with Team AR Sandbox, but took it in a different direction. They instead read the velocity from the surface of the sand, then used devito to simulate a seismic wavefield propagating across the model, and projected that wavefield onto the sand. See it in action in my recent Code Show post. Project page.

Yuriy Ivanov demoing the seismic wavefield moving across the sandbox.


Pretty cool, right? As usual, all of these projects were built during the hackathon weekend, almost exclusively by teams that formed spontaneously at the event itself (I think one team was self-contained from the start). If you didn't notice the affiliations of the participants — go back and check them out; I think this might have been an unprecedented level of collaboration!

Next time we'll look at the other six projects. [UPDATE: Next post is here.]

Before you go, check out this awesome video Wintershall made about the event. A massive thank you to them for supporting the event and for recording this beautiful footage — and for agreeing to share it under a CC-BY license. Amazing stuff!

Code Show version 1.0

Last week we released Code Show version 1.0. In a new experiment, we teamed up with Total and the European Association of Geoscientists and Engineers at the EAGE Annual Conference and Exhibition in Copenhagen. Our goal was to bring a little of the hackathon to as many conference delegates as possible. We succeeded in reaching a few hundred people over the three days, making a lot of new friends in the process. See the action in this Twitter Moment.

What was on the menu?

The augmented reality sandbox that Simon Virgo and his colleagues brought from the University of Aachen. The sandbox displayed both a geological map generated by the GemPy 3D implicit geological modeling tool, as well as a seismic wavefield animation generated by the Devito modeling and inversion project. Thanks to Yuriy Ivanov (NTNU) and others in his hackathon team for contributing the seismic modeling component.  

Demos from the Subsurface Hackathon. We were fortunate to have lots of hackathon participants make time for the Code Show. Graham Brew presented the uncertainty visualizer his team built; Jesper Dramsch and Lukas Mosser showed off their t-SNE experiments; Florian Smit and Steve Purves demoed their RGB explorations; and Paul Gabriel shared the GiGa Infosystems projects in AR and 3D web visualization. Many thanks to those folks and their teams.

AR and VR demos by the Total team. Dell EMC provided HTC Vive and Meta 2 kits, with Dell Precision workstations, for people to try. They were a lot of fun, provoking several cries of disbelief and causing at least one person to collapse in a heap on the floor.

Python demos by the Agile team. Dell EMC also kindly provided lots more Dell Precision workstations for general use. We hooked up some BBC micro:bit microcontrollers, Microsoft Azure IoT DevKits, and other bits and bobs, and showed anyone who would listen what you can do with a few lines of Python. Thank you to Carlos da Costa (University of Edinburgh) for helping out!

Tech demos by engineers from Intel and INT. Both companies are very active in visualization research and generously spent time showing visitors their technology. 

The code show in full swing. 

The code show in full swing. 

v 2.0 next year... maybe?

The booth experience was new to us. Quite a few people came to find us, so it was nice to have a base, rather than cruising around as we usually do. I'd been hoping to get more people set up with Python on their own machines, but this may be too in-depth for most people in a trade show setting. Most were happy to see some new things and maybe tap out some Python on a keyboard.

Overall, I'd call it a successful experiment. If we do it next year in London, we have a very good idea of how to shape an even more engaging experience. I think most visitors enjoyed themselves this year though; If you were one of them, we'd love to hear from you!

Visualize this!

The Copenhagen edition of the Subsurface Hackathon is over! For three days during the warmest June in Denmark for over 100 years, 63 geoscientists and programmers cooked up hot code in the Rainmaking Loft, one of the coolest, and warmest, coworking spaces you've ever seen. As always, every one of the participants brought their A game, and the weekend flew by in a blur of creativity, coffee, and collaboration. And croissants.

Pierre enjoying the Meta AR headset that DEll EMC provided.

Pierre enjoying the Meta AR headset that DEll EMC provided.

Our sponsors have always been unusually helpful and inspiring, pushing us to get more audacious, but this year they were exceptionally engaged and proactive. Dell EMC, in the form of David and Keith, provided some fantastic tech for the teams to explore; Total supported Agile throughout the organization phase, and Wintershall kindly arranged for the event to be captured on film — something I hope to be able to share soon. See below for the full credit roll!

sponsors.png

During th event, twelve teams dug into the theme of visualization and interaction. As in Houston last September, we started the event on Friday evening, after the Bootcamp (a full day of informal training). We have a bit of process to form the teams, and it usually takes a couple of hours. But with plenty of pizza and beer for fuel, the evening flew by. After that, it was two whole days of coding, followed by demos from all of the teams and a few prizes. Check out some of the pictures:

Thank you very much to everyone that helped make this event happen! Truly a cast of thousands:

  • David Holmes of Dell EMC for unparallelled awesomeness.
  • The whole Total team, but especially Frederic Broust, Sophie Segura, Yannick Pion, and Laurent Baduel...
  • ...and also Arnaud Rodde for helping with the judging.
  • The Wintershall team, especially Andreas Beha, who also acted as a judge.
  • Brendon Hall of Enthought for sponsoring the event.
  • Carlos Castro and Kim Saabye Pedersen of Amazon AWS.
  • Mathias Hummel and Mahendra Roopa of NVIDIA.
  • Eirik Larsen of Earth Science Analytics for sponsoring the event and helping with the judging.
  • Duncan Irving of Teradata for sponsoring, and sorting out the T-shirts.
  • Monica Beech of Ikon Science for participating in the judging.
  • Matthias Hartung of Target for acting as a judge again.
  • Oliver Ranneries, plus Nina and Eva of Rainmaking Loft.
  • Christopher Backholm for taking such great photographs.

Finally, some statistics from the event:

  • 63 participants, including 8 women (still way too few, but 100% better than 4 out of 63 in Paris)
  • 15 students plus a handful of post-docs.
  • 19 people from petroleum companies.
  • 20 people from service and technology companies, including 7 from GiGa-infosystems!
  • 1 no-show, which I think is a new record.

I will write a summary of all the projects in a couple of weeks when I've caught my breath. In the meantime, you can read a bit about them on our new events portal. We'll be steadily improving this new tool over the coming weeks and months.

That's it for another year... except we'll be back in Europe before the end of the year. There's the FORCE Hackathon in Stavanger in September, then in November we'll be in Aberdeen and London running some events with the Oil and Gas Authority. If you want some machine learning fun, or are looking for a new challenge, please come along!

Simon Virgo (centre) and his colleagues in Aachen built an augmented reality sandbox, powered by their research group's software, Gempy. He brought it along and three teams attempted projects based on the technology. Above, some of the participants …

Simon Virgo (centre) and his colleagues in Aachen built an augmented reality sandbox, powered by their research group's software, Gempy. He brought it along and three teams attempted projects based on the technology. Above, some of the participants are having a scrum meeting to keep their project on track.


Looking forward to Copenhagen

We're in Copenhagen for the Subsurface Bootcamp and Hackathon, which start today, and the EAGE Annual Conference and Exhibition, which starts next week. Walking around the city yesterday, basking in warm sunshine and surrounded by sun-giddy Scandinavians, it became clear that Copenhagen is a pretty special place, where northern Europe and southern Europe seem to have equal influence.

The event this weekend promises to be the biggest hackathon yet. It's our 10th, so I think we have the format figured out. But it's only the third in Europe, the theme — Visualization and interaction — is new for us, and most of the participants are new to hackathons so there's still the thrill of the unknown! 

Many thanks to our sponsors for helping to make this latest event happen! Support these organizations: they know how to accelerate innovation in our industry.

sponsors.png

New events for UK

By the way, we just announced two new hackathons, one in London and one in Aberdeen, for the autumn. They are happening just before PETEX, the PESGB petroleum conference; find out more here. You can skill up for these events at some new courses, also just announced. The UK Oil and Gas Authority is offering our Intro to Geocomputing and Machine Learning class for free — apply here for a place. The courses are oversubscribed, so be sure to tell the OGA why you should get a place!

Code Show

There is a lot of other stuff happening at the EAGE exhibition this year — the HPC area, a new start-up area, and a digital transformation area which I hope is as bold as it sounds. Here's the complete schedule and some highlights:

There's lots of other stuff of course — EAGE has the most varied programme of any subsurface conference — but these are the sessions I'd be at if I had time to go to any sessions this year. But I won't because The hackathon is not all that's happening! Next week, starting on Tuesday, we're conducting a new experiment with the Code Show. In partnership with EAGE and Total, this is our attempt to bring some of the hackathon experience to everyone at EAGE. We'll be showing people the projects from the hackathon, talking to them about programming, and helping them get started on their own coding adventure. So if you're at EAGE, swing by Booth #1830 and say Hi.

Weekend worship in Salt Lake City

The Salt Lake City hackathon — only the second we've done with a strong geology theme — is a thing of history, but you can still access the event page to check out who showed up and who did what. (This events page is a new thing we launched in time for this hackathon; it will serve as a public document of what happens at our events, in addition to being a platform for people to register, sponsor, and connect around our events.) 

In true seat-of-the-pants hackathon style we managed to set up an array of webcams and microphones to record the finale. The demos are the icing on the cake. Teams were selected at random and were given 4 minutes to wow the crowd. Here is the video, followed by a summary of what each team got up to... 


Unconformist.ai

Didi Ooi (University of Bristol), Karin Maria Eres Guardia (Shell), Alana Finlayson (UK OGA), Zoe Zhang (Chevron). The team used machine learning the automate the mapping of unconformities in subsurface data. One of the trickiest parts is building up a catalog of data-model pairs for GANs to train on. Instead of relying on thousand or hundreds of thousands of human-made seismic interpretations, the team generated training images by programmatically labelling pixels on synthetic data as being either above (white) or below (black) the unconformity. Project pageSlides.

unconformist.ai_preso

Outcrops Gee Whiz

Thomas Martin (soon Colorado School of Mines), Zane Jobe (Colorado School of Mines), Fabien Laugier (Chevron), and Ross Meyer (Colorado School of Mines). The team wrote some programs to evaluate facies variability along drone-derived digital outcrop models. They did this by processing UAV point cloud data in Python and classified different rock facies using using weather profiles, local cliff face morphology, and rock colour variations as attributes. This research will help in the development drone assisted 3D scanning to automate facies boundaries mapping and rock characterization. RepoSlides.

SLC_outcrop_geewhiz_blog.png

Jet Loggers

Eirik Larsen and Dimitrios Oikonomou (Earth Science Analytics), and Steve Purves (Euclidity). This team of European geoscientists, with their circadian clocks all out of whack, investigated if a language of stratigraphy can be extracted from the rock record and, if so, if it can be used as another tool for classifying rocks. They applied natural language processing (NLP) to an alphabetic encoding of well logs as a means to assist or augment the labour-intensive tasks of classifying stratigraphic units and picking tops. Slides.


SLC_NLP_jet_loggers.png
SLC_bookcliffs.png

Book Cliffs Bandits

Tom Creech (ExxonMobil) and Jesse Pisel (Wyoming State Geological Survey). The team started munging datasets in the Book Cliffs. Unfortunately, they really did not have the perfect, ready to go data, and by the time they pivoted to some workable open data from Alaska, their team name had already became a thing. The goal was build a tool to assist with lithology and stratigraphic correlation. They settled on change-point detection using Bayesian statistics, which they were using to build richer feature sets to test if it could produce more robust automatic stratigraphic interpretation. Repo, and presentation.


A channel runs through it

Nam Pham (UT Austin), Graham Brew (Dynamic Graphics), Nathan Suurmeyer (Shell). Because morphologically realistic 3D synthetic seismic data is scarce, this team wrote a Python program that can take seismic horizon interpretations from real data, then construct richer training data sets for building an AI that can automatically delineate geological entities in the subsurface. The pixels enclosed by any two horizons are labelled with ones, pixels outside this region are labelled with zeros. This work was in support of Nam's thesis research which is using the SegNet architecture, and aims to extract not only major channel boundaries in seismic data, but also the internal channel structure and variability – details that many seismic interpreters, armed even with state-of-the art attribute toolboxes, would be unable to resolve. Project page, and code.

GeoHacker

Malcolm Gall (UK OGA), Brendon Hall and Ben Lasscock (Enthought). Innovation happens when hackers have the ability to try things... but they also need data to try things out on. There is a massive shortage of geoscience datasets that have been staged and curated for machine learning research. Team Geohacker's project wasn't a project per se, but a platform aimed at the sharing, distribution, and long-term stewardship of geoscience data benchmarks. The subsurface realm is swimming with disparate data types across a dizzying range of length scales, and indeed community efforts may be the only way to prove machine-learning's usefulness and keep the hype in check. A place where we can take geoscience data, and put it online in a ready-to-use for for machine learning. It's not only about being open, online and accessible. Good datasets, like good software, need to be hosted by individuals, properly documented, enriched with tutorials and getting-started guides, not to mention properly funded. Website.

SLC_petrodict.png

Petrodict

Mark Mlella (Univ. Louisiana, Lafayette), Matthew Bauer (Anchutz Exploration), Charley Le (Shell), Thomas Nguyen (Devon). Petrodict is a machine-learning driven, cloud-based lithology prediction tool that takes petrophysics measurements (well logs) and gives back lithology. Users upload a triple combo log to the app, and the app returns that same log with with volumetric fractions for it's various lithologic or mineralogical constituents. For training, the team selected several dozen wells that had elemental capture spectroscopy (ECS) logs – a premium tool that is run only in a small fraction of wells – as well as triple combo measurements to build a model for predicting lithology. Repo.

Seismizor

George Hinkel, Vivek Patel, and Alex Waumann (all from University of Texas at Arlington). Earthquakes are hard. This team of computer science undergraduate students drove in from Texas to spend their weekend with all the other geo-enthusiasts. What problem in subsurface oil and gas did they identify as being important, interesting, and worthy of their relatively unvested attention? They took on the problem of induced seismicity. To test whether machine learning and analytics can be used to predict the likelihood that injected waste water from fracking will cause an earthquake like the ones that have been making news in Oklahoma. The majority of this team's time was spent doing what all good scientists do –understanding the physical system they were trying to investigate – unabashedly pulling a number of the more geomechanically inclined hackers from neighbouring teams and peppering them with questions. Induced seismicity is indeed a complex phenomenon, but George's realization that, "we massively overestimated the availability of data", struck a chord, I think, with the judges and the audience. Another systemic problem. The dynamic earth – incredible in its complexity and forces – coupled with the fascinating and politically charged technologies we use for drilling and fracking might be one of the hardest problems for machine learning to attack in the subsurface. 


AAPG next year is in San Antonio. If it runs, the hackathon will be 18–19 of May. Mark your calendar and stay tuned!