Bring it into time

A student competing in the AAPG's Imperial Barrel Award recently asked me how to take seismic data, and “bring it into depth”. How I read this was, “how do I take something that is outside my comfort zone, and make it fit with what is familiar?” Geologists fear the time domain. Geology is in depth, logs are in depth, drill pipe is in depth. Heck, even X and Y are in depth. Seismic data relates to none of those things; useless right? 

It is excusable for the under-initiated, but this concept of “bringing [time domain data] into depth” is an informal fallacy. Experienced geophysicists understand this because depth conversion, in all of its forms and derivatives, is a process that introduces a number of known unknowns. It is easier for others to be dismissive, or ignore these nuances. So early-onset discomfort with the travel-time domain ensues. It is easier to stick to a domain that doesn’t cause such mental backflips; a kind of temporal spatial comfort zone. 

Linear in time

However, the unconverted should find comfort in one property where the time domain is advantageous; it is linear. In contrast, many drillers and wireline engineers are quick to point that measured depth is not nessecarily linear. Perhaps time is an even more robust, more linear domain of measurement (if there is such a concept). And, as a convenient result, a world of possibilities emerge out of time-linearity: time-series analysis, digital signal processing, and computational mathematics. Repeatable and mechanical operations on data.

Boot camp in time
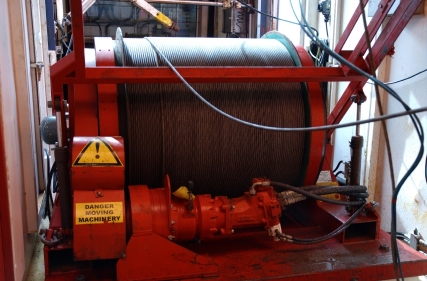
The depth domain isn’t exactly omnipotent. A colleague, who started her career as a wireline-engineer at Schlumberger, explained to me that her new-graduate training involved painfully long recitations and lecturing on the intricacies of depth. What is measured depth? What is true vertical depth? What is drill-pipe stretch? What is wireline stretch? And so on. Absolute depth is important, but even with seemingly rigid sections of solid steel drill pipe, it is still elusive. And if any measurement requires a correction, that measurement has error. So even working in the depth domain data has its peculiarities.

Few of us ever get the privilege of such rigorous training in the spread of depth measurements. Sitting on the back of the rhetorical wireline truck, watching the coax-cable unpeel into the wellhead. Few of us have lifted a 300 pound logging tool, to feel the force that it would impart on kilometres of cable. We are the recipients of measurements. Either it is a text file, or an image. It is what it is, and who are we to change it? What would an equvialent boot camp for travel-time look like? Is there one?

In the filtered earth, even the depth domain is plastic. Travel-time is the only absolute.

More than a blueprint

blueprint_istock.jpg
"This company used to function just fine without any modeling."

My brother, an architect, paraphrased his supervisor this way one day; perhaps you have heard something similar. "But the construction industry is shifting," he noted. "Now, my boss needs to see things in 3D in order to understand. Which is why we have so many last minute changes in our projects. 'I had no idea that ceiling was so low, that high, that color, had so many lights,' and so on."

The geological modeling process is often an investment with the same goal. I am convinced that many are seduced by the appeal of an elegantly crafted digital design, the wow factor of 3D visualization. Seeing is believing, but in the case of the subsurface, seeing can be misleading.

Not your child's sandbox! Photo: R Weller.

Not your child's sandbox! Photo: R Weller.

Building a geological model is fundamentally different than building a blueprint, or at least it should be. First of all, a geomodel will never be as accurate as a blueprint, even after the last well has been drilled. The geomodel is more akin to the apparatus of an experiment; literally the sandbox and the sand. The real lure of a geomodel is to explore and evaluate uncertainty. I am ambivalent about compelling visualizations that drop out of geomodels, they partially stand in the way of this high potential. Perhaps they are too convincing.

I reckon most managers, drillers, completions folks, and many geoscientists are really only interested in a better blueprint. If that is the case, they are essentially behaving only as designers. That mindset drives a conflict any time the geomodel fails to predict future observations. A blueprint does not have space for uncertainty, it's not defined that way. A model, however, should have uncertainty and simplifying assumptions built right in.

Why are the narrow geological assumptions of the designer so widely accepted and in particular, so enthusiastically embraced by the industry? The neglect of science keeping up with technology is one factor. Our preference for simple and quickly understood explanations is another. Geology, in its wondrous complexity, does not conform to such easy reductions.

Despite popular belief, this is not a blueprint.We gravitate towards a single solution precisely because we are scared of the unknown. Treating uncertainty is more difficult that omitting it, and a range of solutions is somehow less marketable than precision (accuracy and precision are not the same thing). It is easier because if you have a blueprint, rigid, with tight constraints, you have relieved yourself from asking what if?

  • What if the fault throw was 20 m instead of 10 m?
  • What if the reservoir was oil instead of water?
  • What if the pore pressure increases downdip?

The geomodelling process should be undertaken for the promise of invoking questions. Subsurface geoscience is riddled with inherent uncertainties, uncertainties that we aren't even aware of. Maybe our software should have a steel-blue background turned on as default, instead of the traditional black, white, or gray. It might be a subconscious reminder that unless you are capturing uncertainty and iterating, you are only designing a blueprint.

If you have been involved with building a geologic model, was it a one-time rigid design, or an experimental sandbox of iteration?

The photograph of the extensional sandbox experiment is used with permission from Roger Weller of Cochise College. Image of geocellular model from the MATLAB Reservoir Simulation Toolbox (MRST) from SINTEF applied mathematics, which has been recently released under the terms of the GNU General public license! The blueprint is © nadla and licensed from iStock. None of these images are subject to Agile's license terms.

The filtered earth

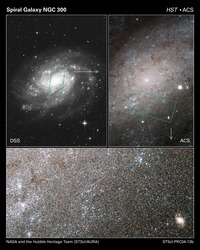
Ground-based image (top left) vs Hubble's image. Click for a larger view. One of the reasons for launching the Hubble Space Telescope in 1990 was to eliminate the filter of the atmosphere that affects earth-bound observations of the night sky. The results speak for themselves: more than 10 000 peer-reviewed papers using Hubble data, around 98% of which have citations (only 70% of all astronomy papers are cited). There are plenty of other filters at work on Hubble's data: the optical system, the electronics of image capture and communication, space weather, and even the experience and perceptive power of the human observer. But it's clear: eliminating one filter changed the way we see the cosmos.

What is a filter? Mathematically, it's a subset of a larger set. In optics, it's a wavelength-selection device. In general, it's a thing or process which removes part of the input, leaving some output which may or may not be useful. For example, in seismic processing we apply filters which we hope remove noise, leaving signal for the interpreter. But if the filters are not under our control, if we don't even know what they are, then the relationship between output and input is not clear.

Imagine you fit a green filter to your petrographic microscope. You can't tell the difference between the scene on the left and the one on the right—they have the same amount and distribution of green. Indeed, without the benefit of geological knowledge, the range of possible inputs is infinite. If you could only see a monochrome view, and you didn't know what the filter was, or even if there was one, it's easy to see that the situation would be even worse. 

Like astronomy, the goal of geoscience is to glimpse the objective reality via our subjective observations. All we can do is collect, analyse and interpret filtered data, the sifted ghost of the reality we tried to observe. This is the best we can do. 

What do our filters look like? In the case of seismic reflection data, the filters are mostly familiar: 

  • the design determines the spatial and temporal resolution you can achieve
  • the source system and near-surface conditions determine the wavelet
  • the boundaries and interval properties of the earth filter the wavelet
  • the recording system and conditions affect the image resolution and fidelity
  • the processing flow can destroy or enhance every aspect of the data
  • the data loading process can be a filter, though it should not be
  • the display and interpretation methods control what the interpreter sees
  • the experience and insight of the interpreter decides what comes out of the entire process

Every other piece of data you touch, from wireline logs to point-count analyses, and from pressure plots to production volumes, is a filtered expression of the earth. Do you know your filters? Try making a list—it might surprise you how long it is. Then ask yourself if you can do anything about any of them, and imagine what you might see if you could. 

Hubble image is public domain. Photomicrograph from Flickr user Nagem R., licensed CC-BY-NC-SA. 

Are you a poet or a mathematician?

Woolly ramsMany geologists can sometimes be rather prone to a little woolliness in their language. Perhaps because you cannot prove anything in geology (prove me wrong), or because everything we do is doused in interpretation, opinion and even bias, we like to beat about the bush. A lot.

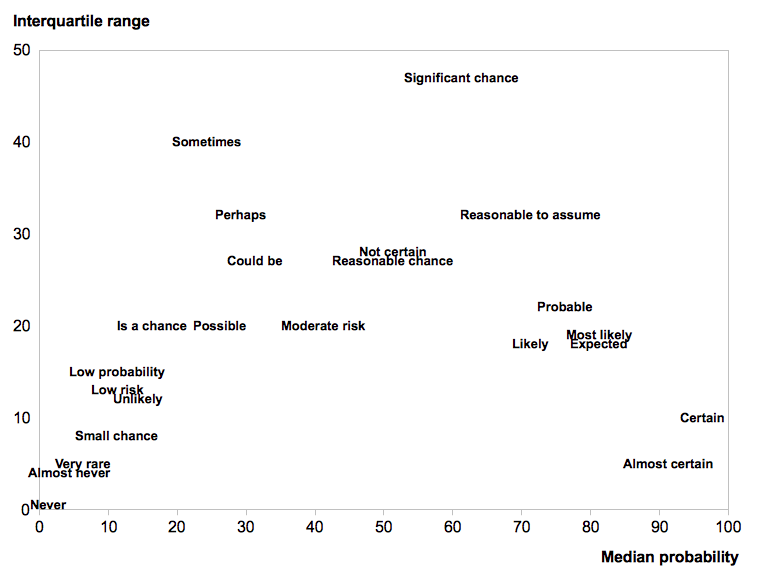
Sometimes this doesn't matter much. We're just sparing our future self from a guilty binge of word-eating, and everyone understands what we mean—no harm done. But there are occasions when a measure of unambiguous precision is called for. When we might want to be careful about the technical meanings of words like approximately, significant, and certain.

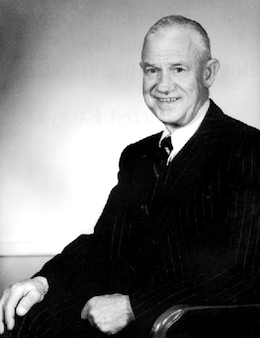
Sherman Kent was a CIA analyst in the Cold War, and he tasked himself with bringing quantitative rigour to the language of intelligence reports. He struggled (and eventually failed), meeting what he called aesthetic opposition:

Sherman Kent portraitWhat slowed me up in the first instance was the firm and reasoned resistance of some of my colleagues. Quite figuratively I am going to call them the poets—as opposed to the mathematicians—in my circle of associates, and if the term conveys a modicum of disapprobation on my part, that is what I want it to do. Their attitude toward the problem of communication seems to be fundamentally defeatist. They appear to believe the most a writer can achieve when working in a speculative area of human affairs is communication in only the broadest general sense. If he gets the wrong message across or no message at all—well, that is life.

Sherman Kent, Words of Estimative Probability, CIA Studies in Intelligence, Fall 1964

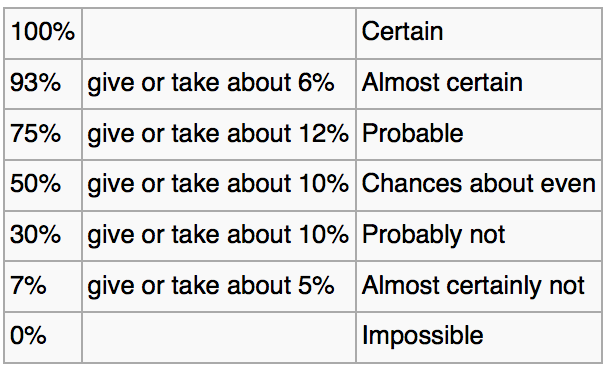
Words of estimative probabilityKent proposed using some specific words to convey specific levels of certainty (right). We have used these words in our mobile app Risk*. The only modification I made was setting P = 0.99 for Certain, and P = 0.01 for Impossible (see my remark about proving things in geology).

There are other schemes. Most petroleum geologists know Peter Rose's work. A common language, with some quantitative meaning, can dull the pain of prospect risking sessions. Almost certainly. Probably.

Do you use systematic descriptions of uncertainty? Do you think they help? How can we balance our poetic side of geology with the mathematical?