News of the month

A few bits of news about geology, geophysics, and technology in the hydrocarbon and energy realm. Do drop us a line if you hear of something you think we ought to cover.
All your sequence strat

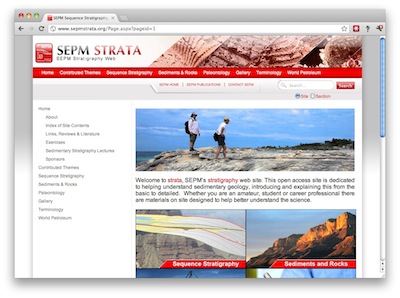
The SEPM, which today calls itself the Society for Sedimentary Geology (not the Society of Economic Palaeontologists and Mineralogists, which is where the name comes from, IIRC), has upgraded its website. It looks pretty great (nudge nudge, AAPG!). The awesome SEPM Strata, a resource for teaching and learning sequence stratigraphy, also got a facelift. 

Hat-tip to Brian Romans for this one.

Giant sand volcano

Helge Løseth of Statoil, whom we wrote about last week in connection with the Source Rocks from Seismic workflow, was recently in the news again. This time he and his exploration team were describing the Pleistocene extrusion of more than 10 km3 of sand onto the sea-floor in the northern North Sea, enough to bury Manhattan in 160 m of sand.

The results are reported in Løseth, H, N Rodrigues, and P Cobbold (2012) and build on earlier work by the same team (Rodrigues et al. 2009). 
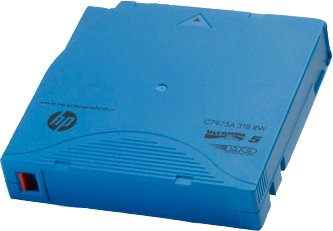
Tape? There's still tape??

Yes, there's still tape. This story just caught my eye because I had no idea people were still using tape. It turns out that the next generation of tape, Ultrium LTO-6, will be along in the second half of 2012. The specs are pretty amazing: 8 TB (!) of compressed data, and about 200 MB/s (that's megabytes) transfer rates. The current generation of cartridges, LTO-5, cost about $60 and hold 3 TB — a similar-performing hard drive will set you back more than double that. 
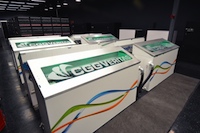
The coolest cluster

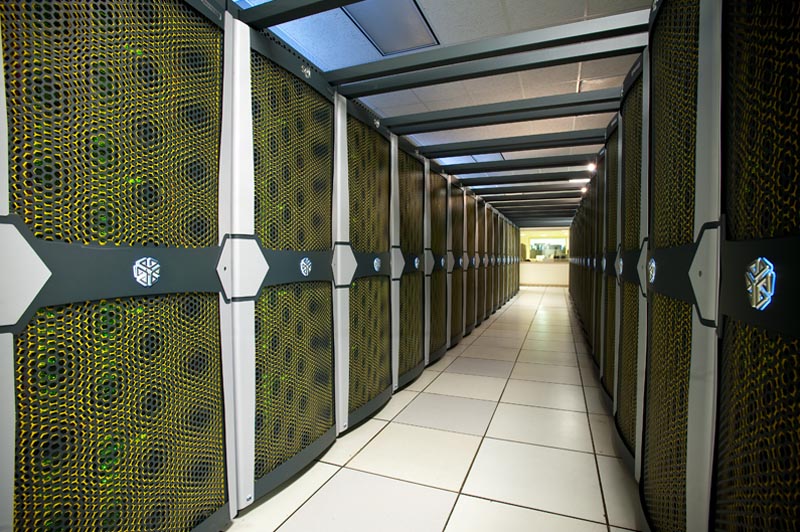
Physics enables geophysics in lots of cool ways. CGGVeritas is using a 600 kW Green Revolution Cooling CarnotJet liquid cooling system to refrigerate 24 cluster racks in GRC's largest installation to date. In the video below, you can see an older 100 kW system. The company claims that these systems, in which the 40°C racks sit bathed in non-conductive oil, reduce the cost of cooling a supercomputer by about 90%... pretty amazing.

Awesomer still, this server is using Supermicro's SuperServer GPU-accelerated servers. GPUs, or graphics processing units, have massively parallel architectures (over 1000 cores per server), and can perform some operations much faster than ordinary CPUs, which are engineered to perform 'executive' functions as well as just math.

This regular news feature is for information only. We aren't connected with any of these organizations, and don't necessarily endorse their products or services. The cartridge image is licensed CC-BY-SA by Wikimedia Commons user andy_hazelbury. The CarnotJet image is from grcooling.com and thought to be fair use.

How big is that volume?

Sometimes you need to know how much space you need for a seismic volume. One of my machines only has 4GB of RAM, so if I don't want to run out of memory, I need to know how big a volume will be. Or your IT department might want help figuring out how much disk to buy next year.

Fortunately, since all seismic data is digital these days, it's easy to figure out how much space we will need. We simply count the samples in the volume, then account for the bit-depth. So, for example, if a 3D volume has 400 inlines and 300 traces per line, then it has 120 000 traces in total. If each trace is 6 seconds long, and the sample interval is 2 ms, then each trace has 6000/2 = 3000 samples (3001 actually, but let's not worry too much about that), so that's about 360 million samples. for a 32-bit volume, each sample requires 32/8 = 4 bytes, so we're at... a big number.  To convert to kilobytes, divide by 210, or 1024, then do it again for MB and again for GB.

It's worth noting that some seismic interpretation tools have proprietary compressed formats available for seismic data, Landmark's 'brick' format for example. This optionally applies a JPEG-like compression to reduce the file size, as well as making some sections display faster because of the way the compressed file is organized. The amount of compression depends on the frequency content of the data, and the compression is lossy, however, meaning that some of the original data is irretrievably lost in the process. If you do use such a file for visualization and interpretation, you may want to use a full bit-depth, full-fidelity file for attribute analysis. 

Do you have any tricks for managing large datasets? We'd love to hear them!

News of the month

News of the week was maybe a little ambitious, so we're going to scale back to a monthly post. The same sort of news — technology with subsurface application. Whatever catches our beady eyes, really. Seen something cool? Tip us off.

First, a quick plug. Matt's writing course is on offer again at the CSPG-CSEG-CWLS GeoConvention in Calgary in May. It's a technical writing course, but it's not really about technical writing—it's about get more people writing more stuff. For fun, for science, for whatever. See the conspicuous ad (right) for more info. 

OK, two quick plugs. Dropbox just updated their web interface. If you're not a Dropbox user already, you are missing out on an amazing file storage and transfer tool. Files are accessible from anywhere, and can be shared with a simple web link. We use it every single day for personal and project stuff. Get an account here or click on the illusion.

The technology is coming

A few weeks ago we posted a video of a new augmented reality monocle. Now, news is growing that Google's mysterious X lab is developing some similar-sounding glasses. The general idea is that they connect to your Android phone for communications services, and sit on your face labeling things in the real world, in real time. Labeling with ads, presumably.

As the new iPad now totes a screen with more pixels than the monitor you’re looking at, it’s clear that mobile devices are changing everything there is to change about computing. 

Another SGI ICE, NASA's Pleiades is one of the top ten clusters in the world at 1.4 Pflops. It has a staggering 191TB of memory. Image: NASA.

Not a total flop

Remember SGI? You know, giant blue refrigeratory thing with 12GB of RAM in the back of the viz room, cost about $1M? Completely wiped out by the Linux PC about 10 years ago? Well, not completely: SGI just sold to  Total E&P a giant computer. Much bigger than a refrigerator, and much more expensive than $1M. At 2.3 petaflops (quadrillion floating-point operations per second) this new ICE X machine will be easily one of the most powerful computers in the world.

If the press release is anything to go by, and it probably isn't, Total seems to have reservoir modeling in mind, not just seismic processing. I wonder if they have a mixing board yet? 

Nova Scotia deepwater on fire

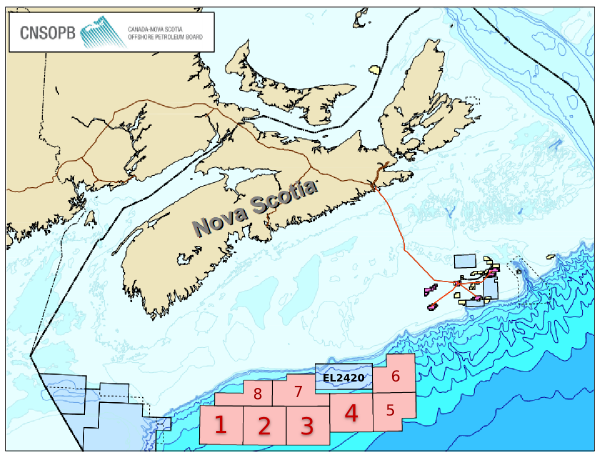
Not literally, but there's a small new flame at any rate. Shell Canada went large in January's bid round on four deepwater blocks off Nova Scotia, committing to almost $1B in exploration expenditures over the next five years. They won parcels 1 to 4 for $1.8M, $303M, $235M, $430M respectively, totalling $970M. This is terrific news for Nova Scotia, and for Canada.

This regular news feature is for information only. We aren't connected with any of these organizations, and don't necessarily endorse their products or services. SGI and ICE X are registered trademarks of Silicon Graphics International Corp. The psychobox illusion is a trademark of Dropbox.com. Offshore Nova Scotia map modified from CNSOPB.

News of the week

We hope you're having a great summer. Our website has been quieter than usual this week, but we're busy building things—stay tuned. And we haven't done a news post for a few weeks, so here are some things that have caught our eye.

A new imaging paradigm

Lytro has begun what may be a revolution for photography with the light field camera, putting the choice of the focal point and depth of field in the hands of the viewer, not the photographer. Try it yourself: click on these examples to change the focal point of the images.

The radical new sensor works by not only capturing the intensity of light, but also its direction. This means the full visual field can be reconstructed. You can view the inspiring gallery of dynamic images or read more about the methods behind computational photography from Ian Hopkinson's blog post. The analogy to full wavefield imaging is obvious, but perhaps the most exciting story is not the technology, but the shift of control from imager (processor) to viewer (interpreter). 

Don't compress the data, expand the medium

Wolfram, makers of Mathematica among other things, are a deeply innovative bunch. This week they launched the Computable Document Format, or CDF, for interactive documents. These new documents could make reports, presentations, e-textbooks, and journal articles much more interesting. 

INT releases Geo Toolkit 4.2

Interactive Network Technologies, makers of the INTViewer interpretation software, have released a new version of its GeoToolkit, version 4.2. It's a proprietary C++ library for developers of geoscience software, and is used by many of the major exploration companies. New features include

  • Improved Seismic display with support for anti-aliasing, transparency, and image rotation
  • New indexed seismic data support for rapid access of large datasets
  • Enhancements to Chart libraries, including multiple selection within charts and ability to link charts.

TimeScale Creator gets a major upgrade

We have written before about this handy application from a Purdue consortium; it should be in every geoscientist's toolbox. Keep an eye out over the summer and fall for new datapacks (including Arctic Canada, Australia, NE Russia), and an all-new web version. Version 5 has some great enhancements:

  • A new data input format, and some limits on user data in the free version
  • Database and display improvements for humanoids, dinocycsts, and passive margins, plus new datapacks
  • Improved geographic interface, now with index maps

This regular news feature is for information only. We aren't connected with any of these organizations, and don't necessarily endorse their products or services.