
Visualize this!
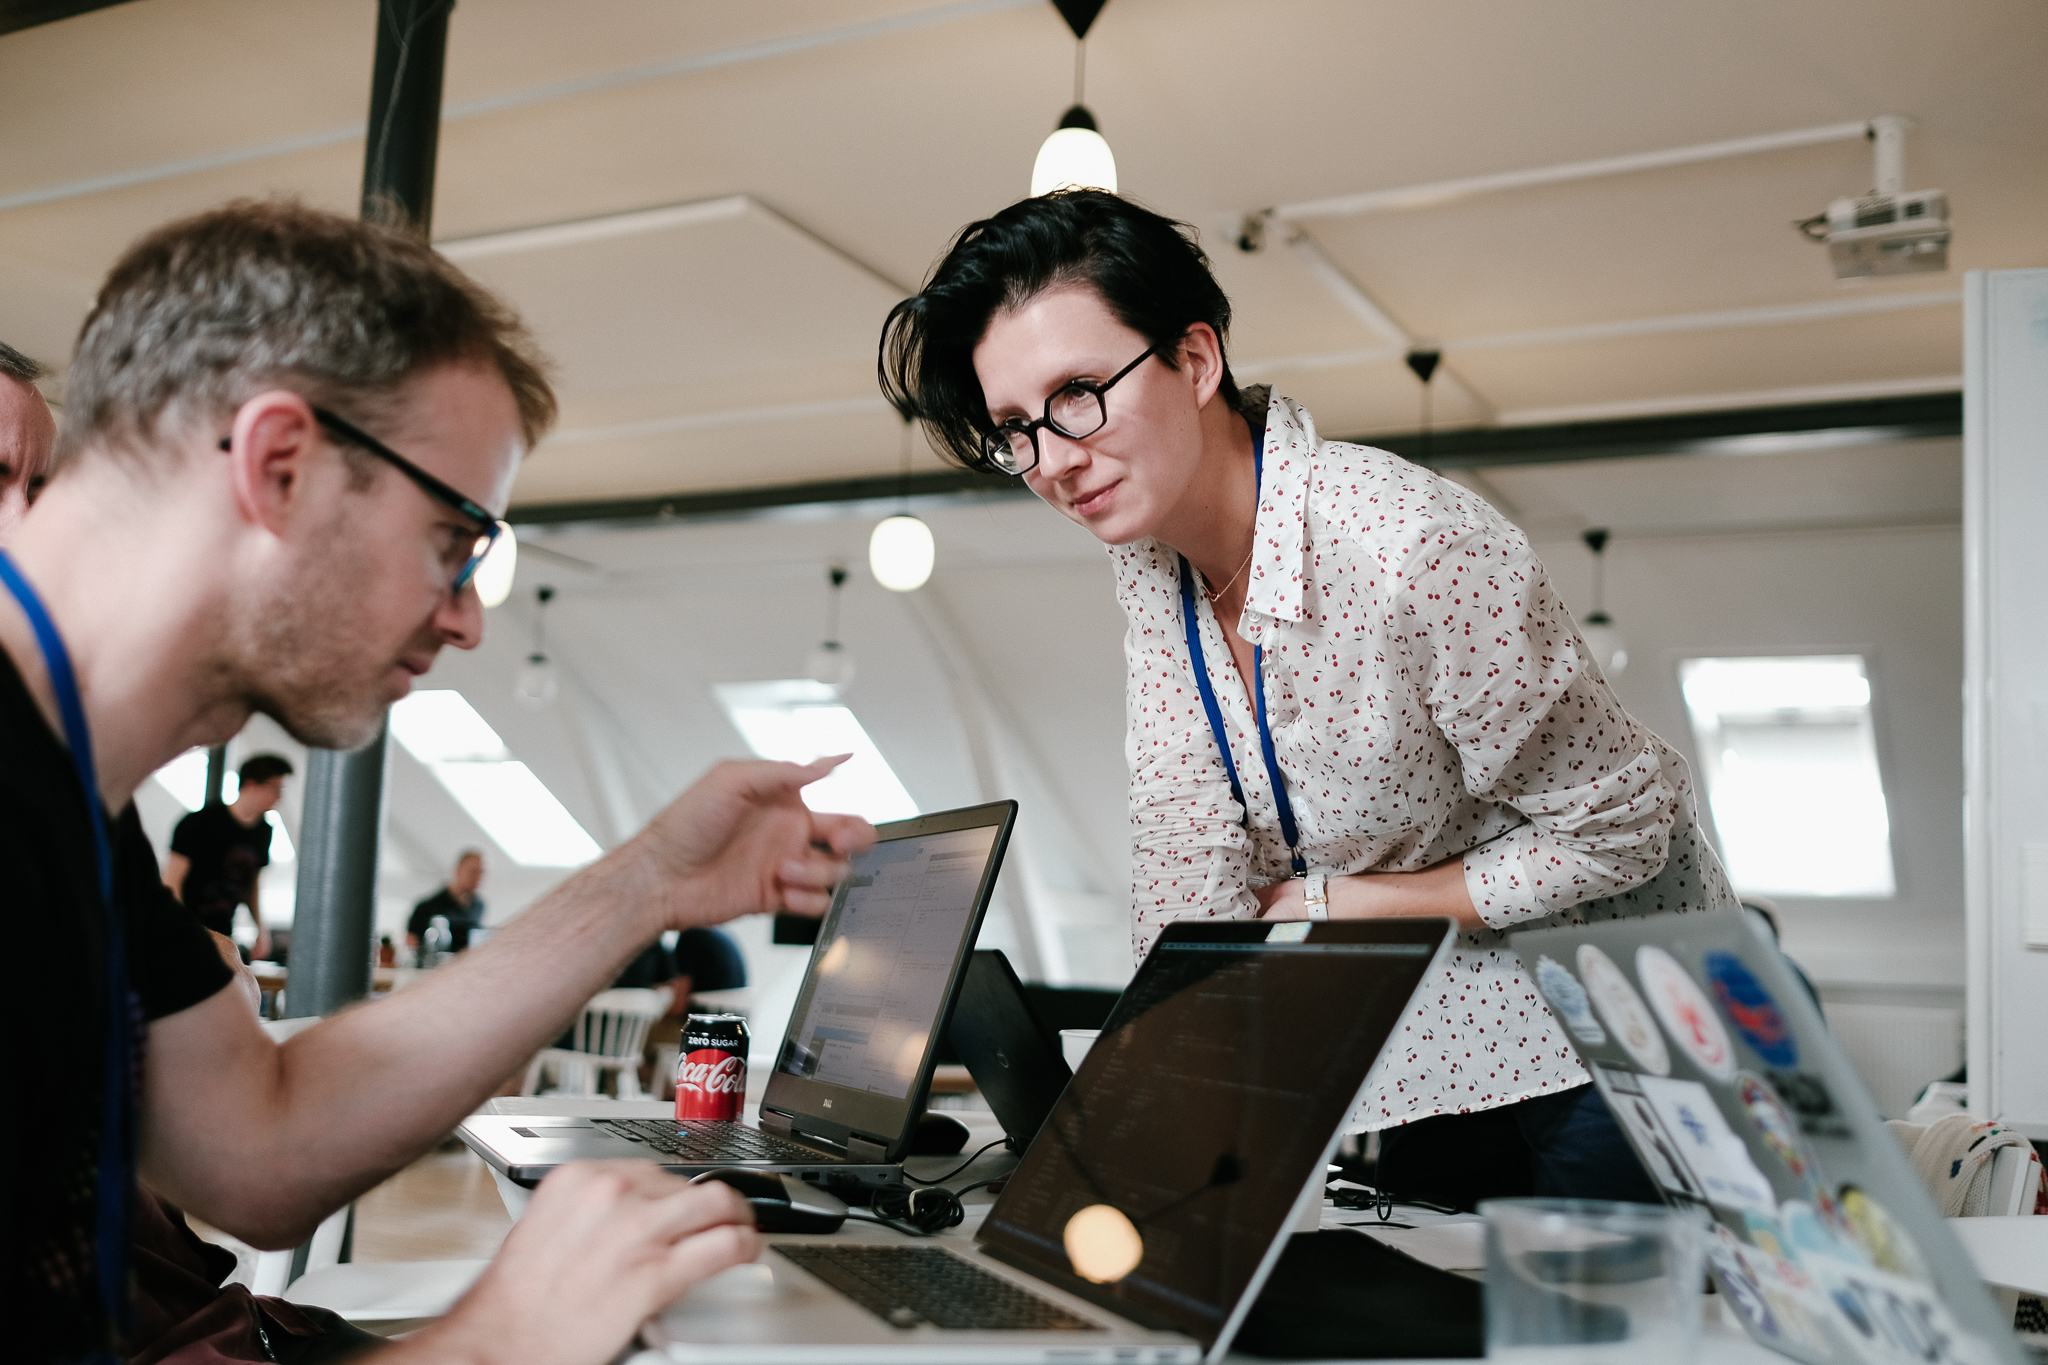
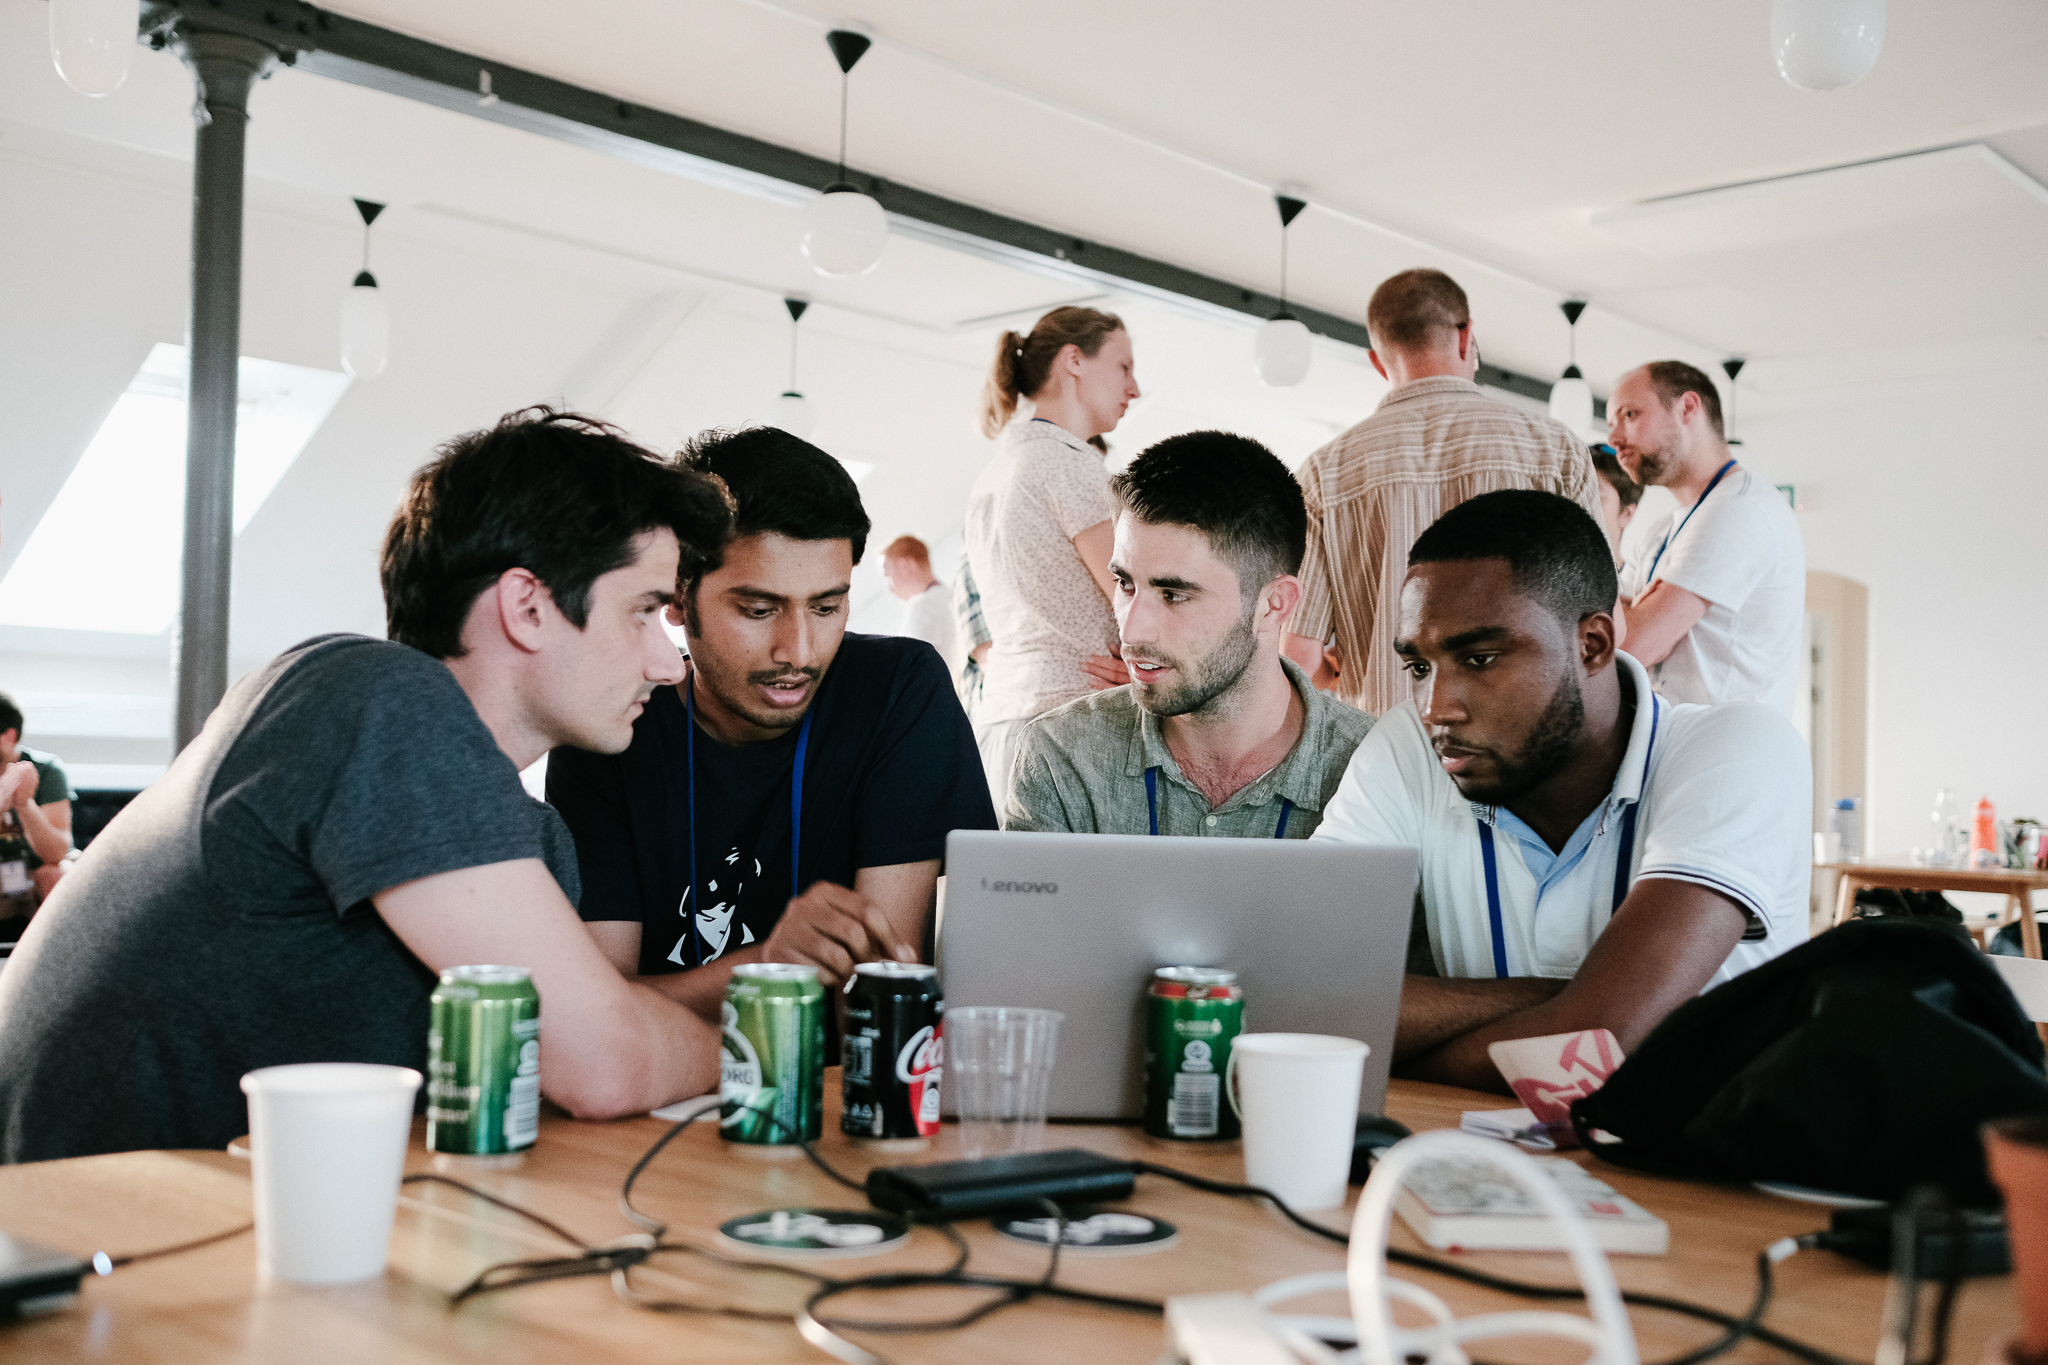
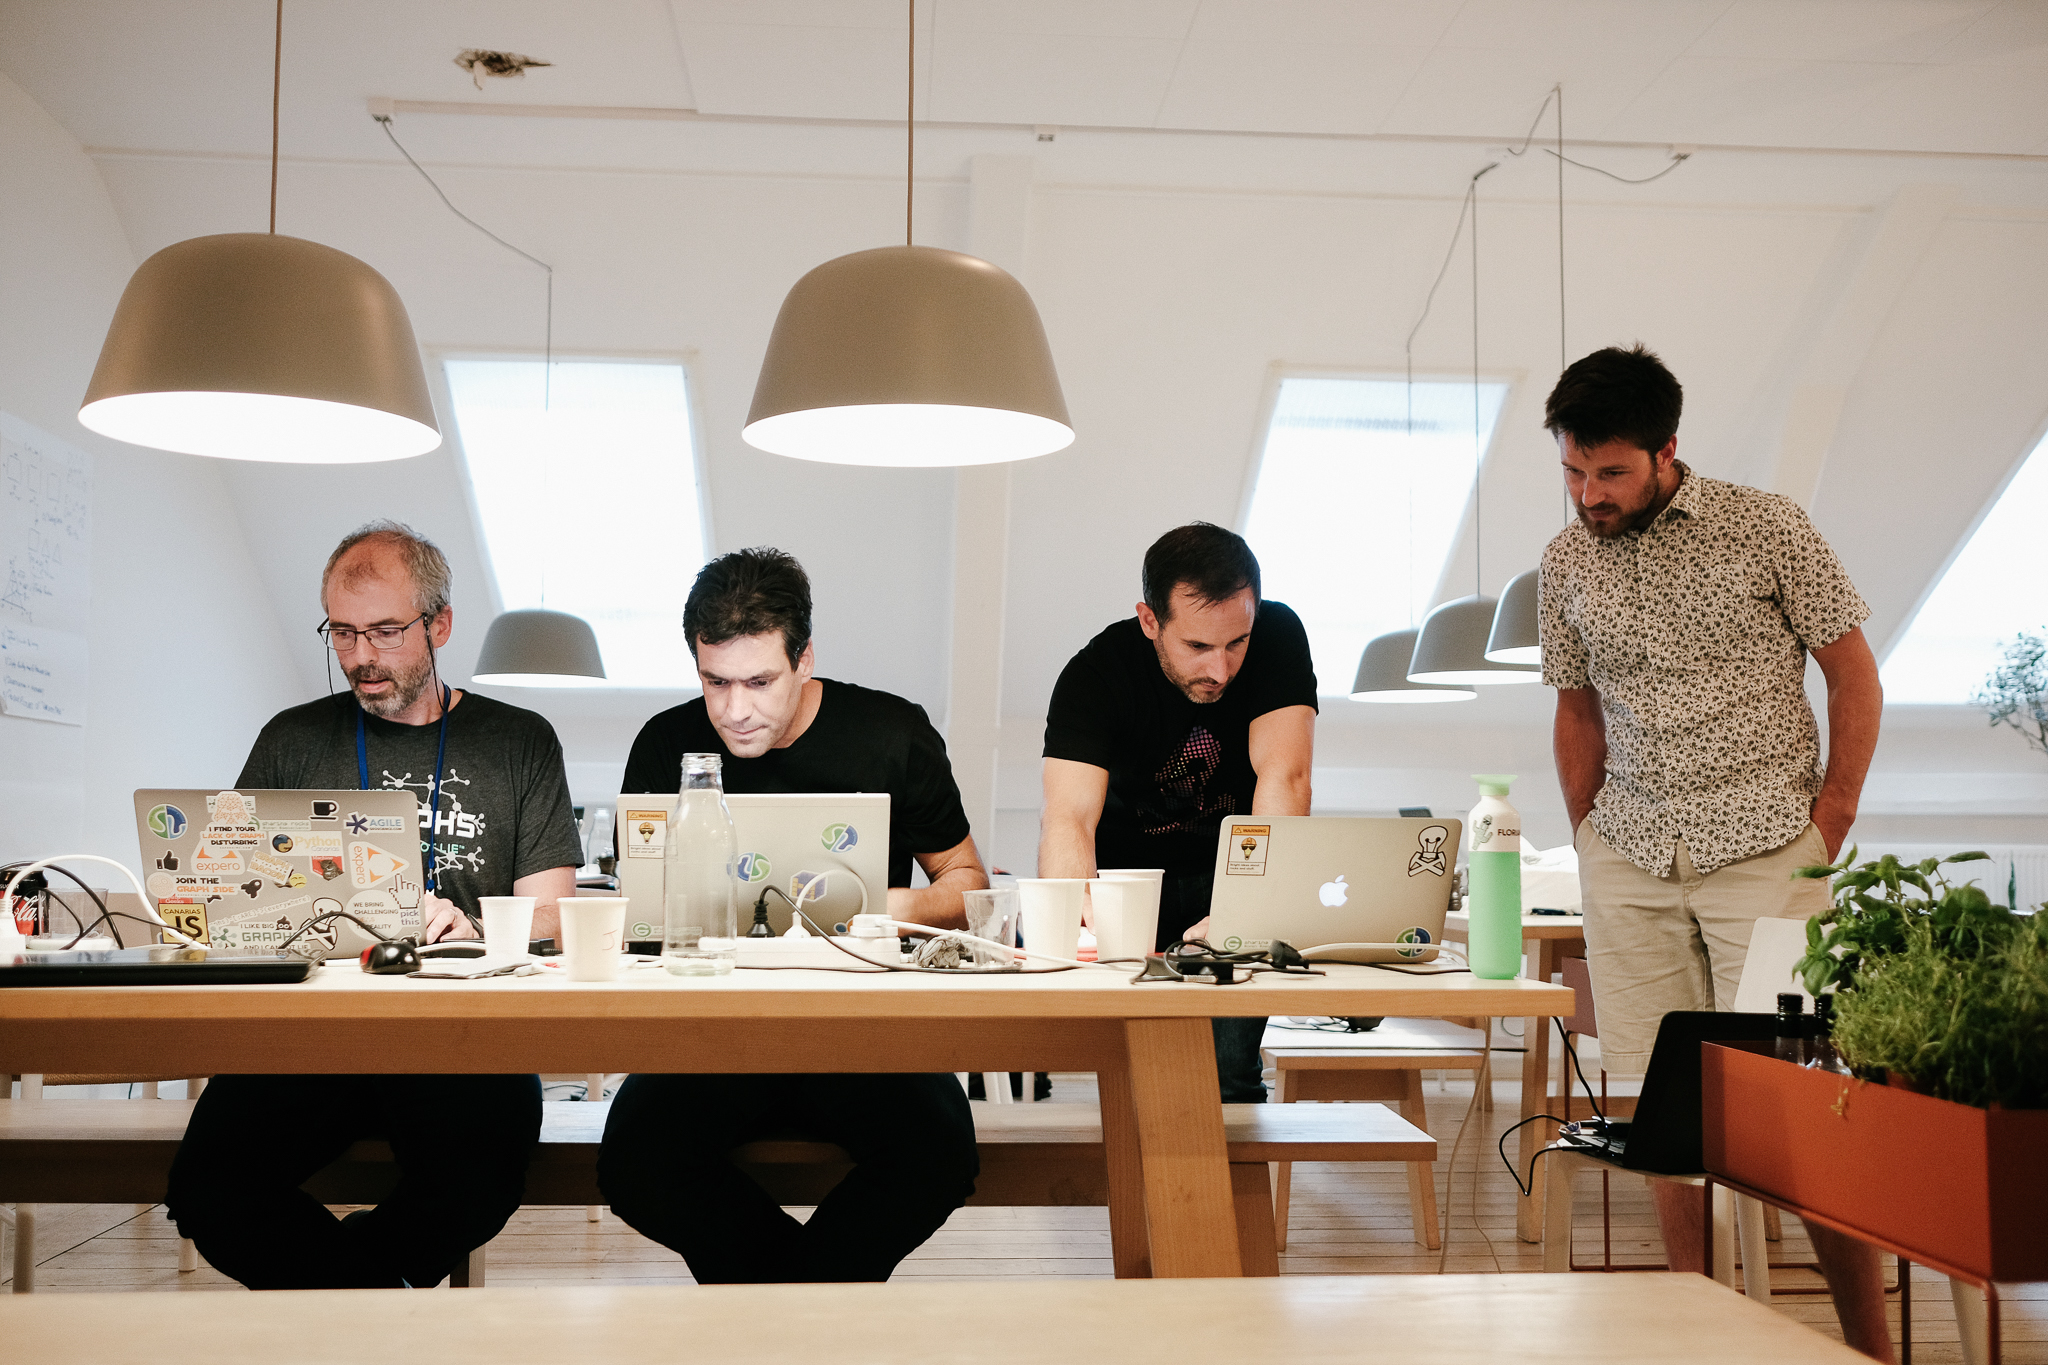
/The Copenhagen edition of the Subsurface Hackathon is over! For three days during the warmest June in Denmark for over 100 years, 63 geoscientists and programmers cooked up hot code in the Rainmaking Loft, one of the coolest, and warmest, coworking spaces you've ever seen. As always, every one of the participants brought their A game, and the weekend flew by in a blur of creativity, coffee, and collaboration. And croissants.

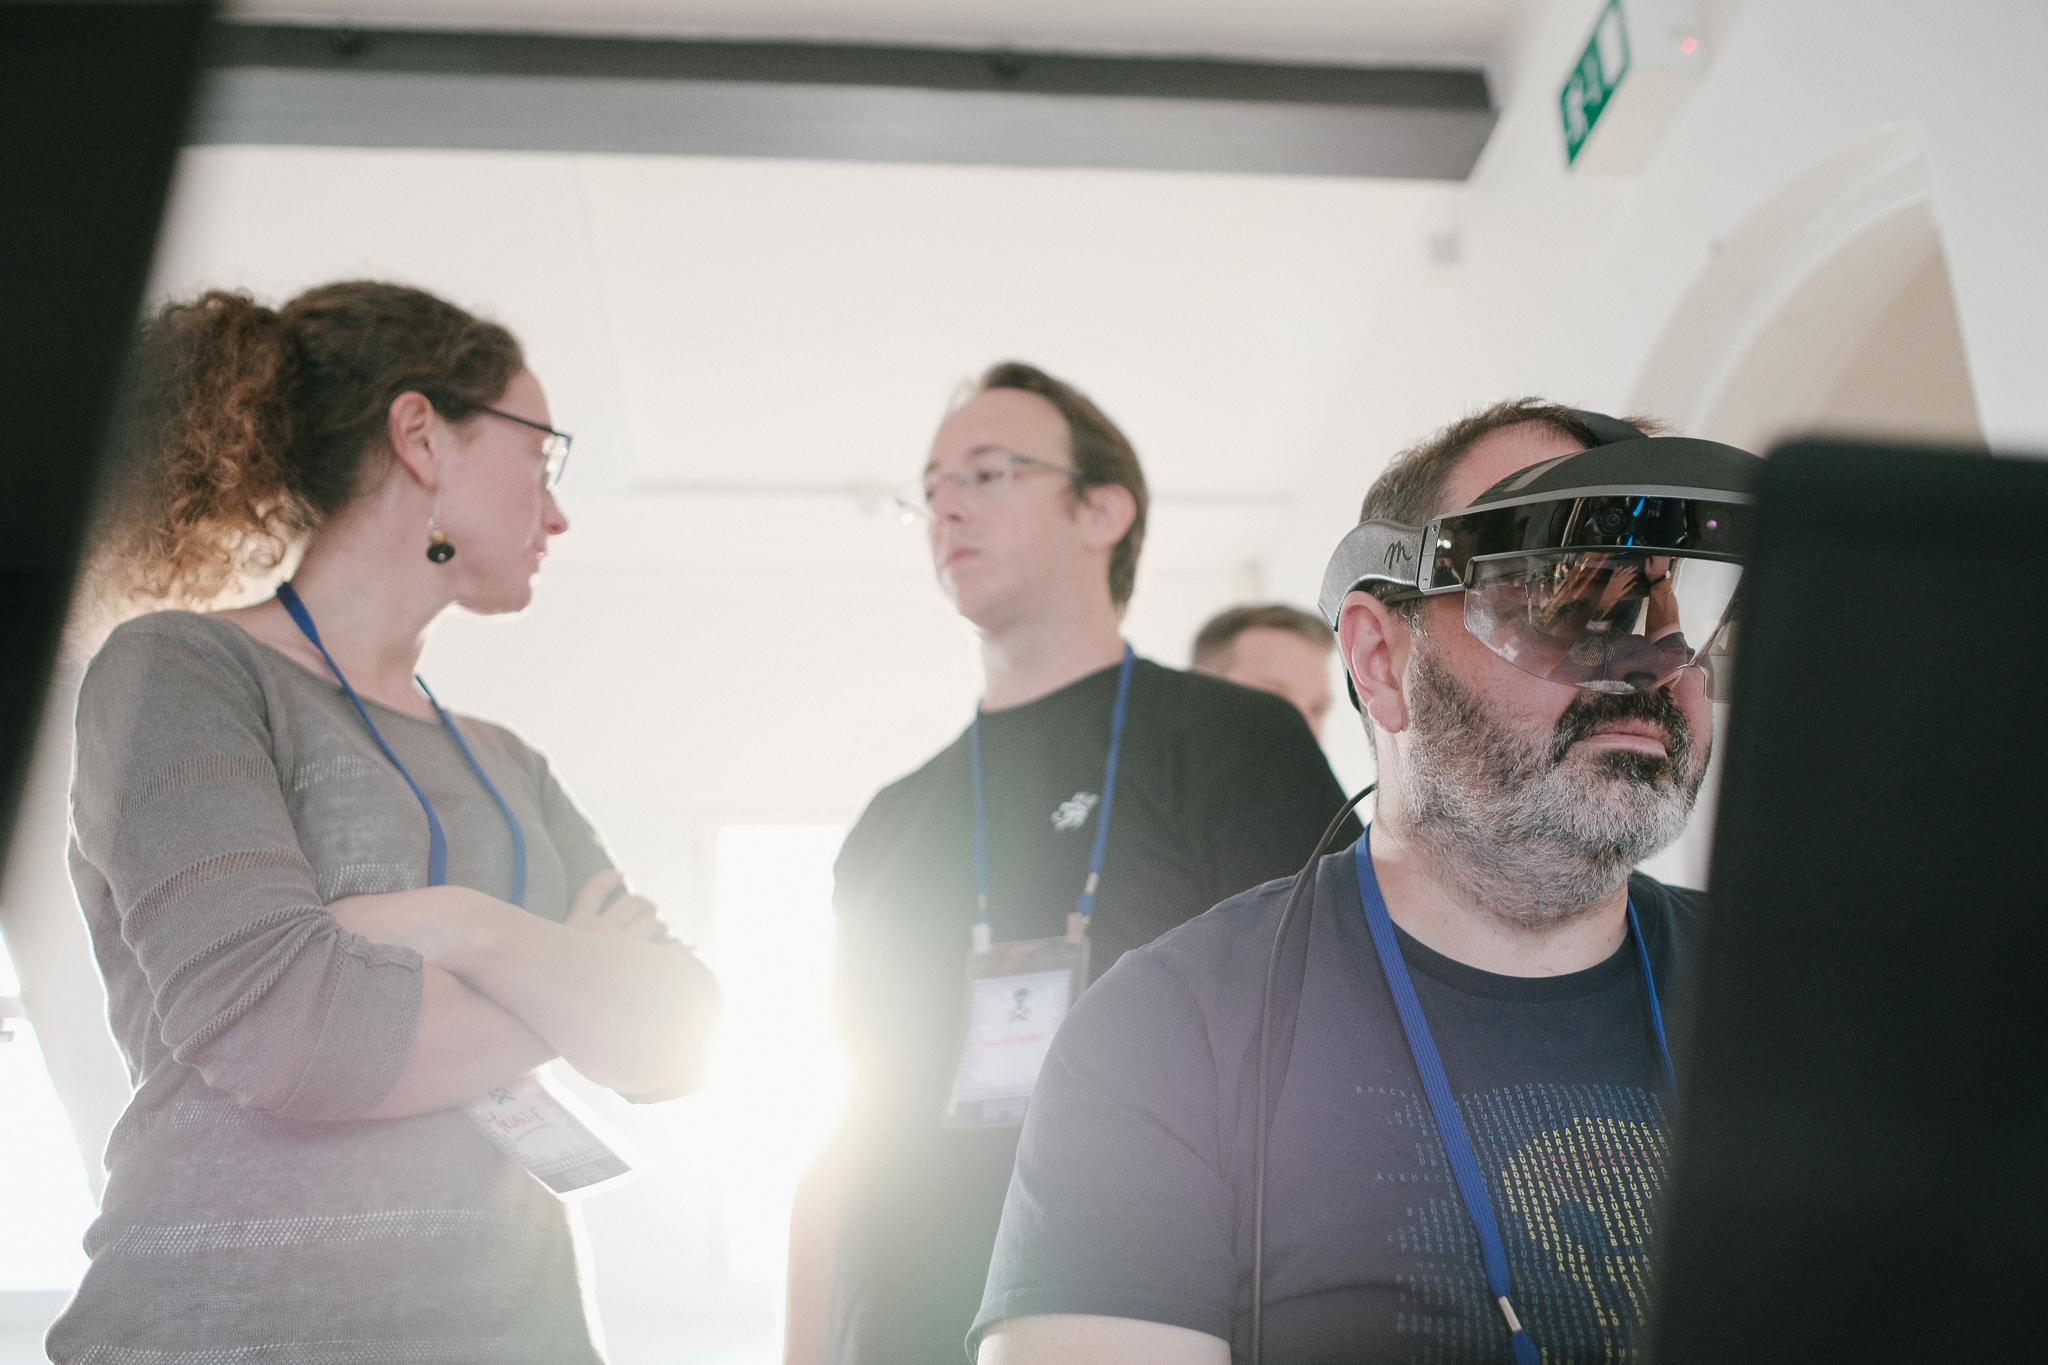
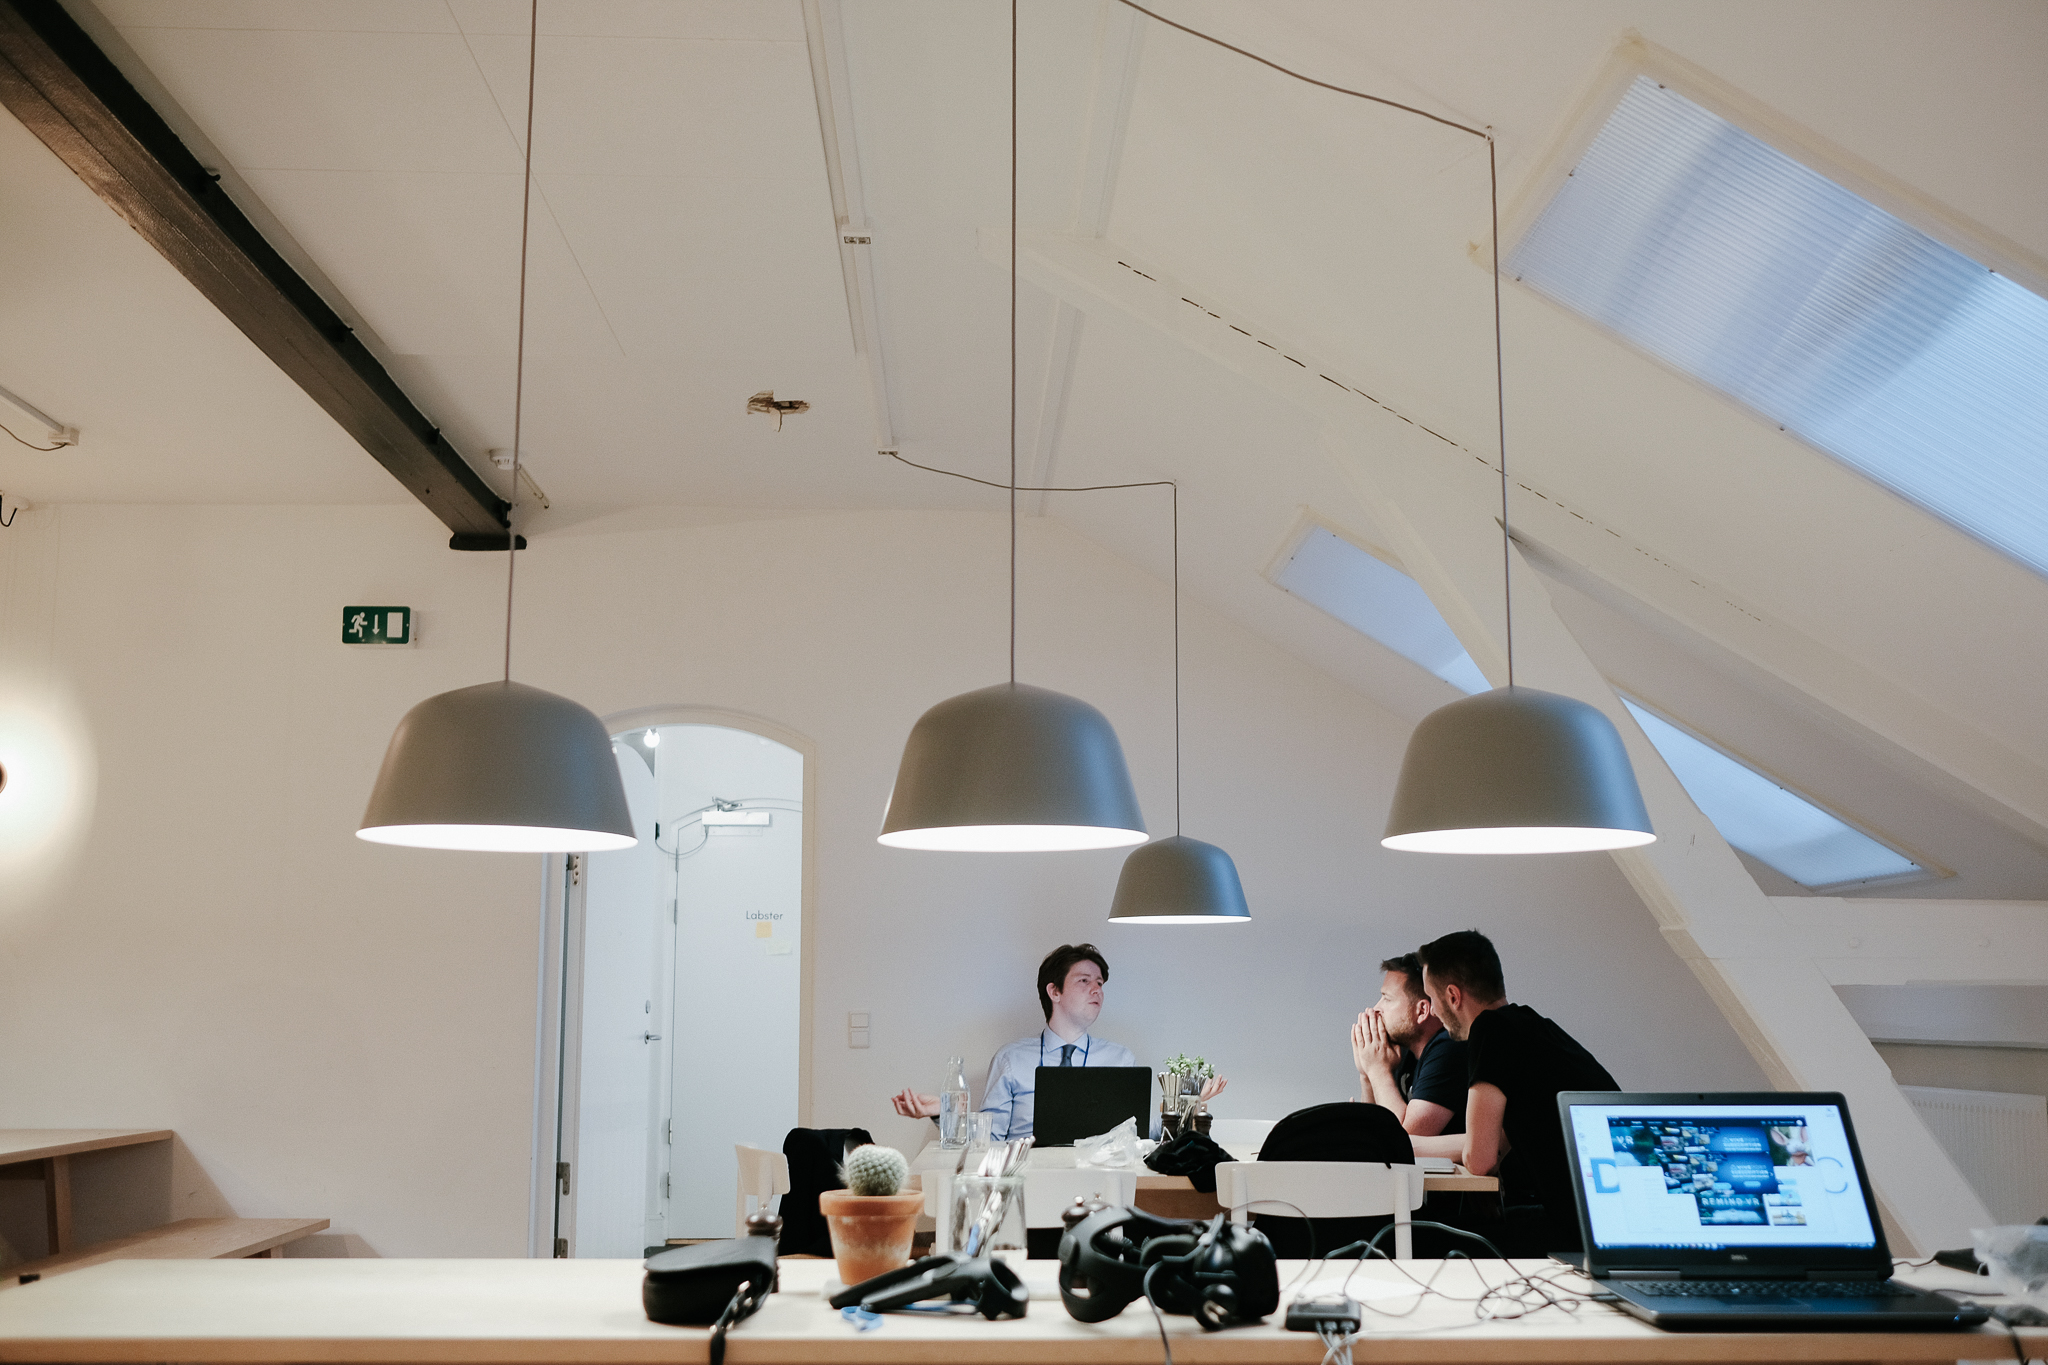
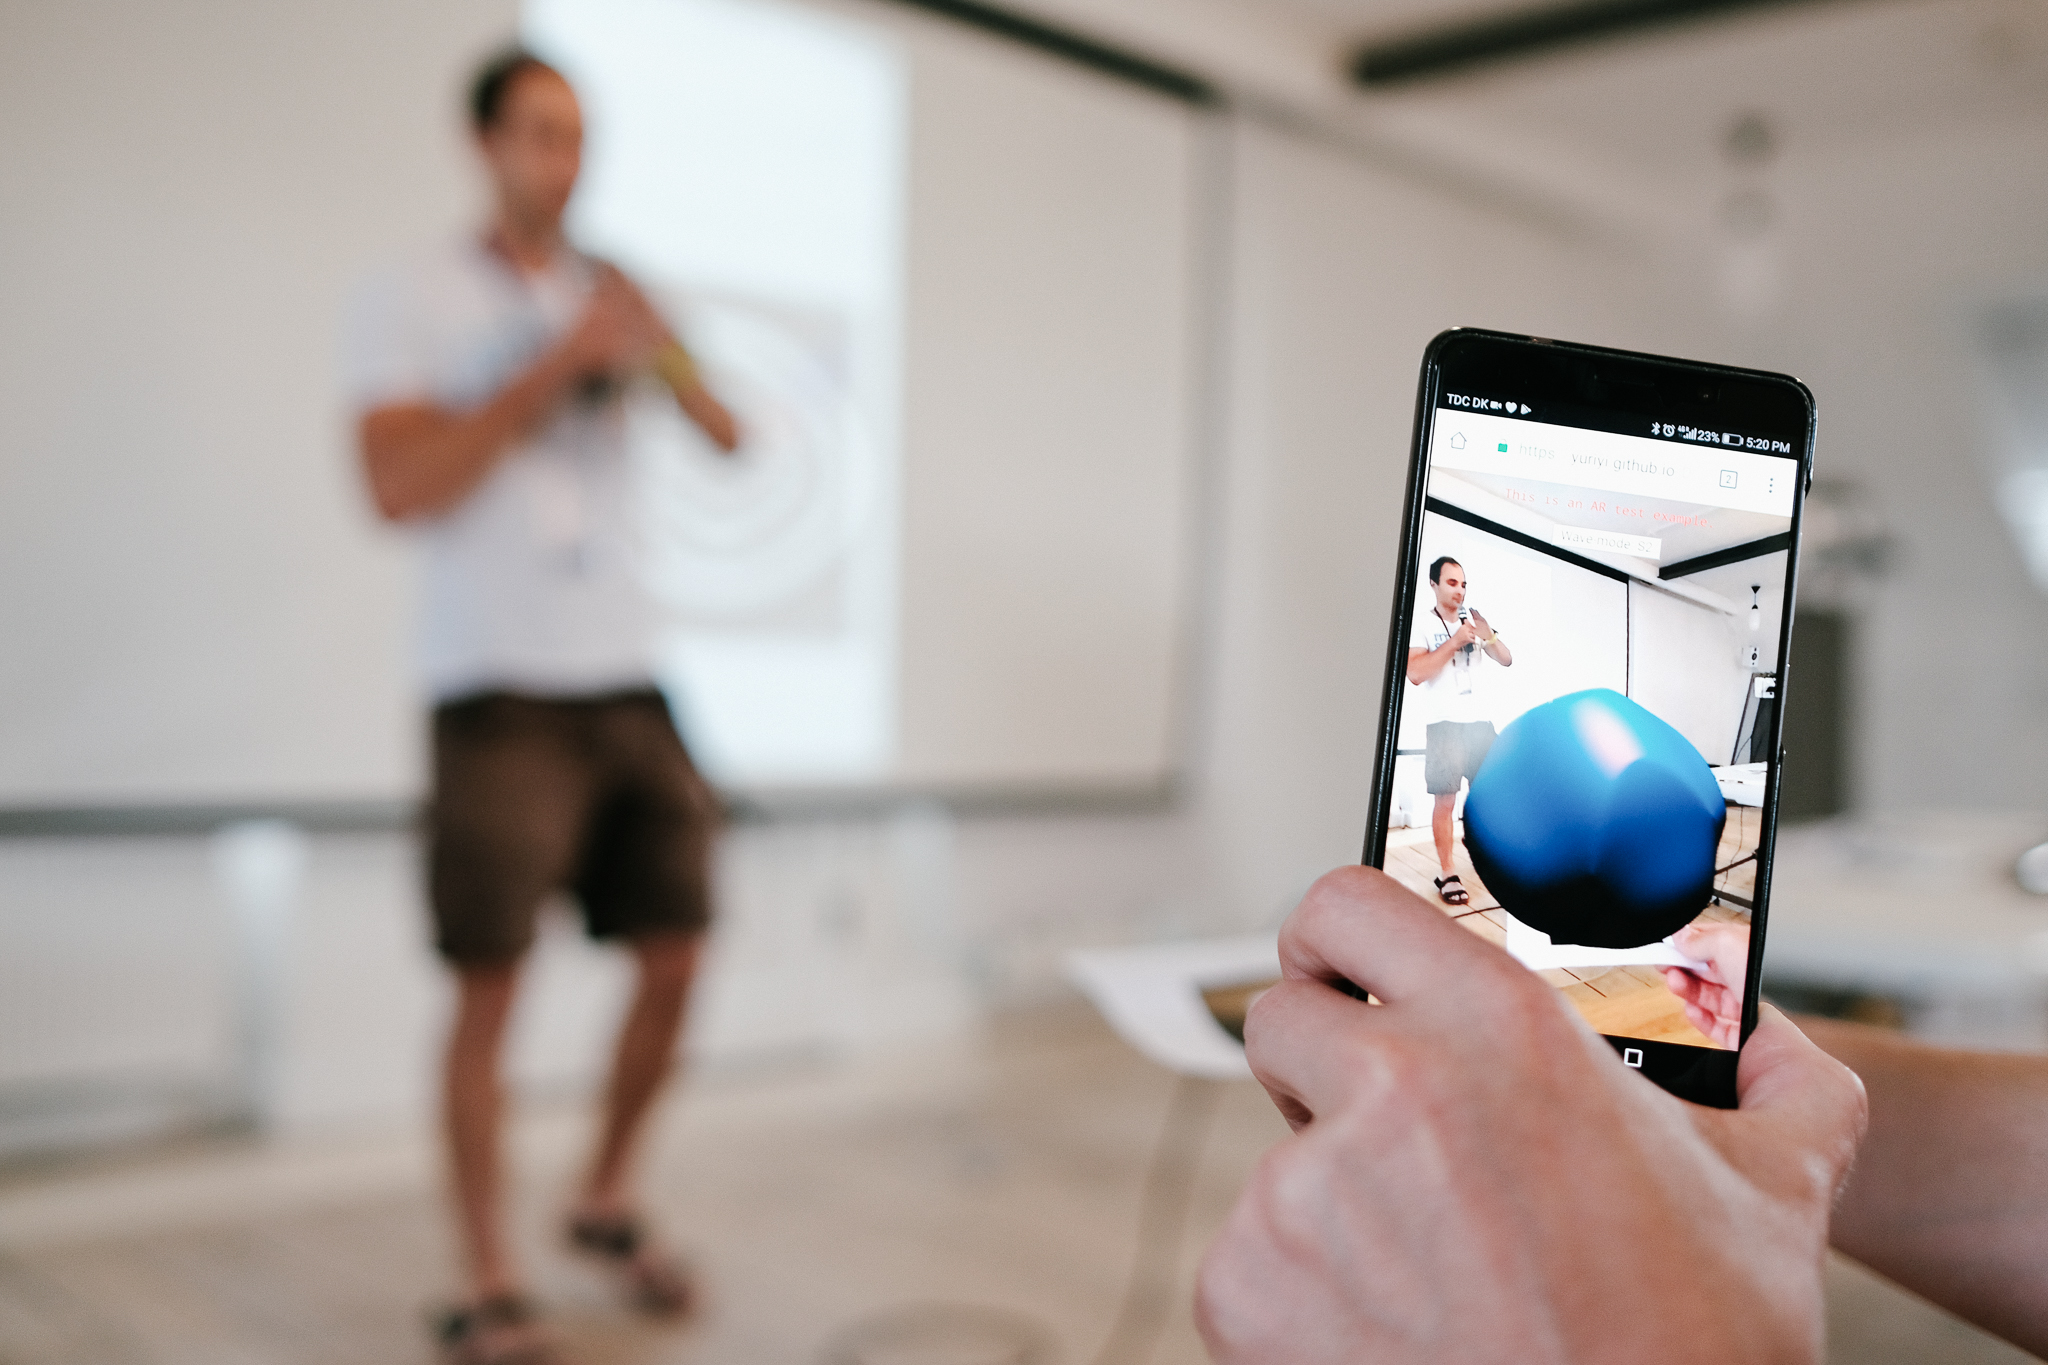
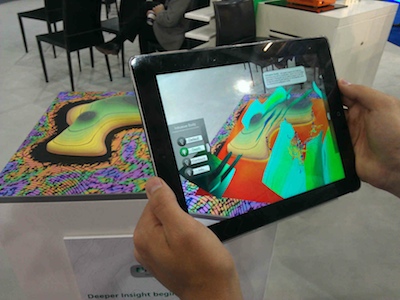
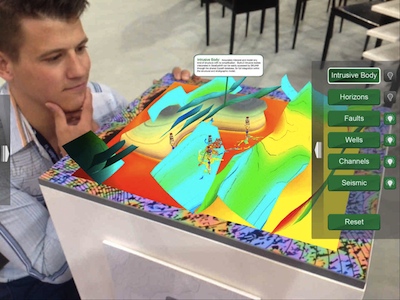
Pierre enjoying the Meta AR headset that DEll EMC provided.
Our sponsors have always been unusually helpful and inspiring, pushing us to get more audacious, but this year they were exceptionally engaged and proactive. Dell EMC, in the form of David and Keith, provided some fantastic tech for the teams to explore; Total supported Agile throughout the organization phase, and Wintershall kindly arranged for the event to be captured on film — something I hope to be able to share soon. See below for the full credit roll!

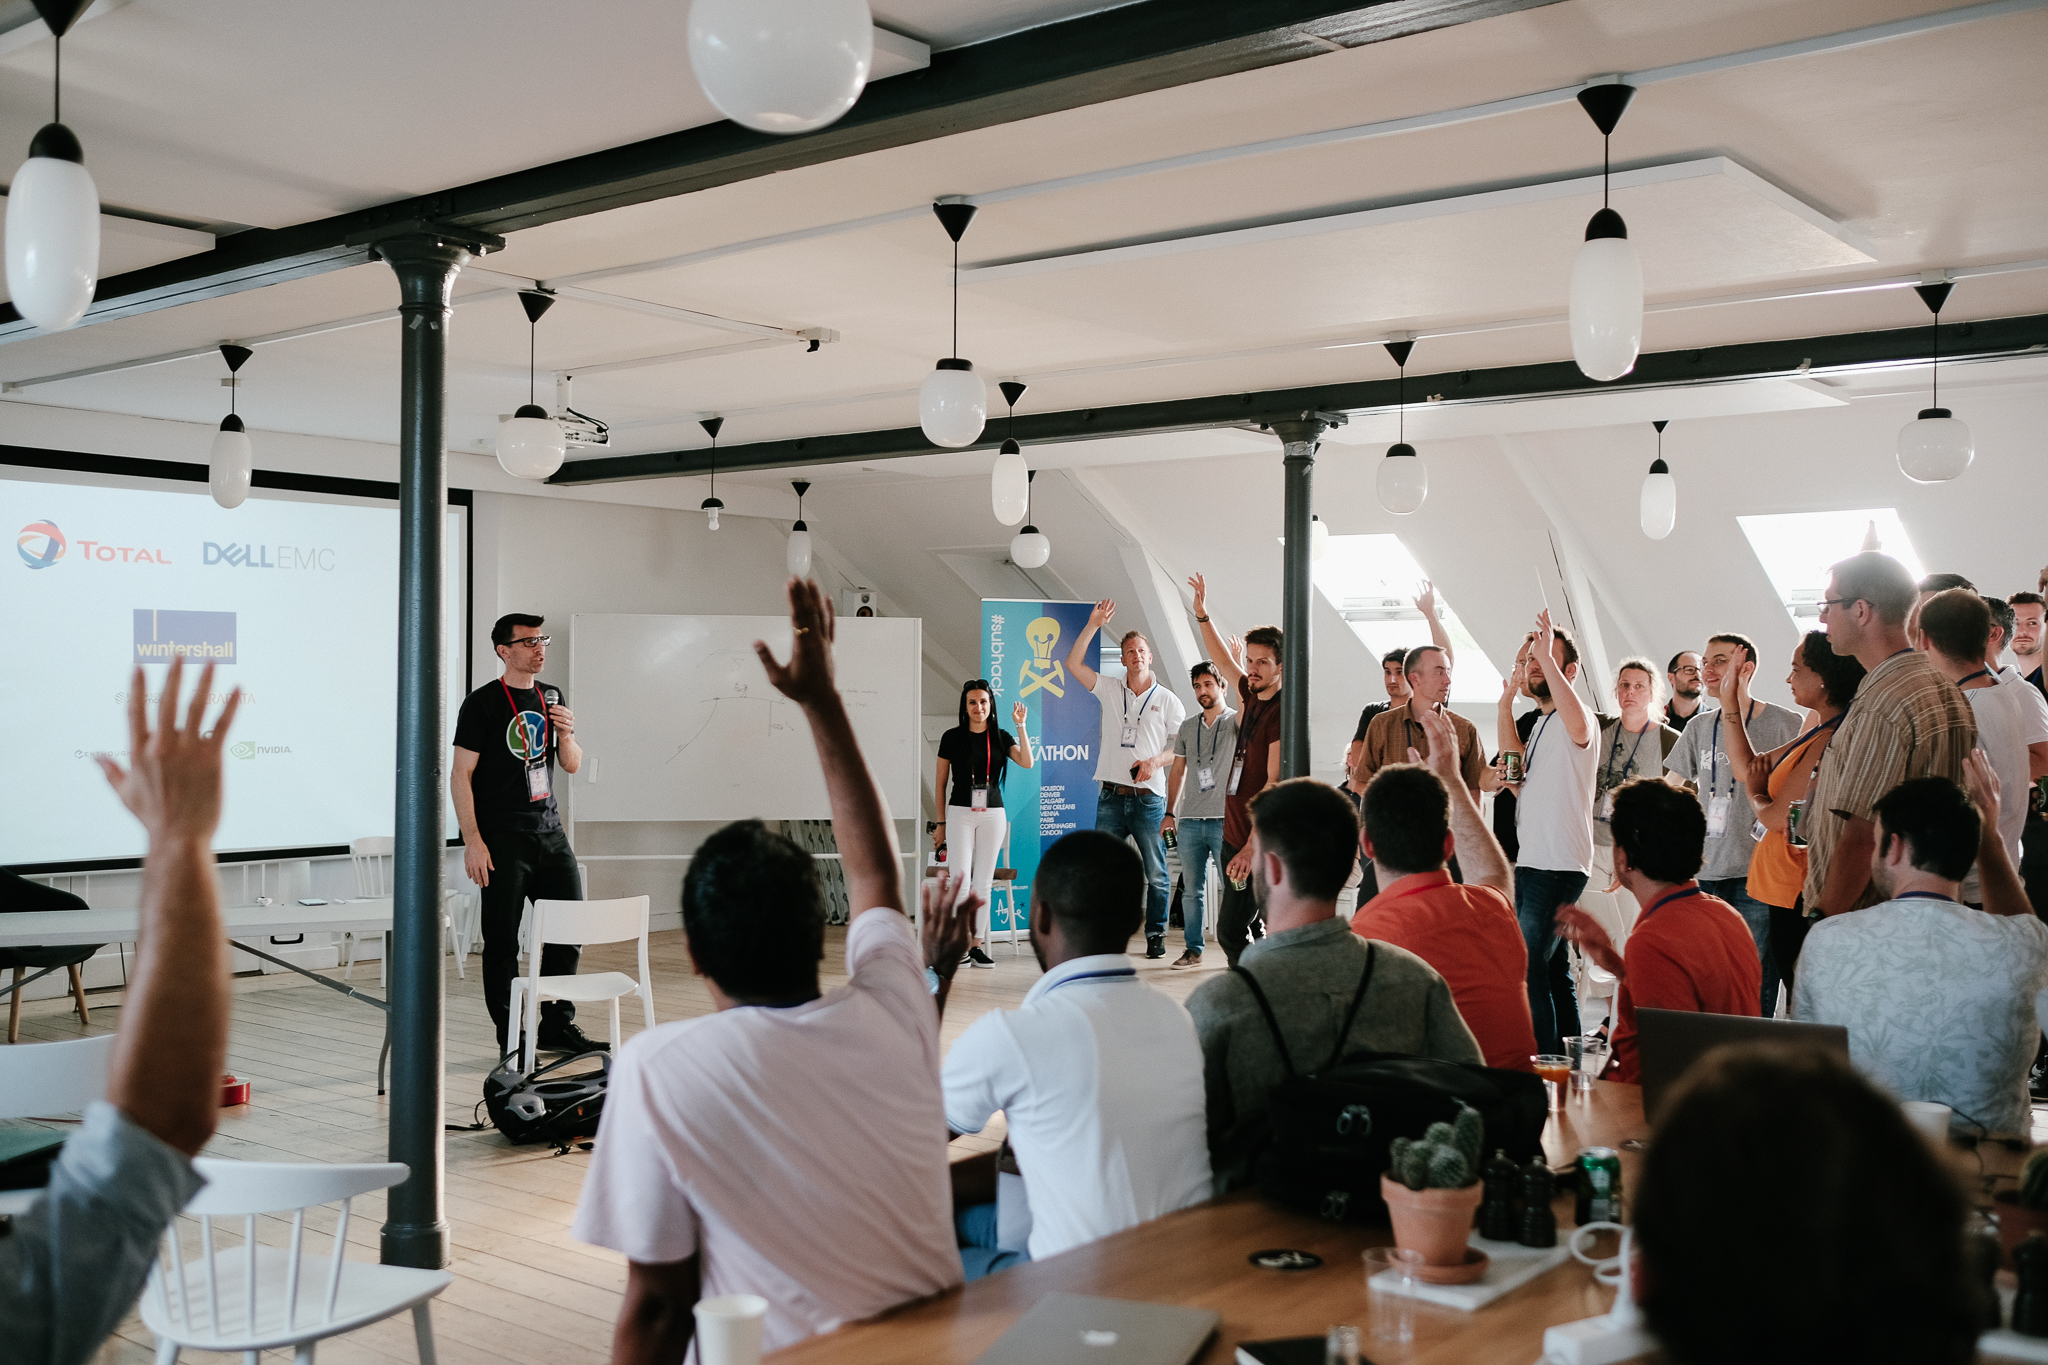
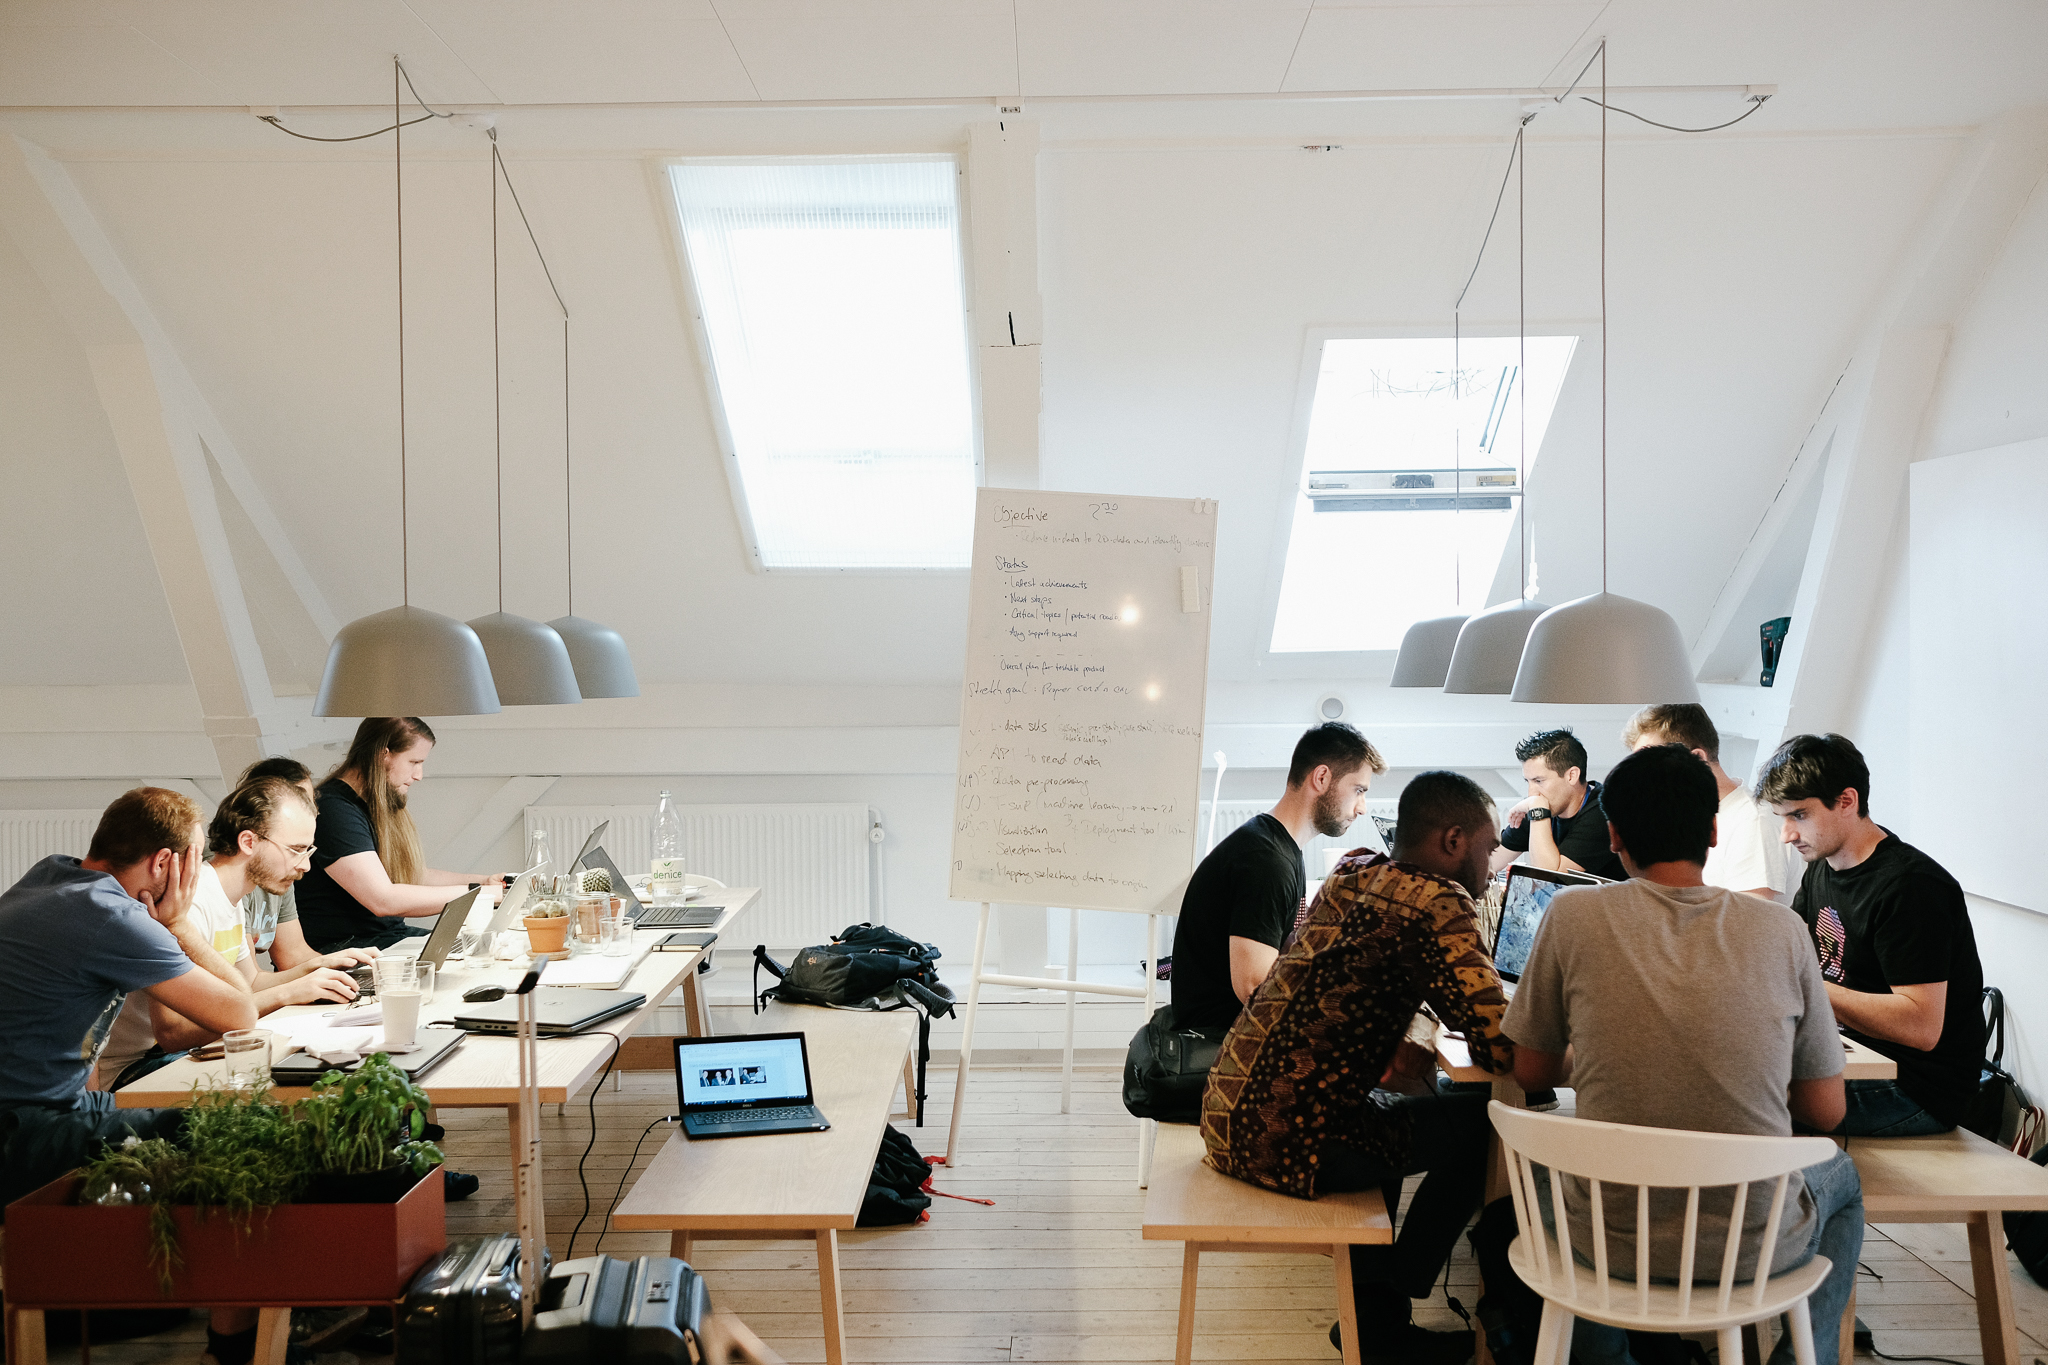
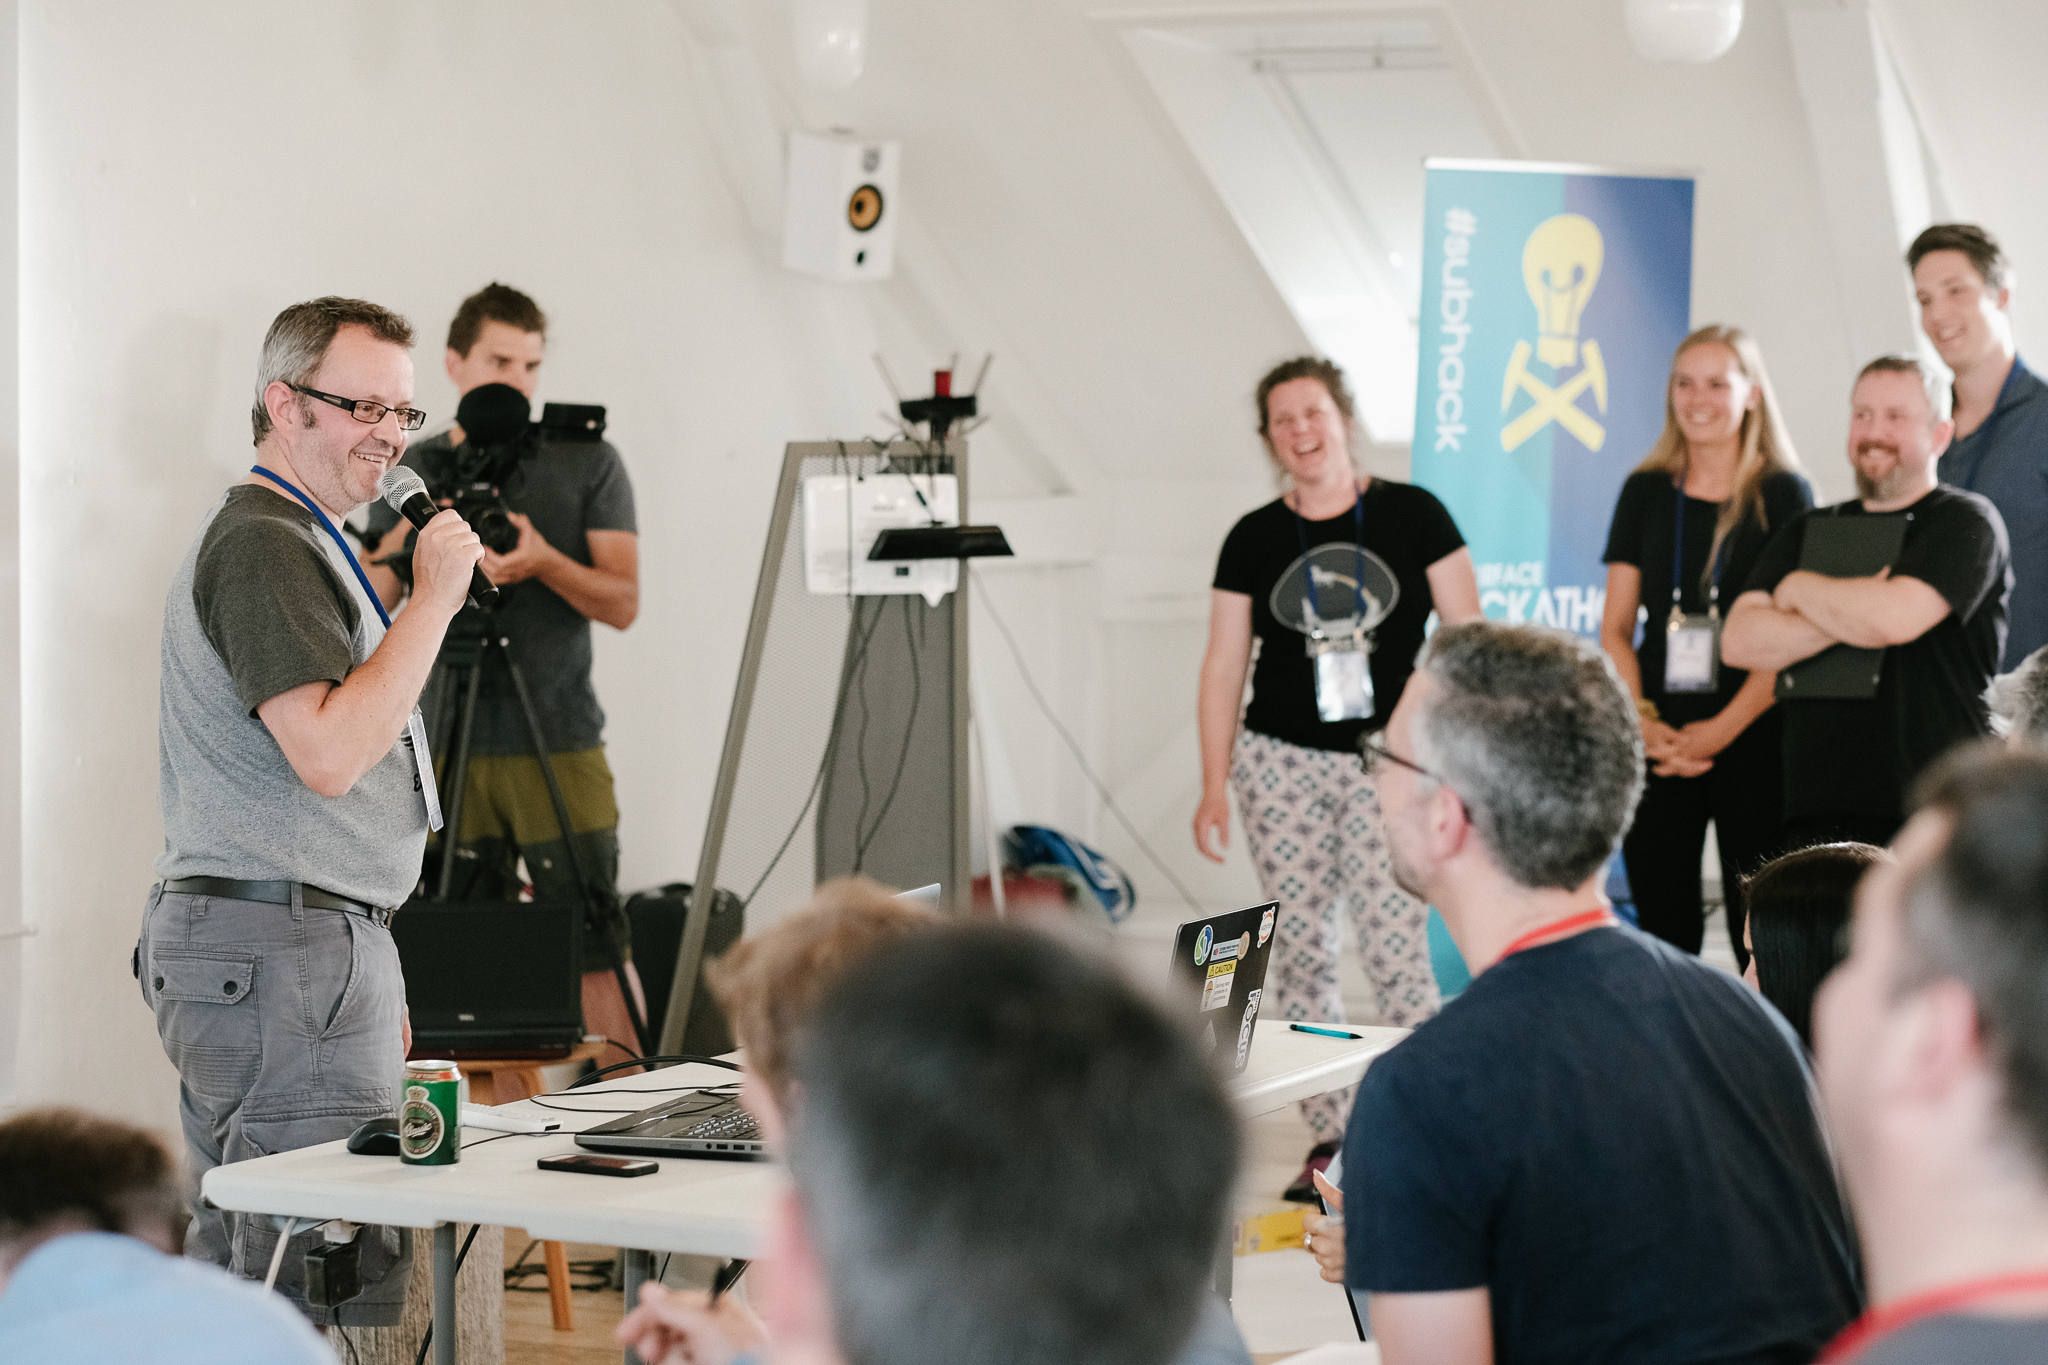
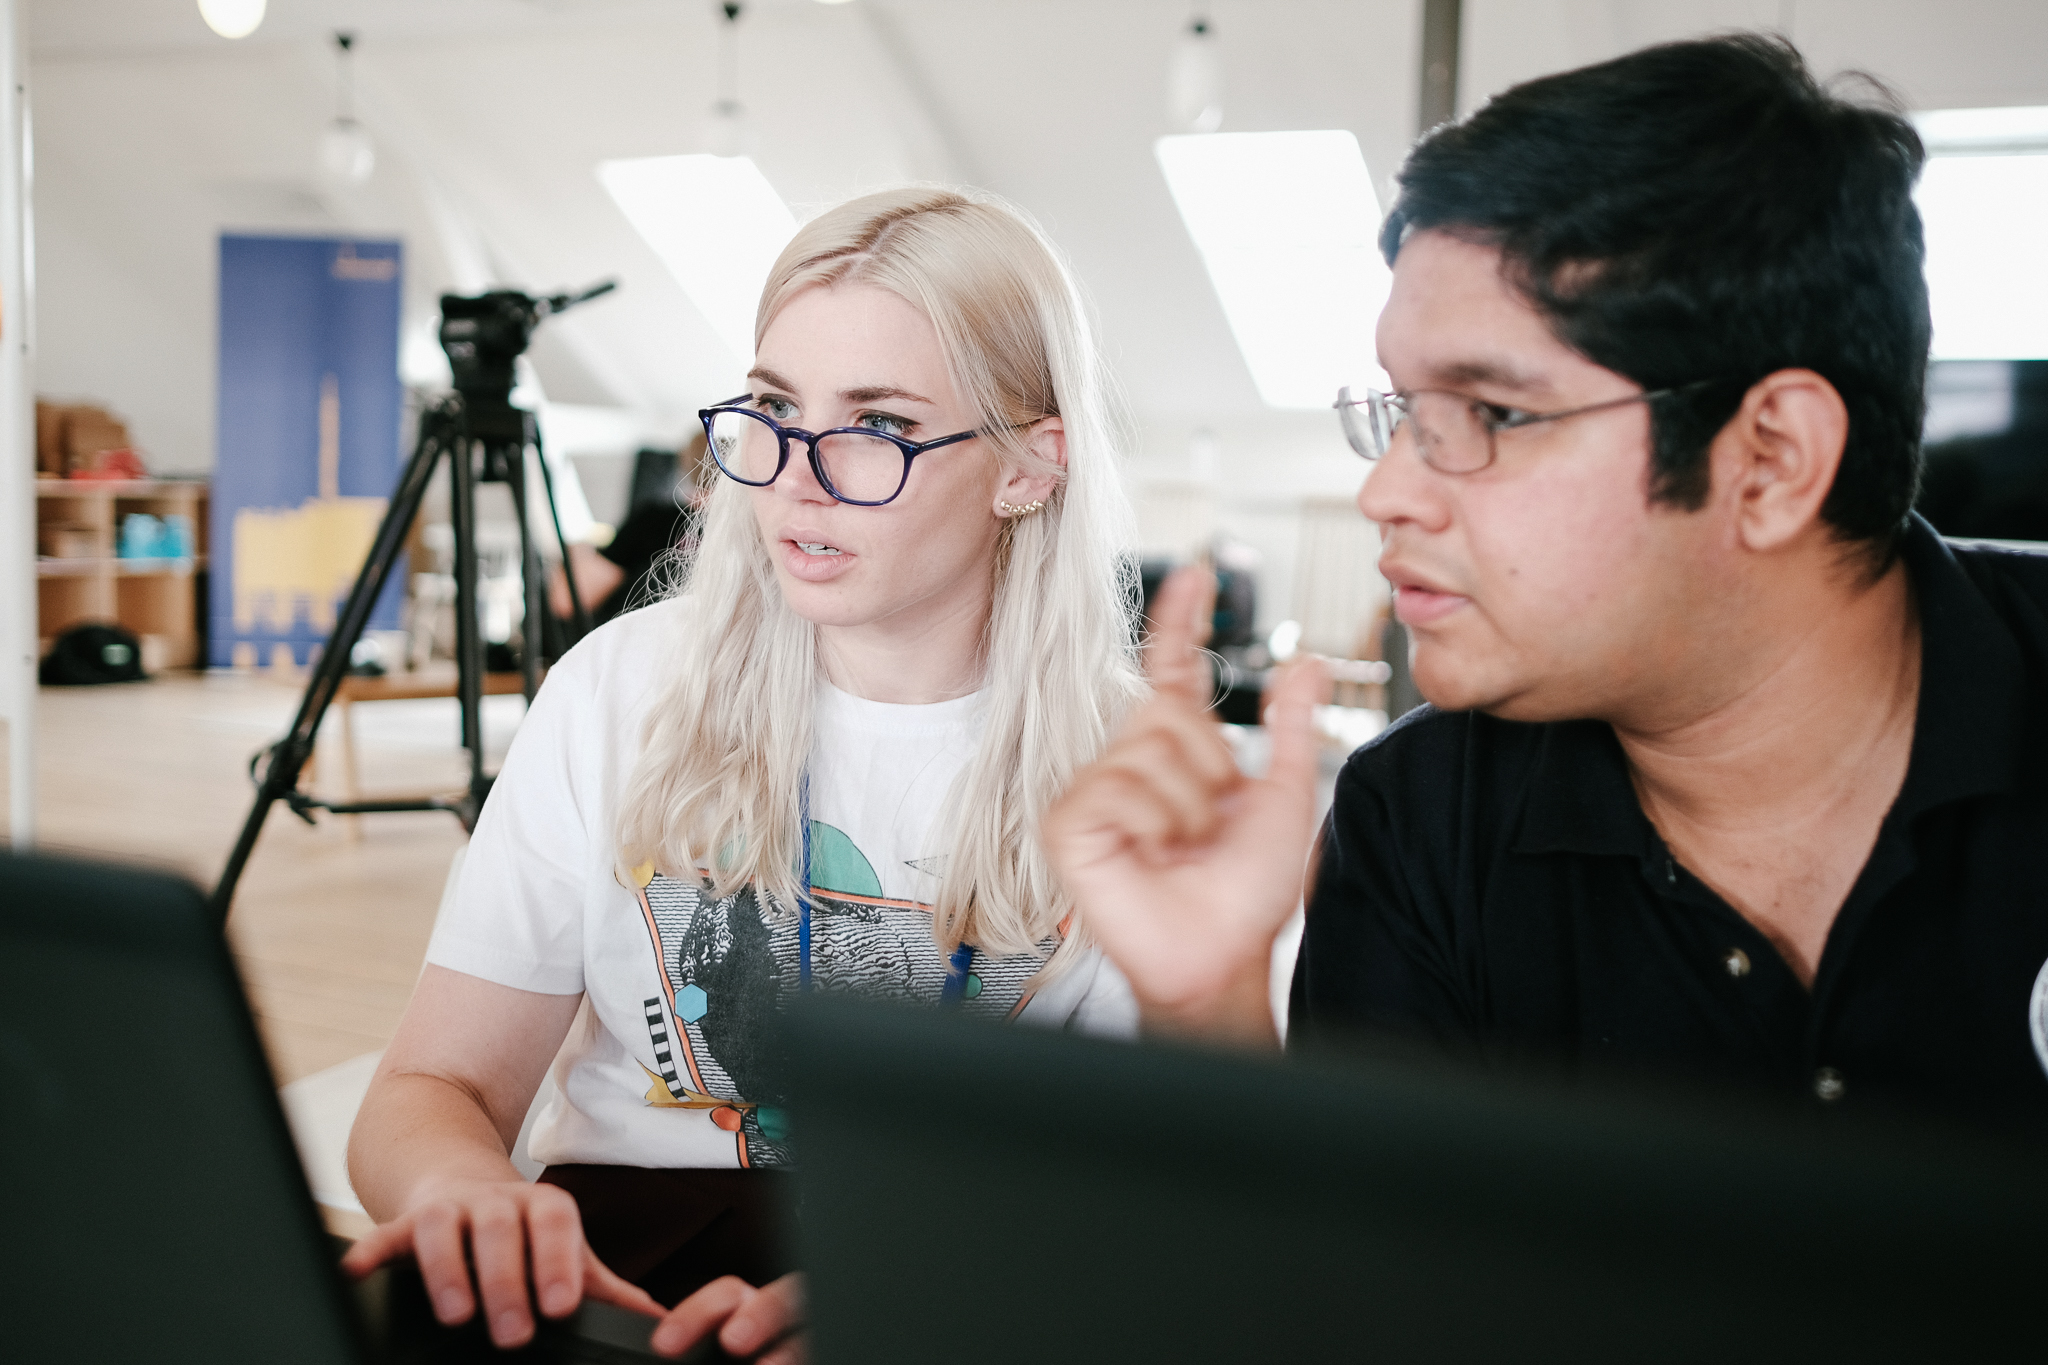
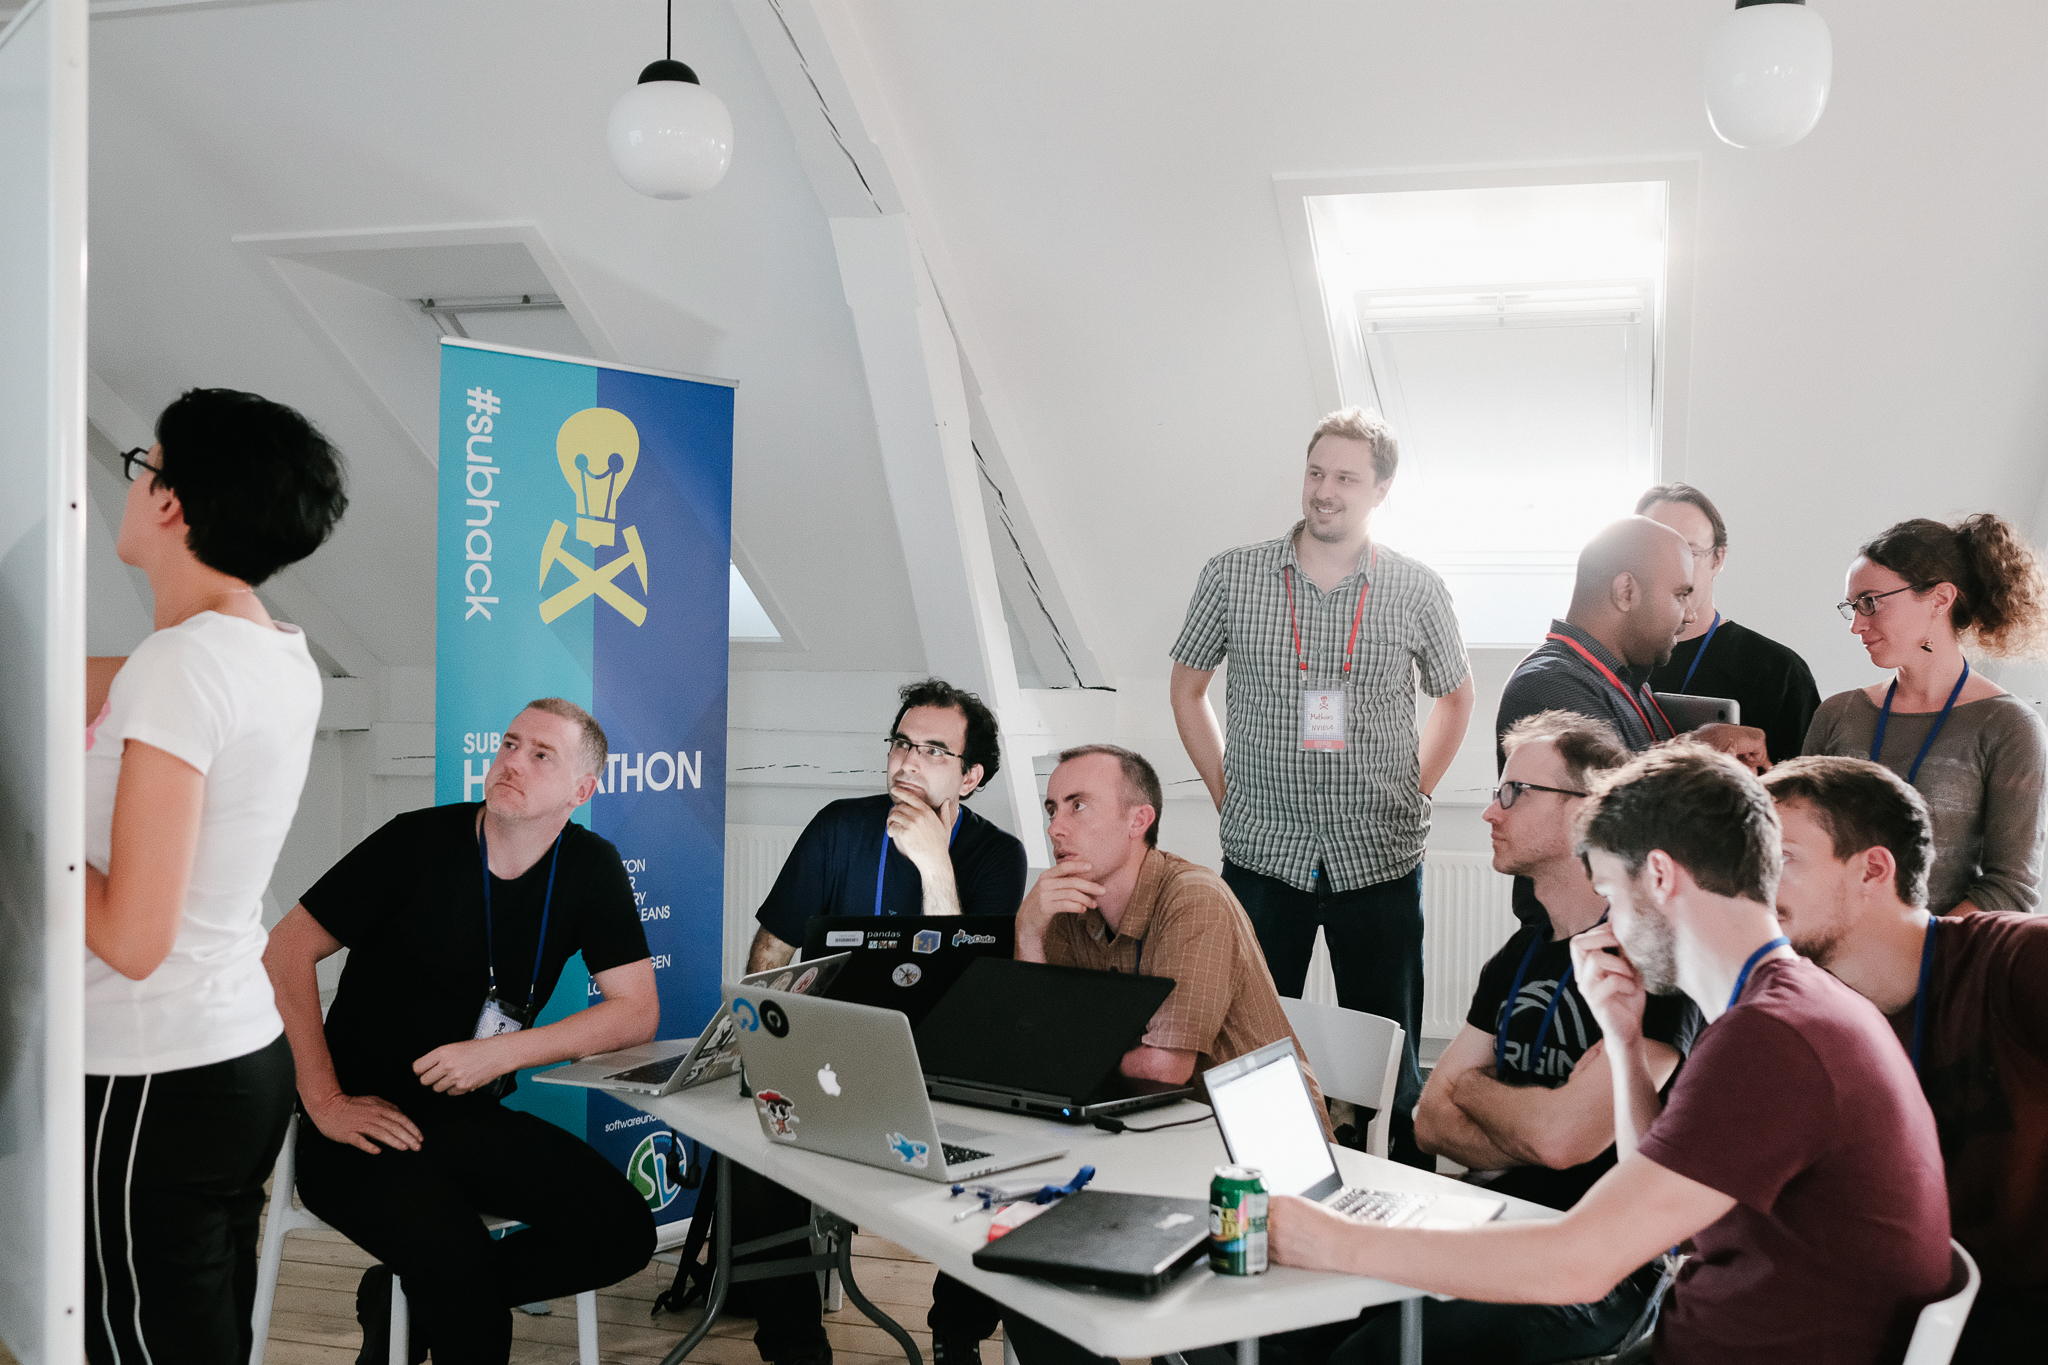
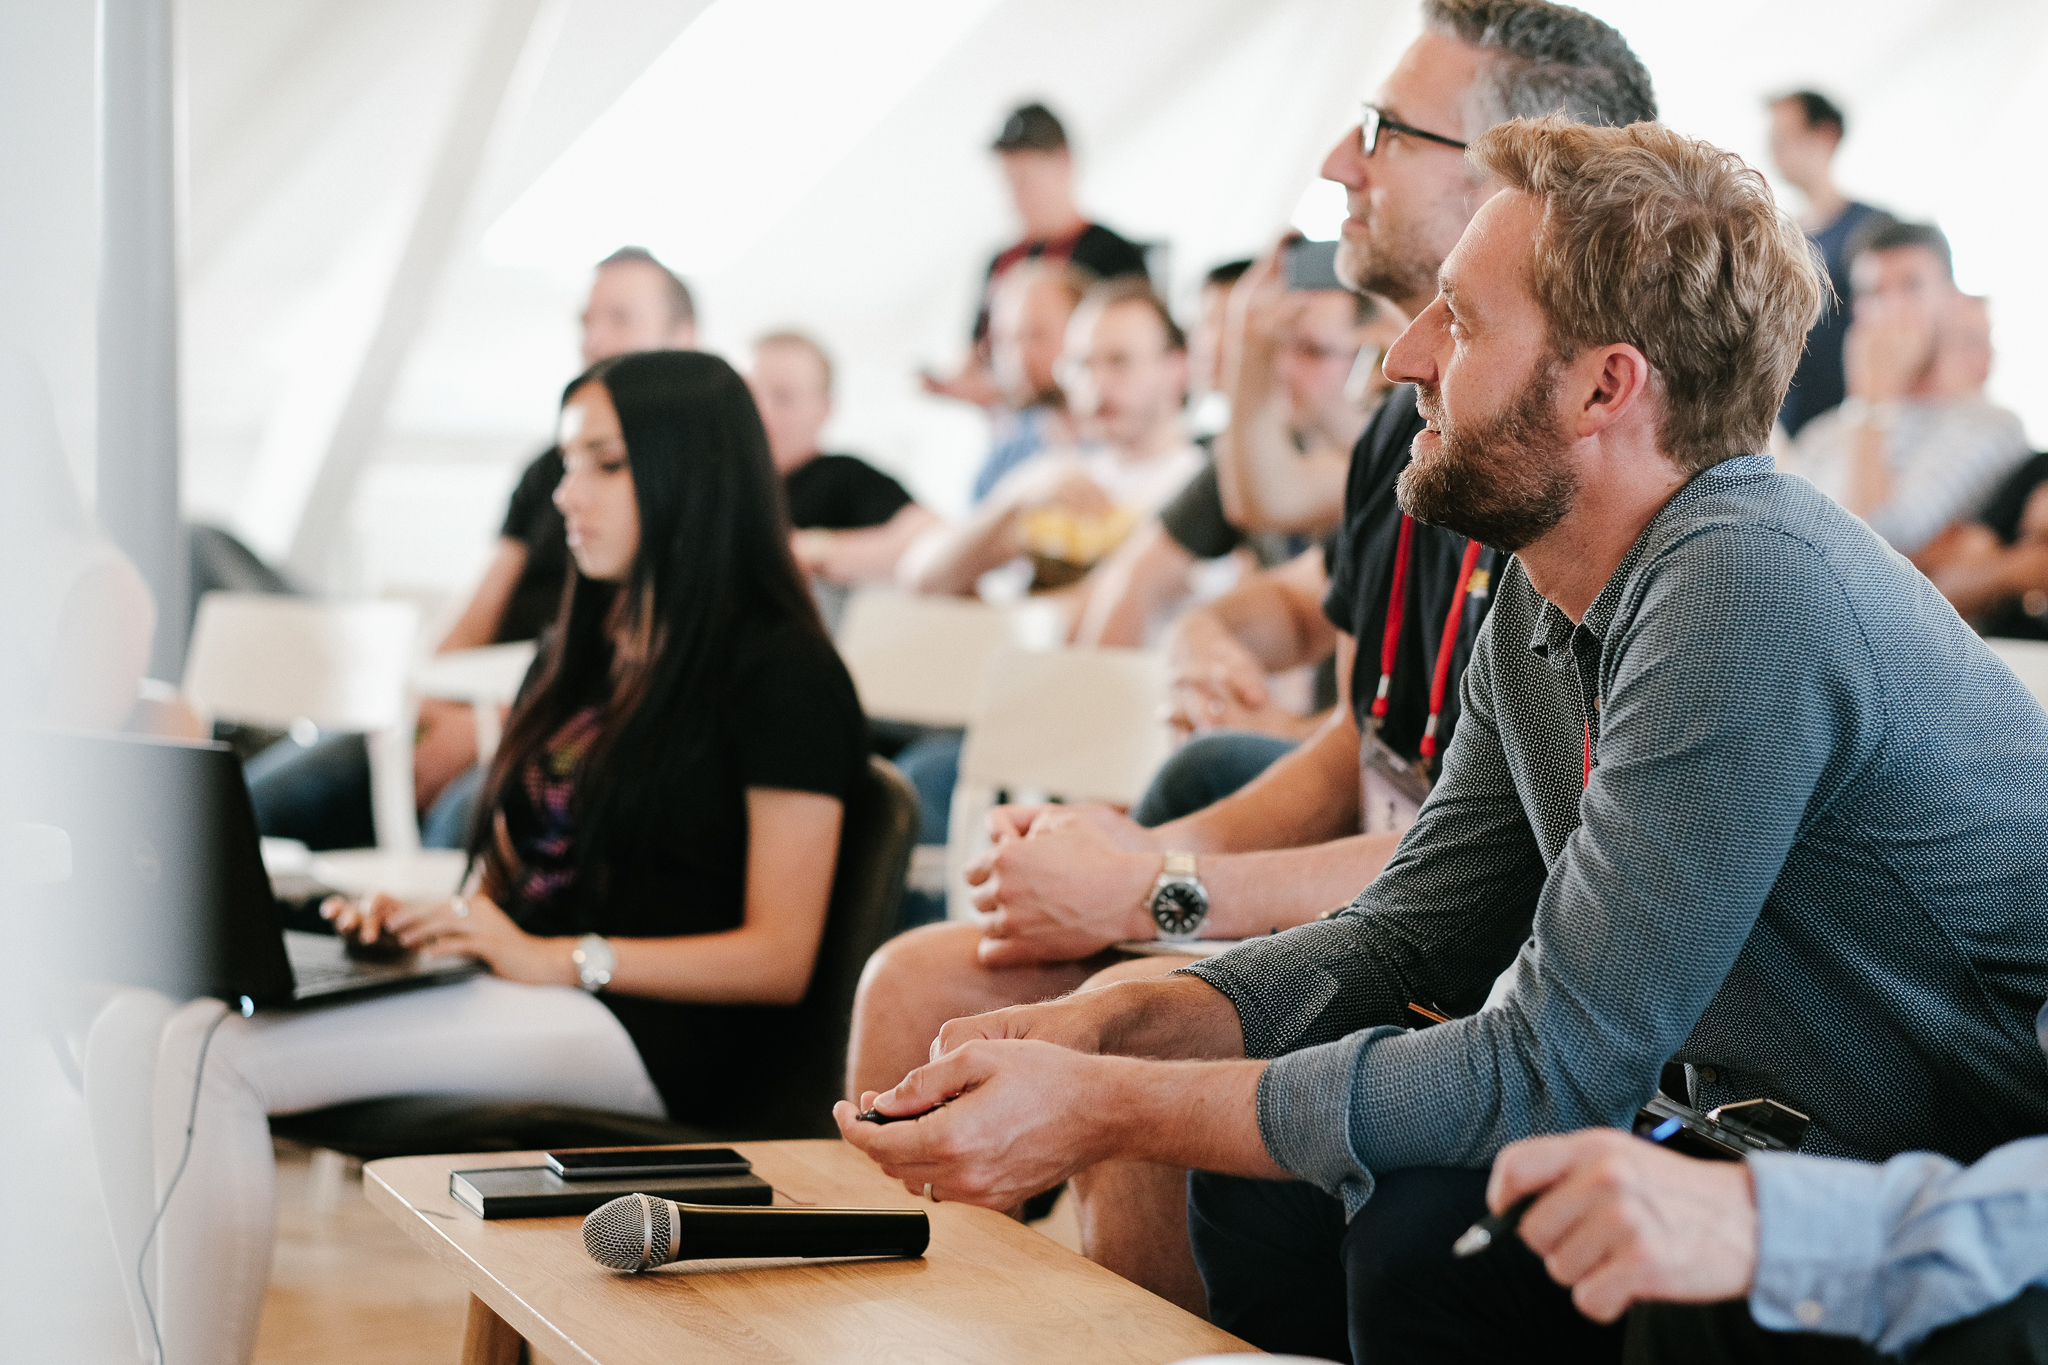
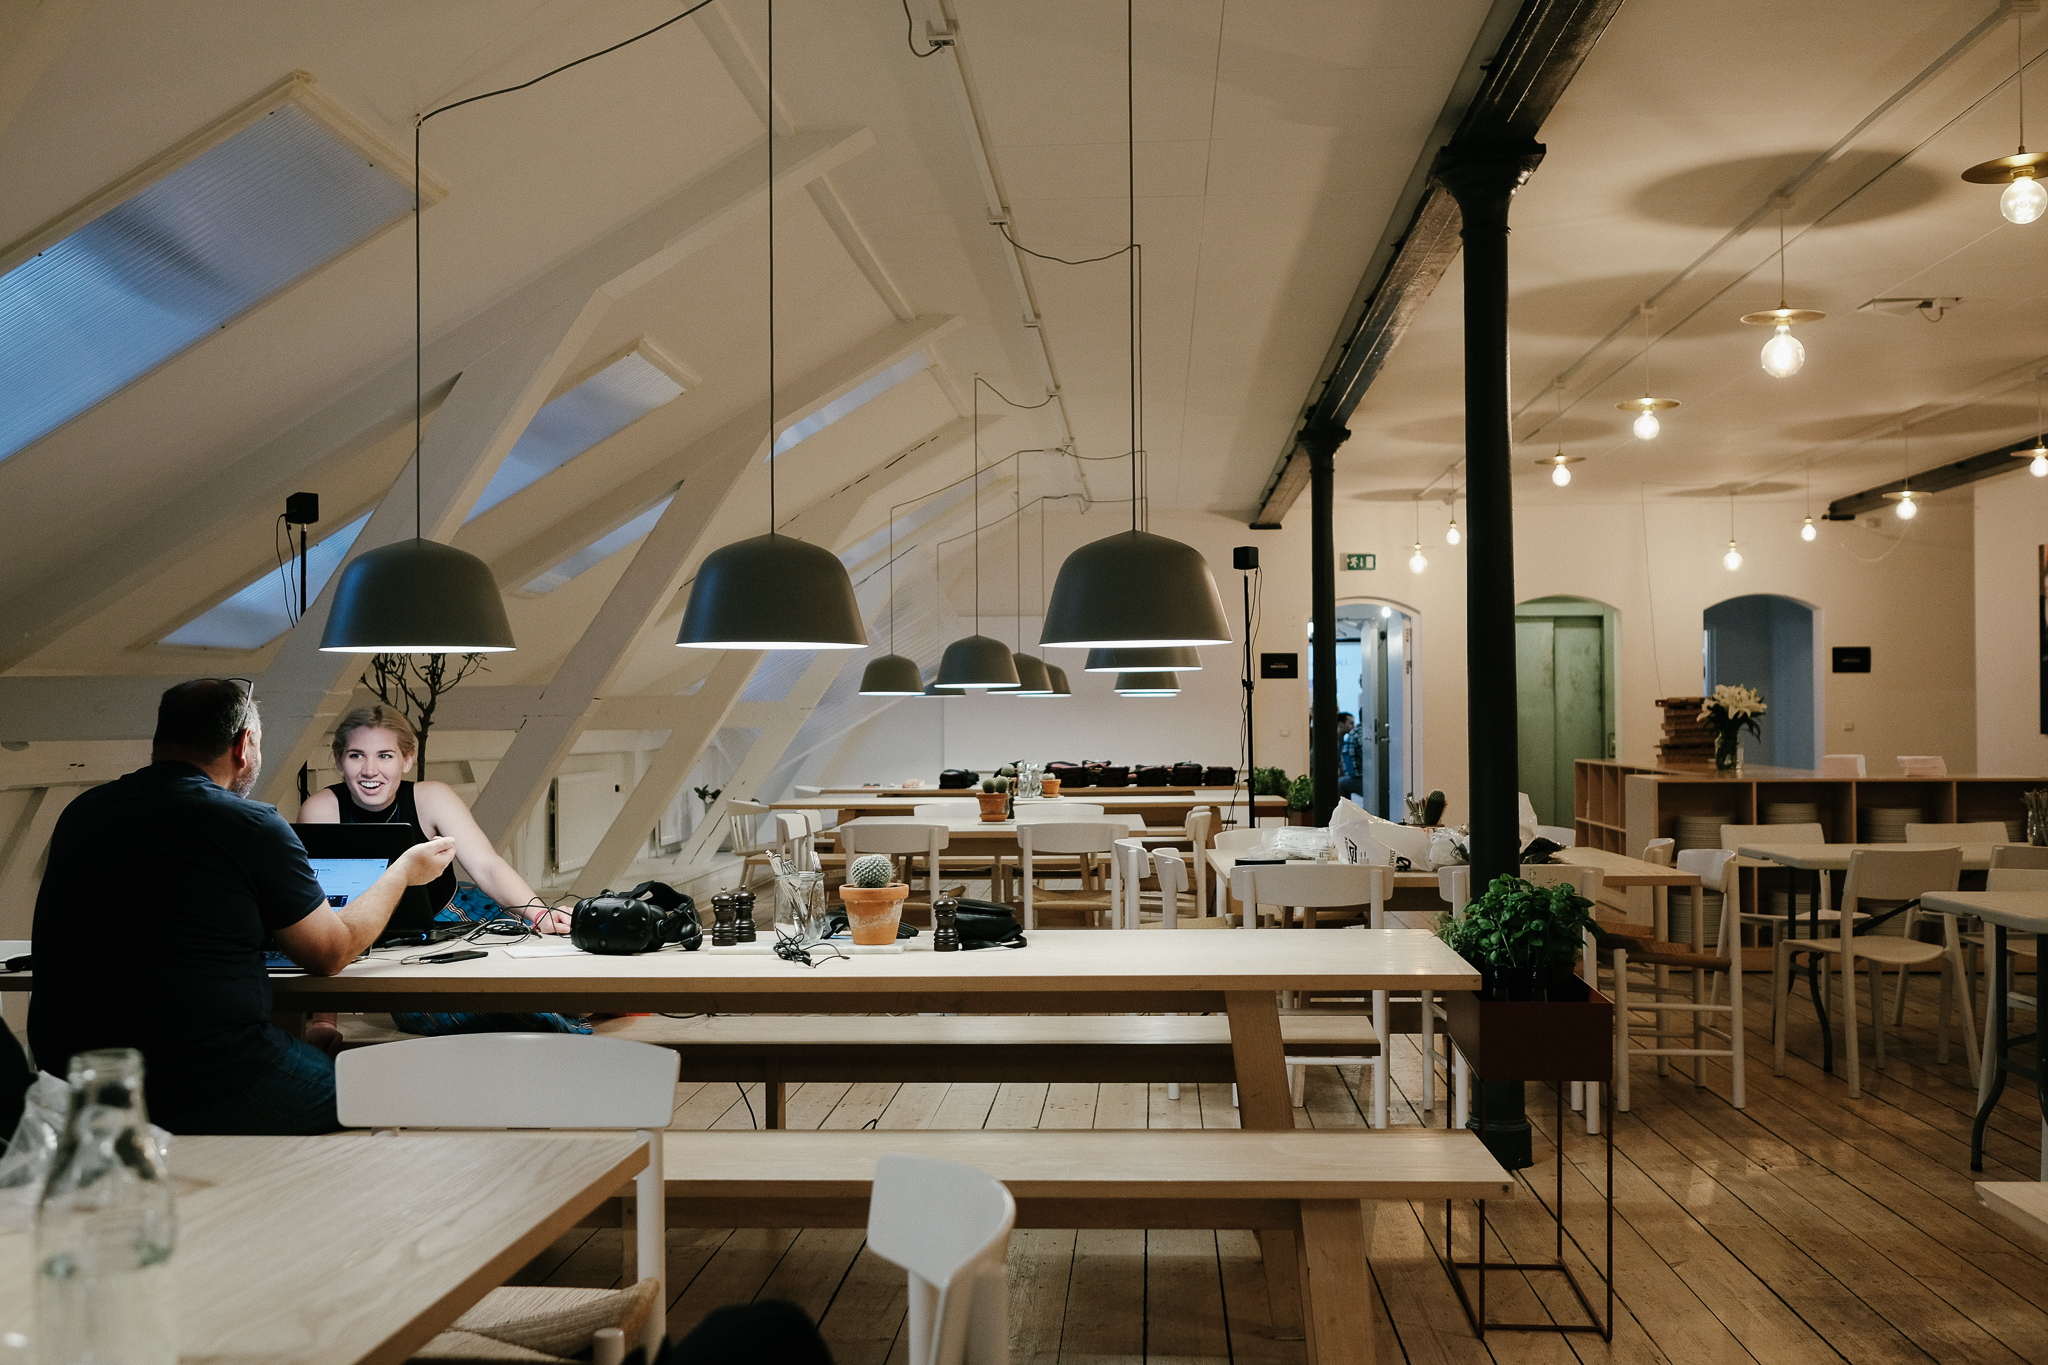
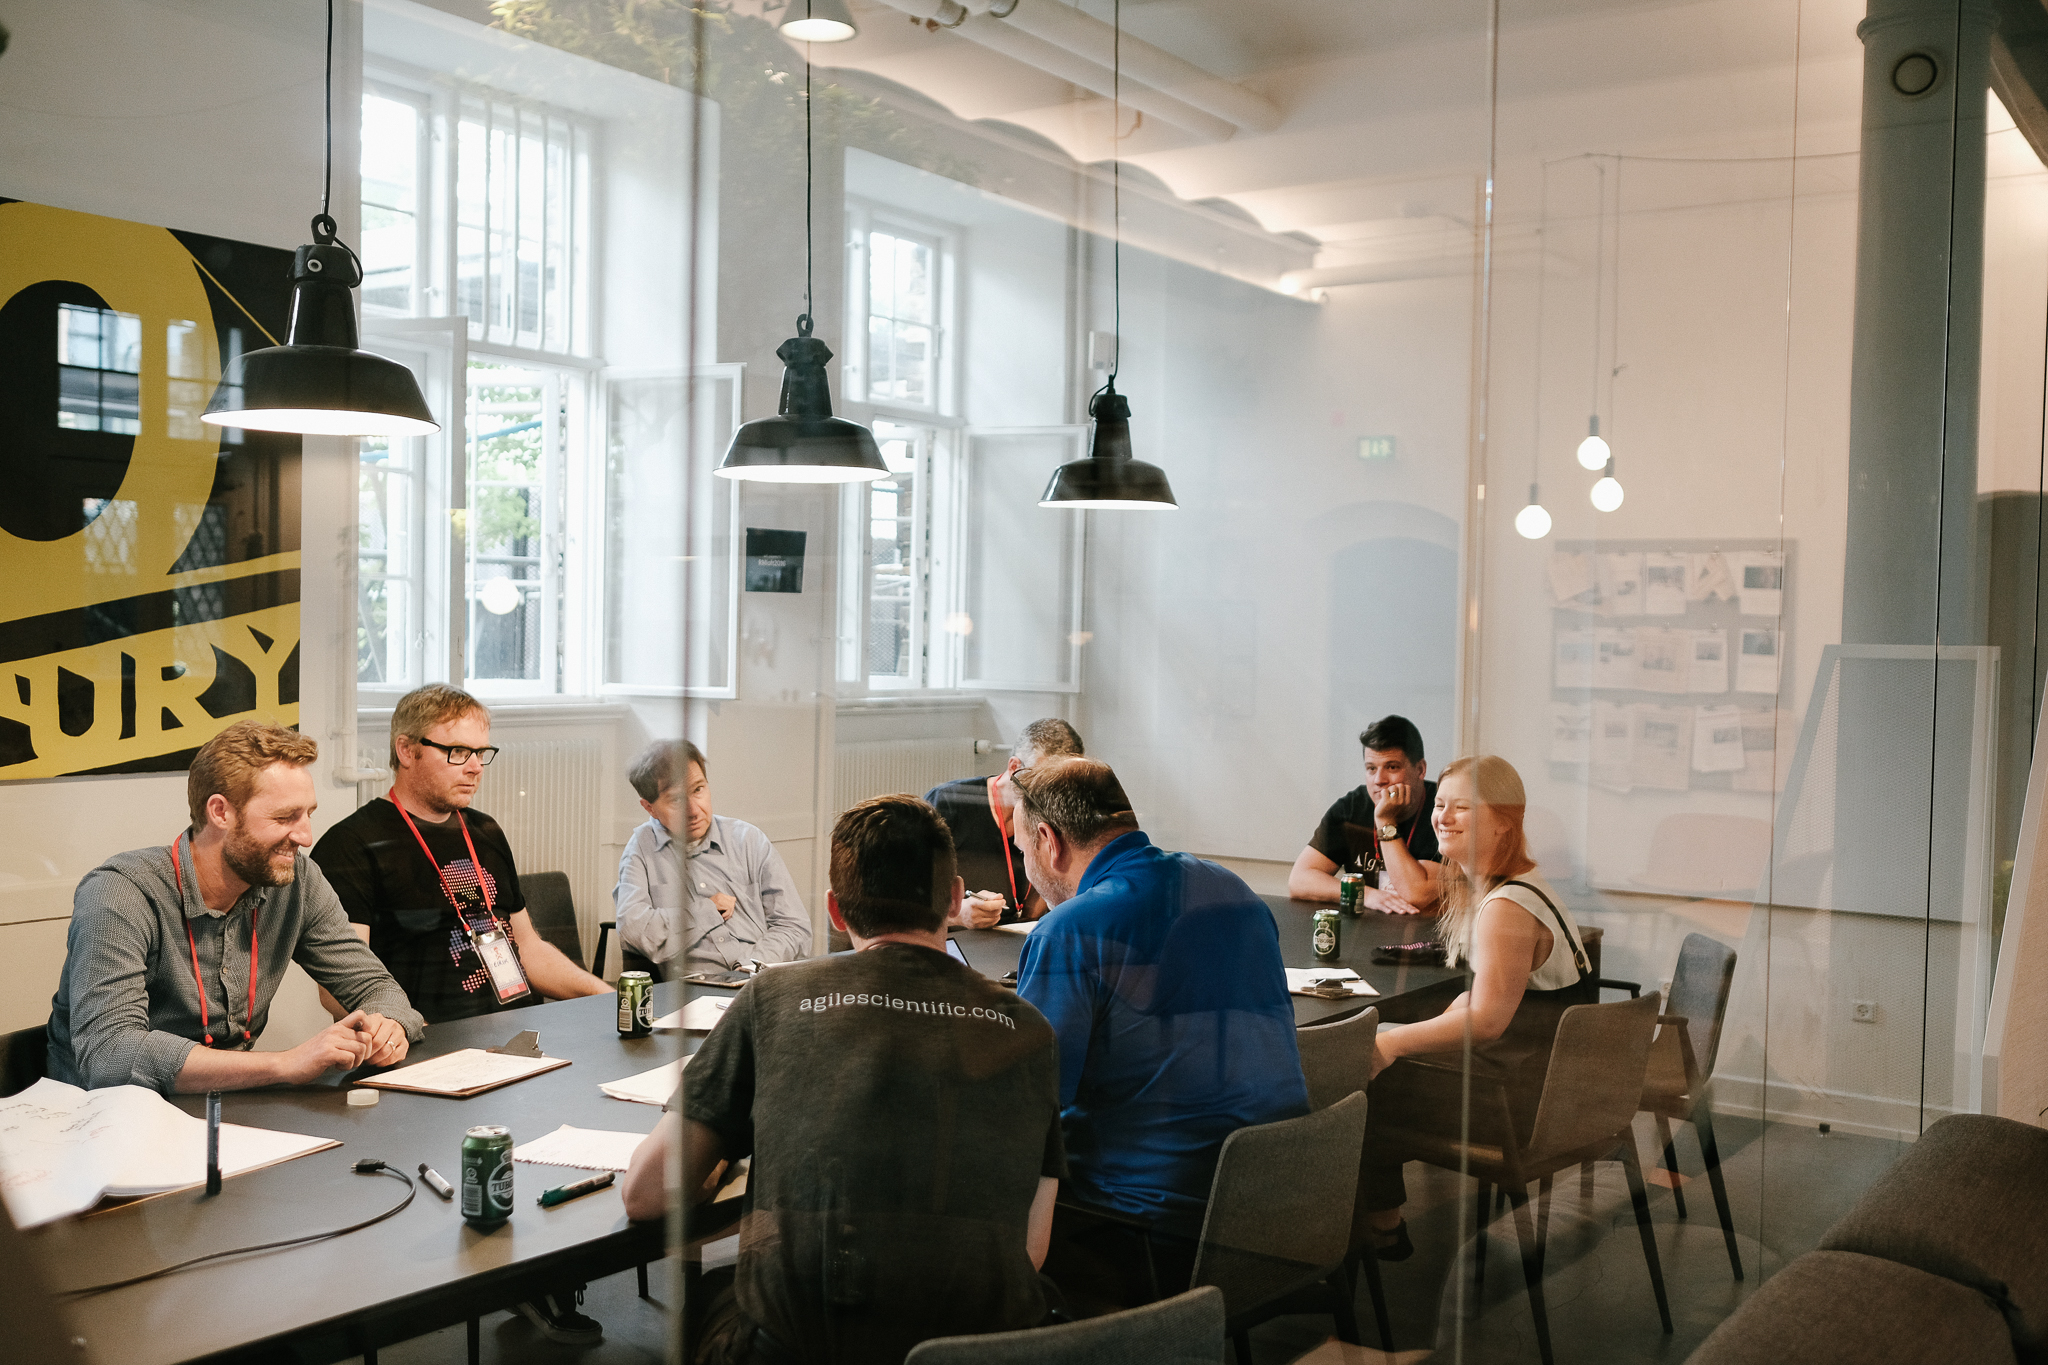
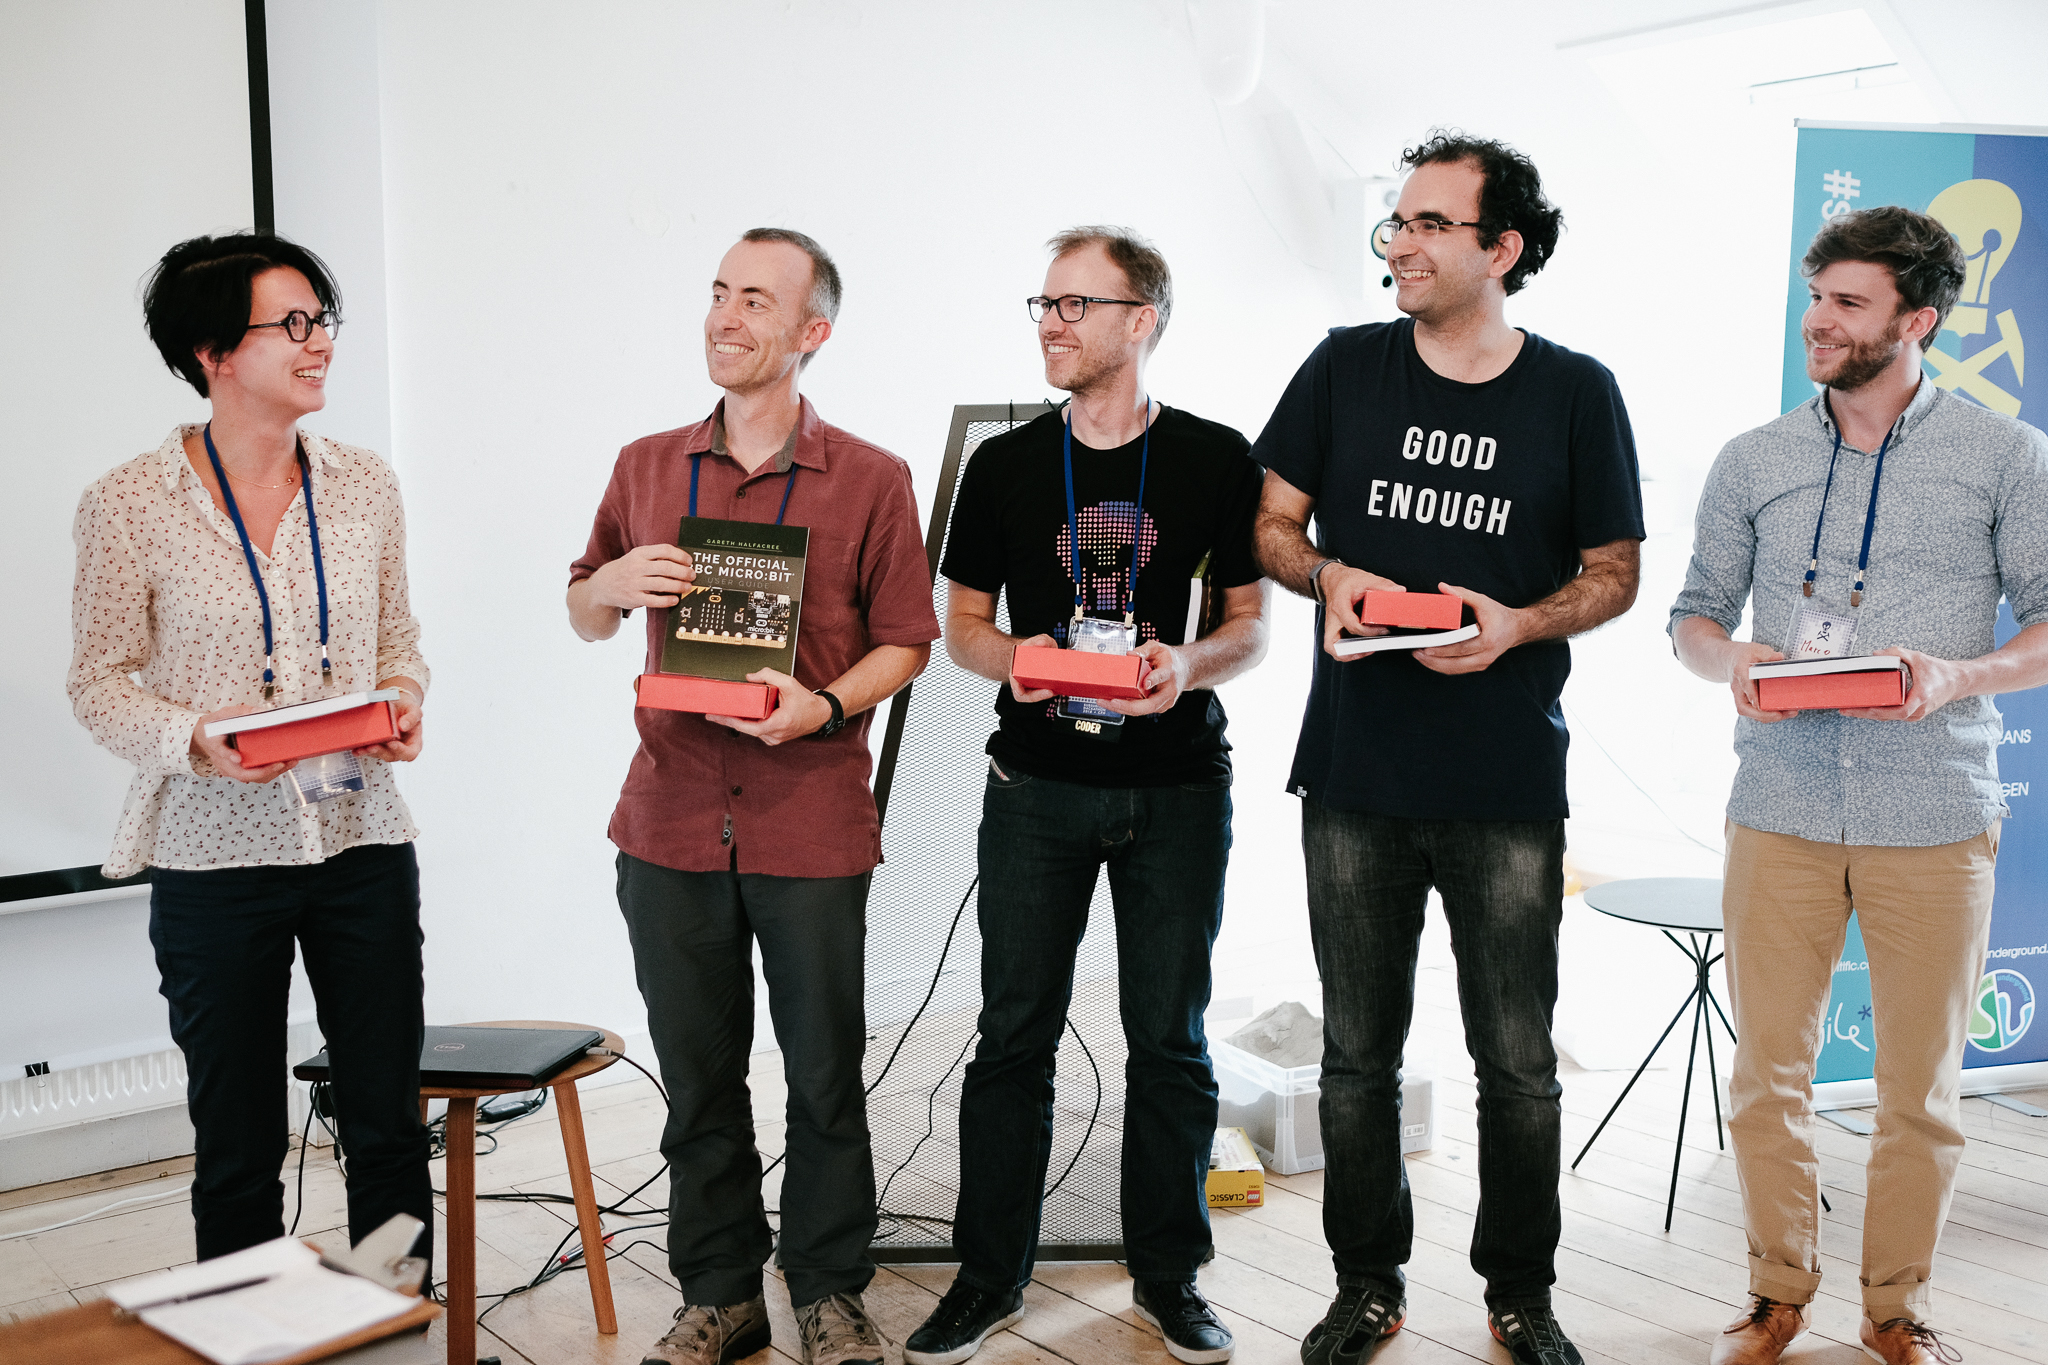
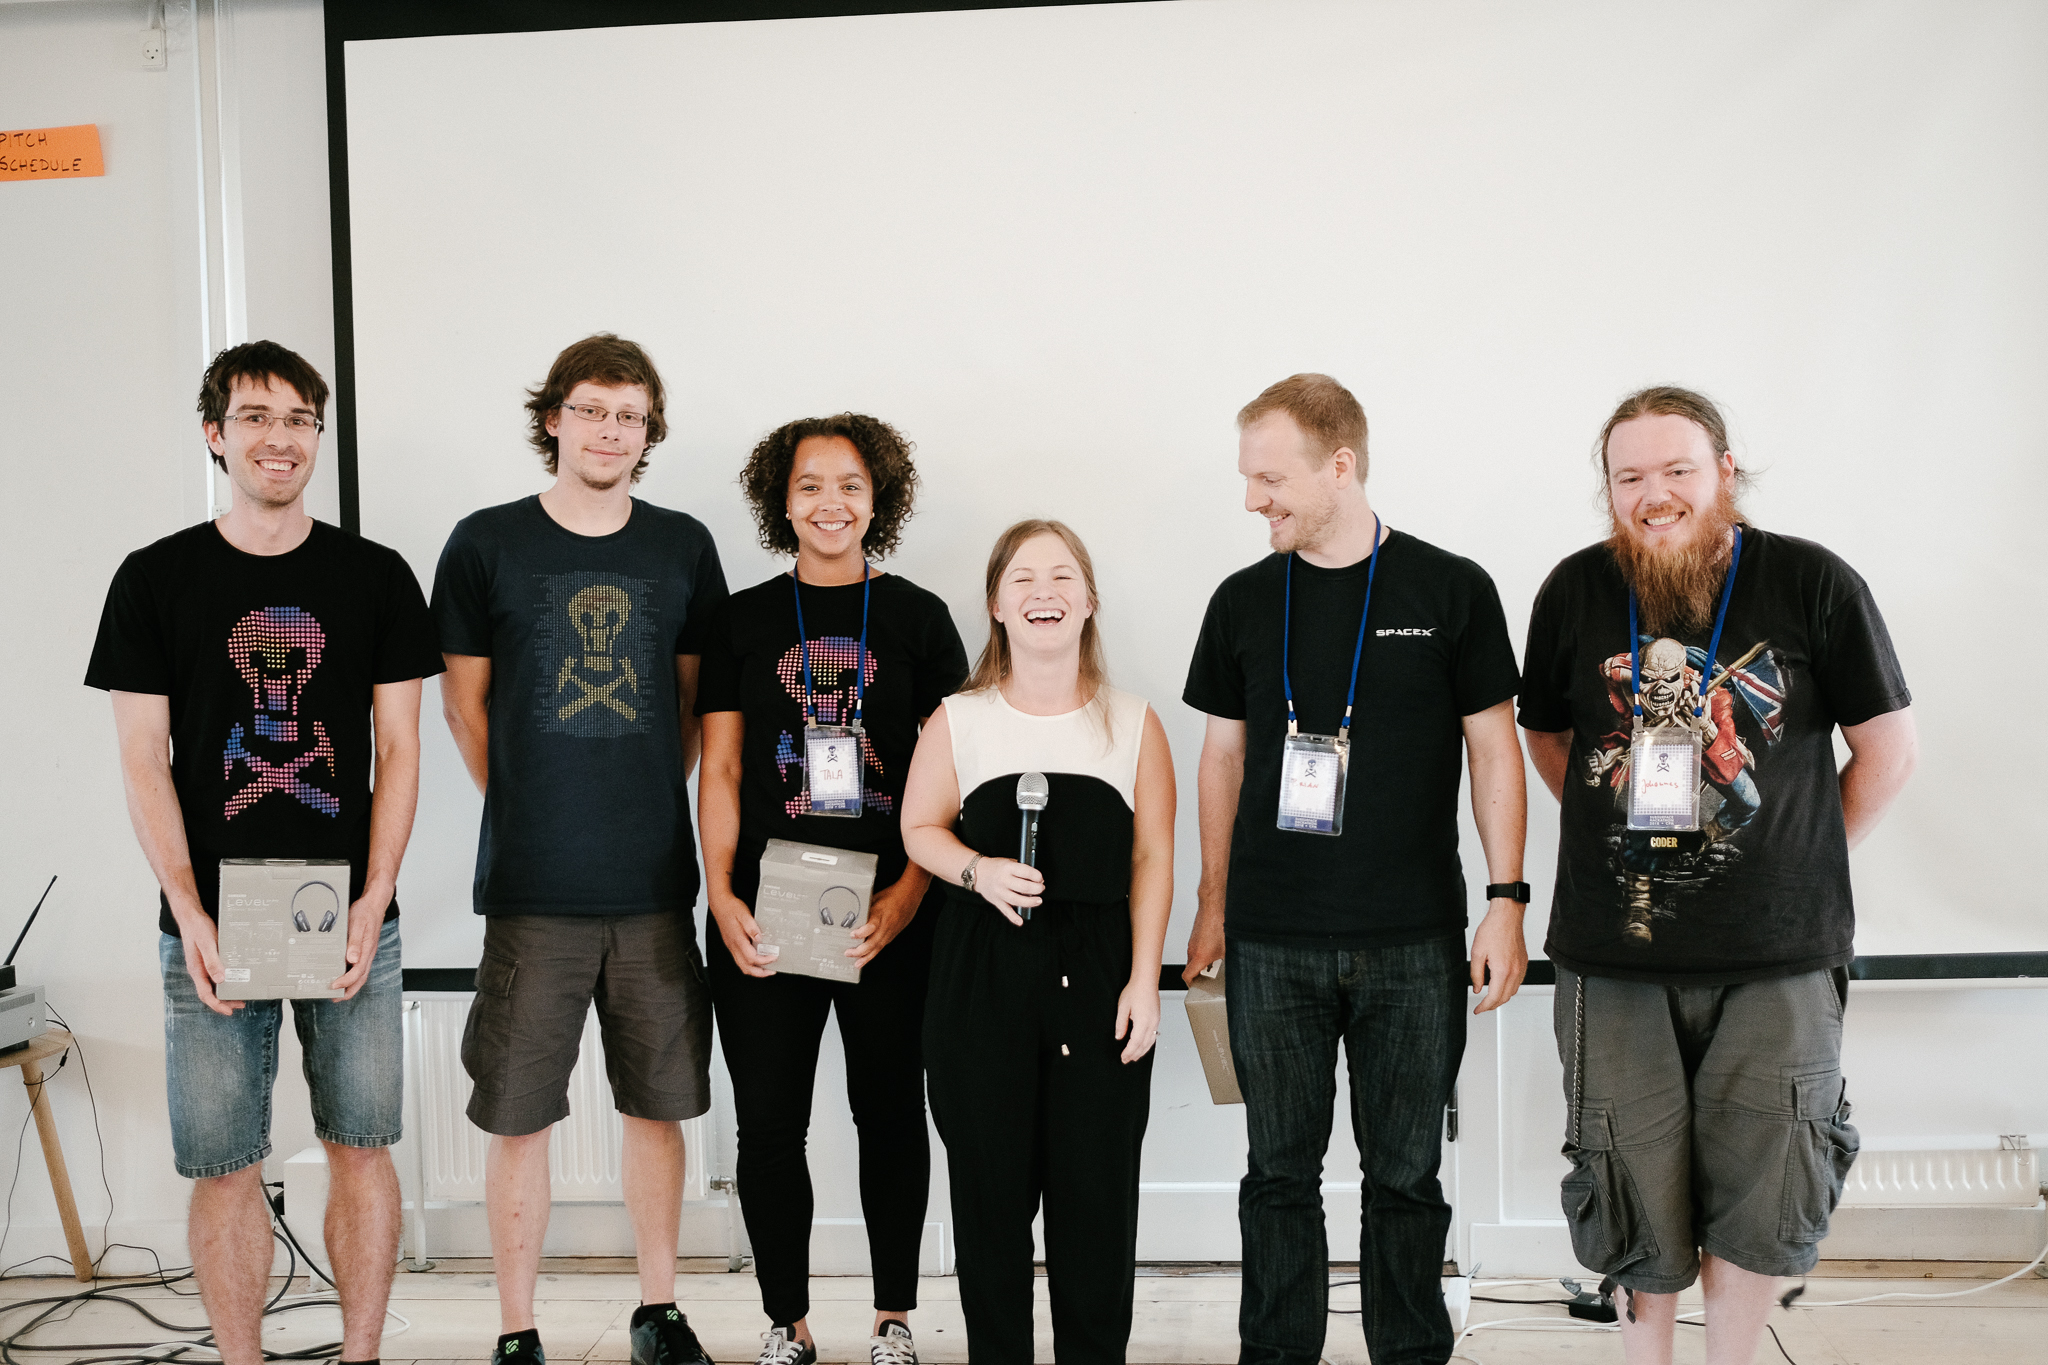
During th event, twelve teams dug into the theme of visualization and interaction. As in Houston last September, we started the event on Friday evening, after the Bootcamp (a full day of informal training). We have a bit of process to form the teams, and it usually takes a couple of hours. But with plenty of pizza and beer for fuel, the evening flew by. After that, it was two whole days of coding, followed by demos from all of the teams and a few prizes. Check out some of the pictures:

Thank you very much to everyone that helped make this event happen! Truly a cast of thousands:
- David Holmes of Dell EMC for unparallelled awesomeness.
- The whole Total team, but especially Frederic Broust, Sophie Segura, Yannick Pion, and Laurent Baduel...
- ...and also Arnaud Rodde for helping with the judging.
- The Wintershall team, especially Andreas Beha, who also acted as a judge.
- Brendon Hall of Enthought for sponsoring the event.
- Carlos Castro and Kim Saabye Pedersen of Amazon AWS.
- Mathias Hummel and Mahendra Roopa of NVIDIA.
- Eirik Larsen of Earth Science Analytics for sponsoring the event and helping with the judging.
- Duncan Irving of Teradata for sponsoring, and sorting out the T-shirts.
- Monica Beech of Ikon Science for participating in the judging.
- Matthias Hartung of Target for acting as a judge again.
- Oliver Ranneries, plus Nina and Eva of Rainmaking Loft.
- Christopher Backholm for taking such great photographs.
Finally, some statistics from the event:
- 63 participants, including 8 women (still way too few, but 100% better than 4 out of 63 in Paris)
- 15 students plus a handful of post-docs.
- 19 people from petroleum companies.
- 20 people from service and technology companies, including 7 from GiGa-infosystems!
- 1 no-show, which I think is a new record.
I will write a summary of all the projects in a couple of weeks when I've caught my breath. In the meantime, you can read a bit about them on our new events portal. We'll be steadily improving this new tool over the coming weeks and months.
That's it for another year... except we'll be back in Europe before the end of the year. There's the FORCE Hackathon in Stavanger in September, then in November we'll be in Aberdeen and London running some events with the Oil and Gas Authority. If you want some machine learning fun, or are looking for a new challenge, please come along!

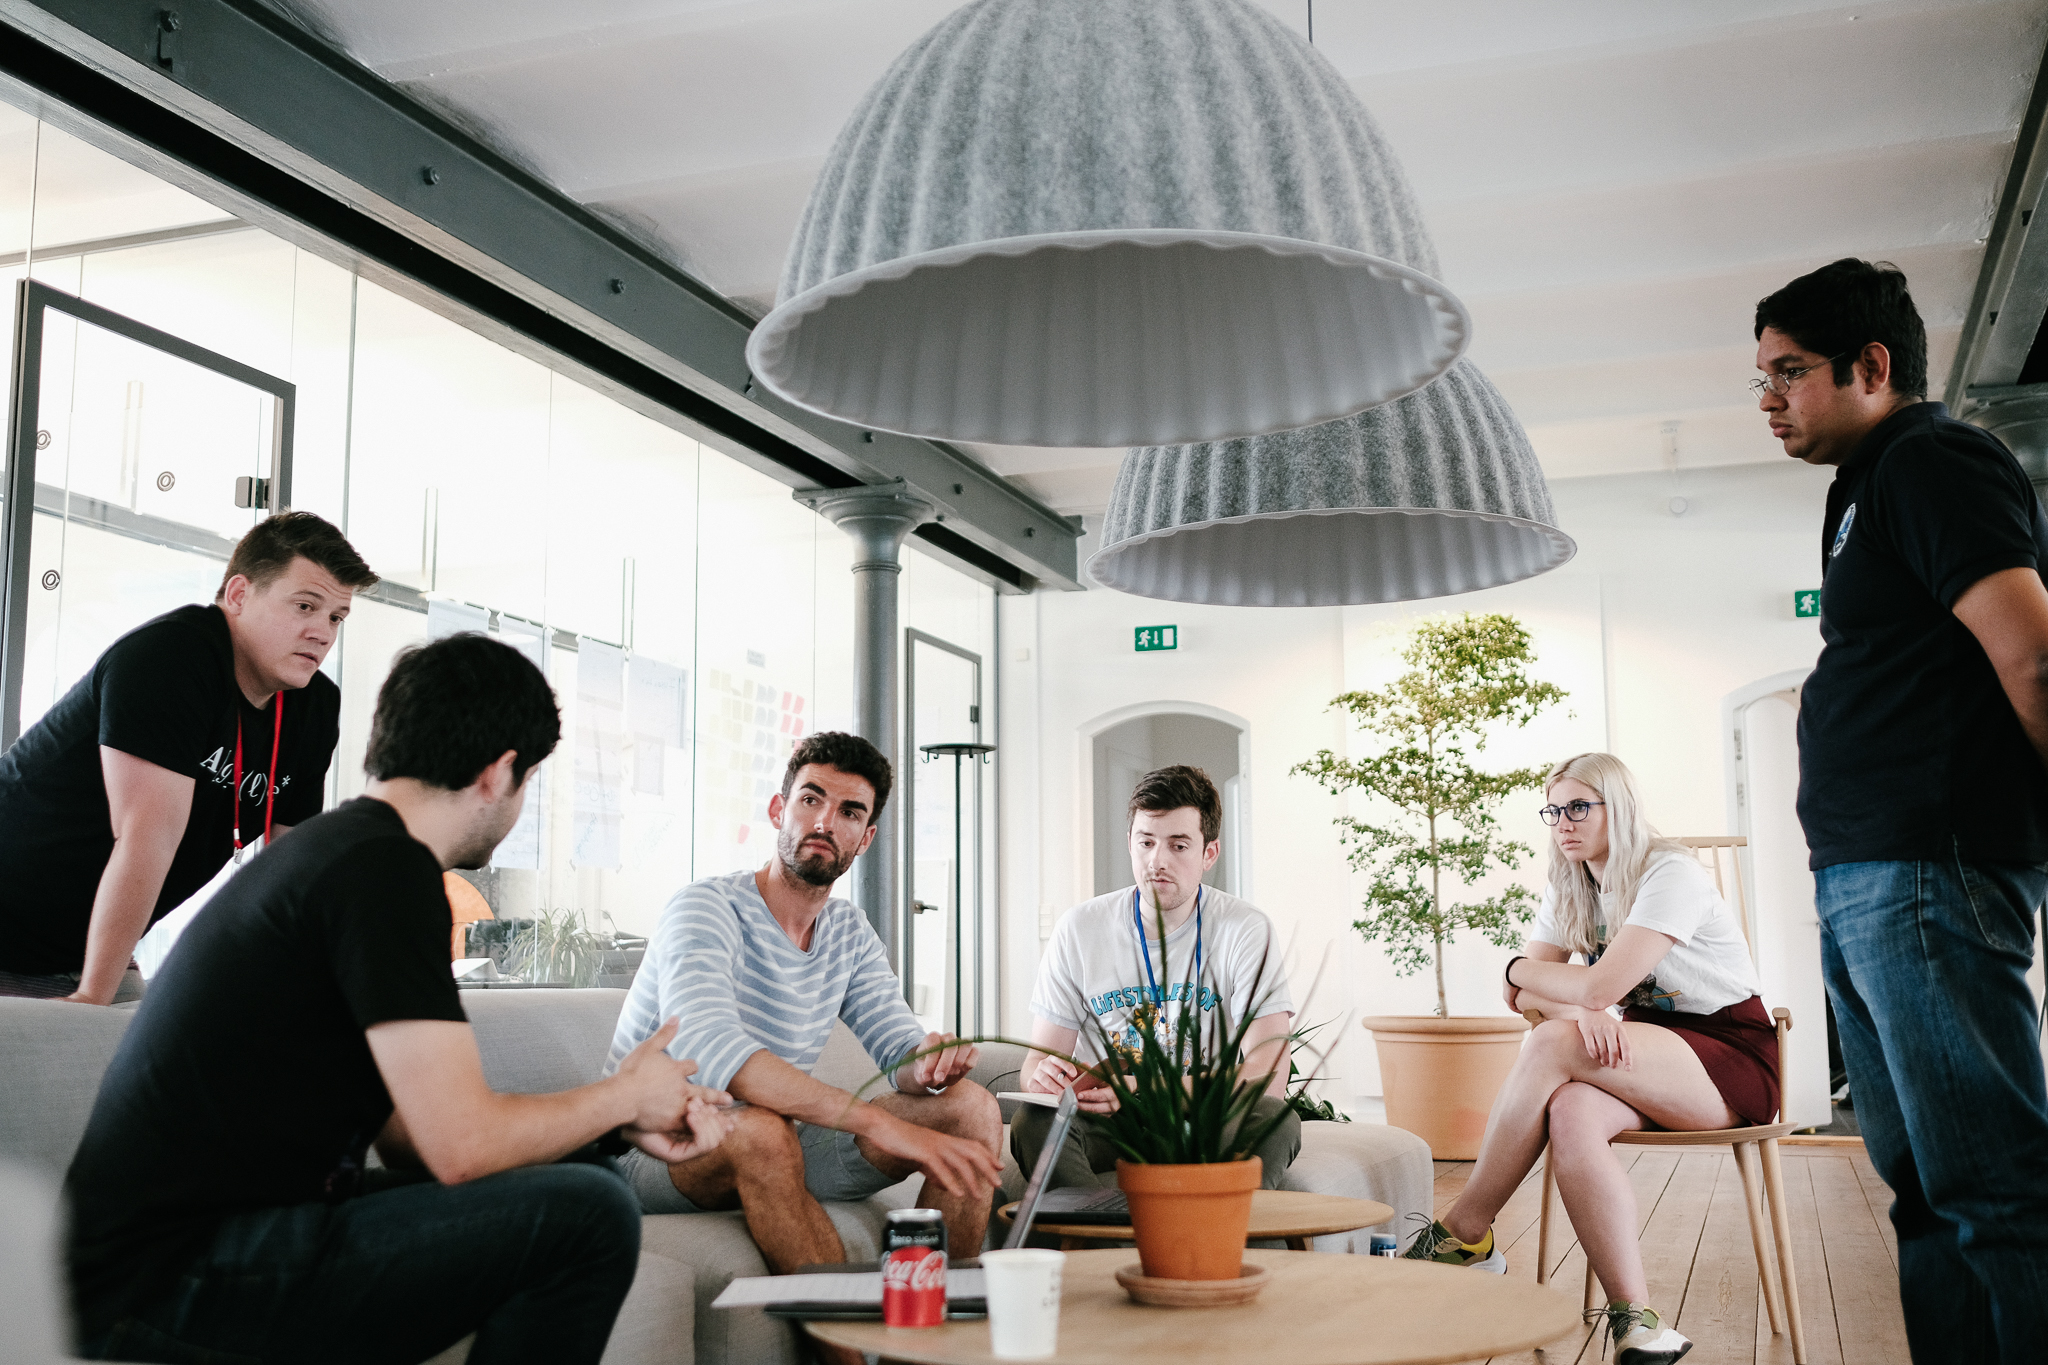
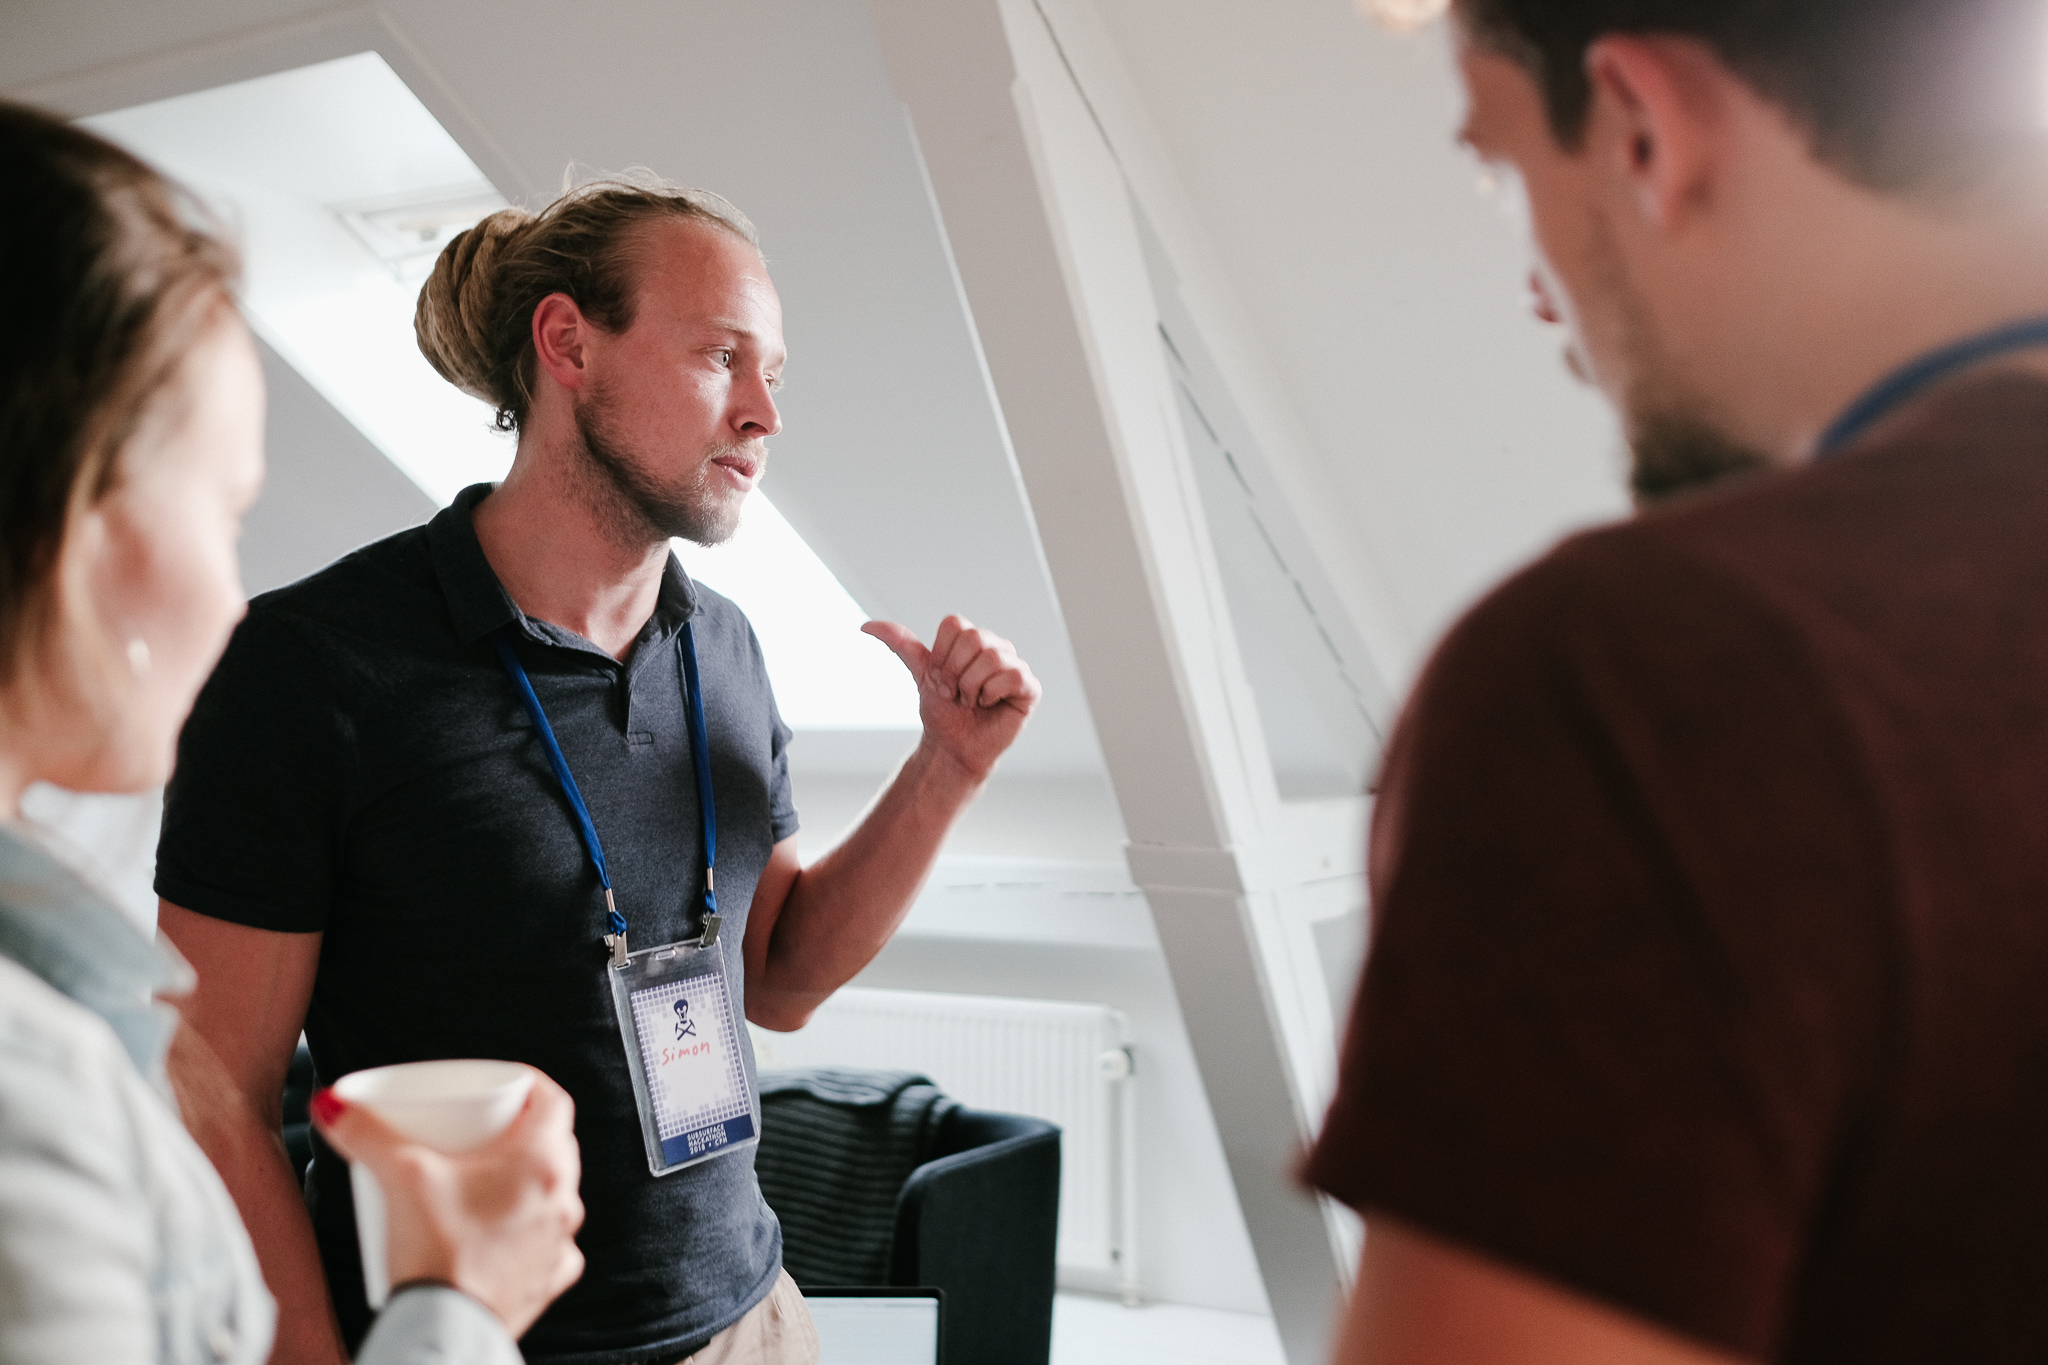
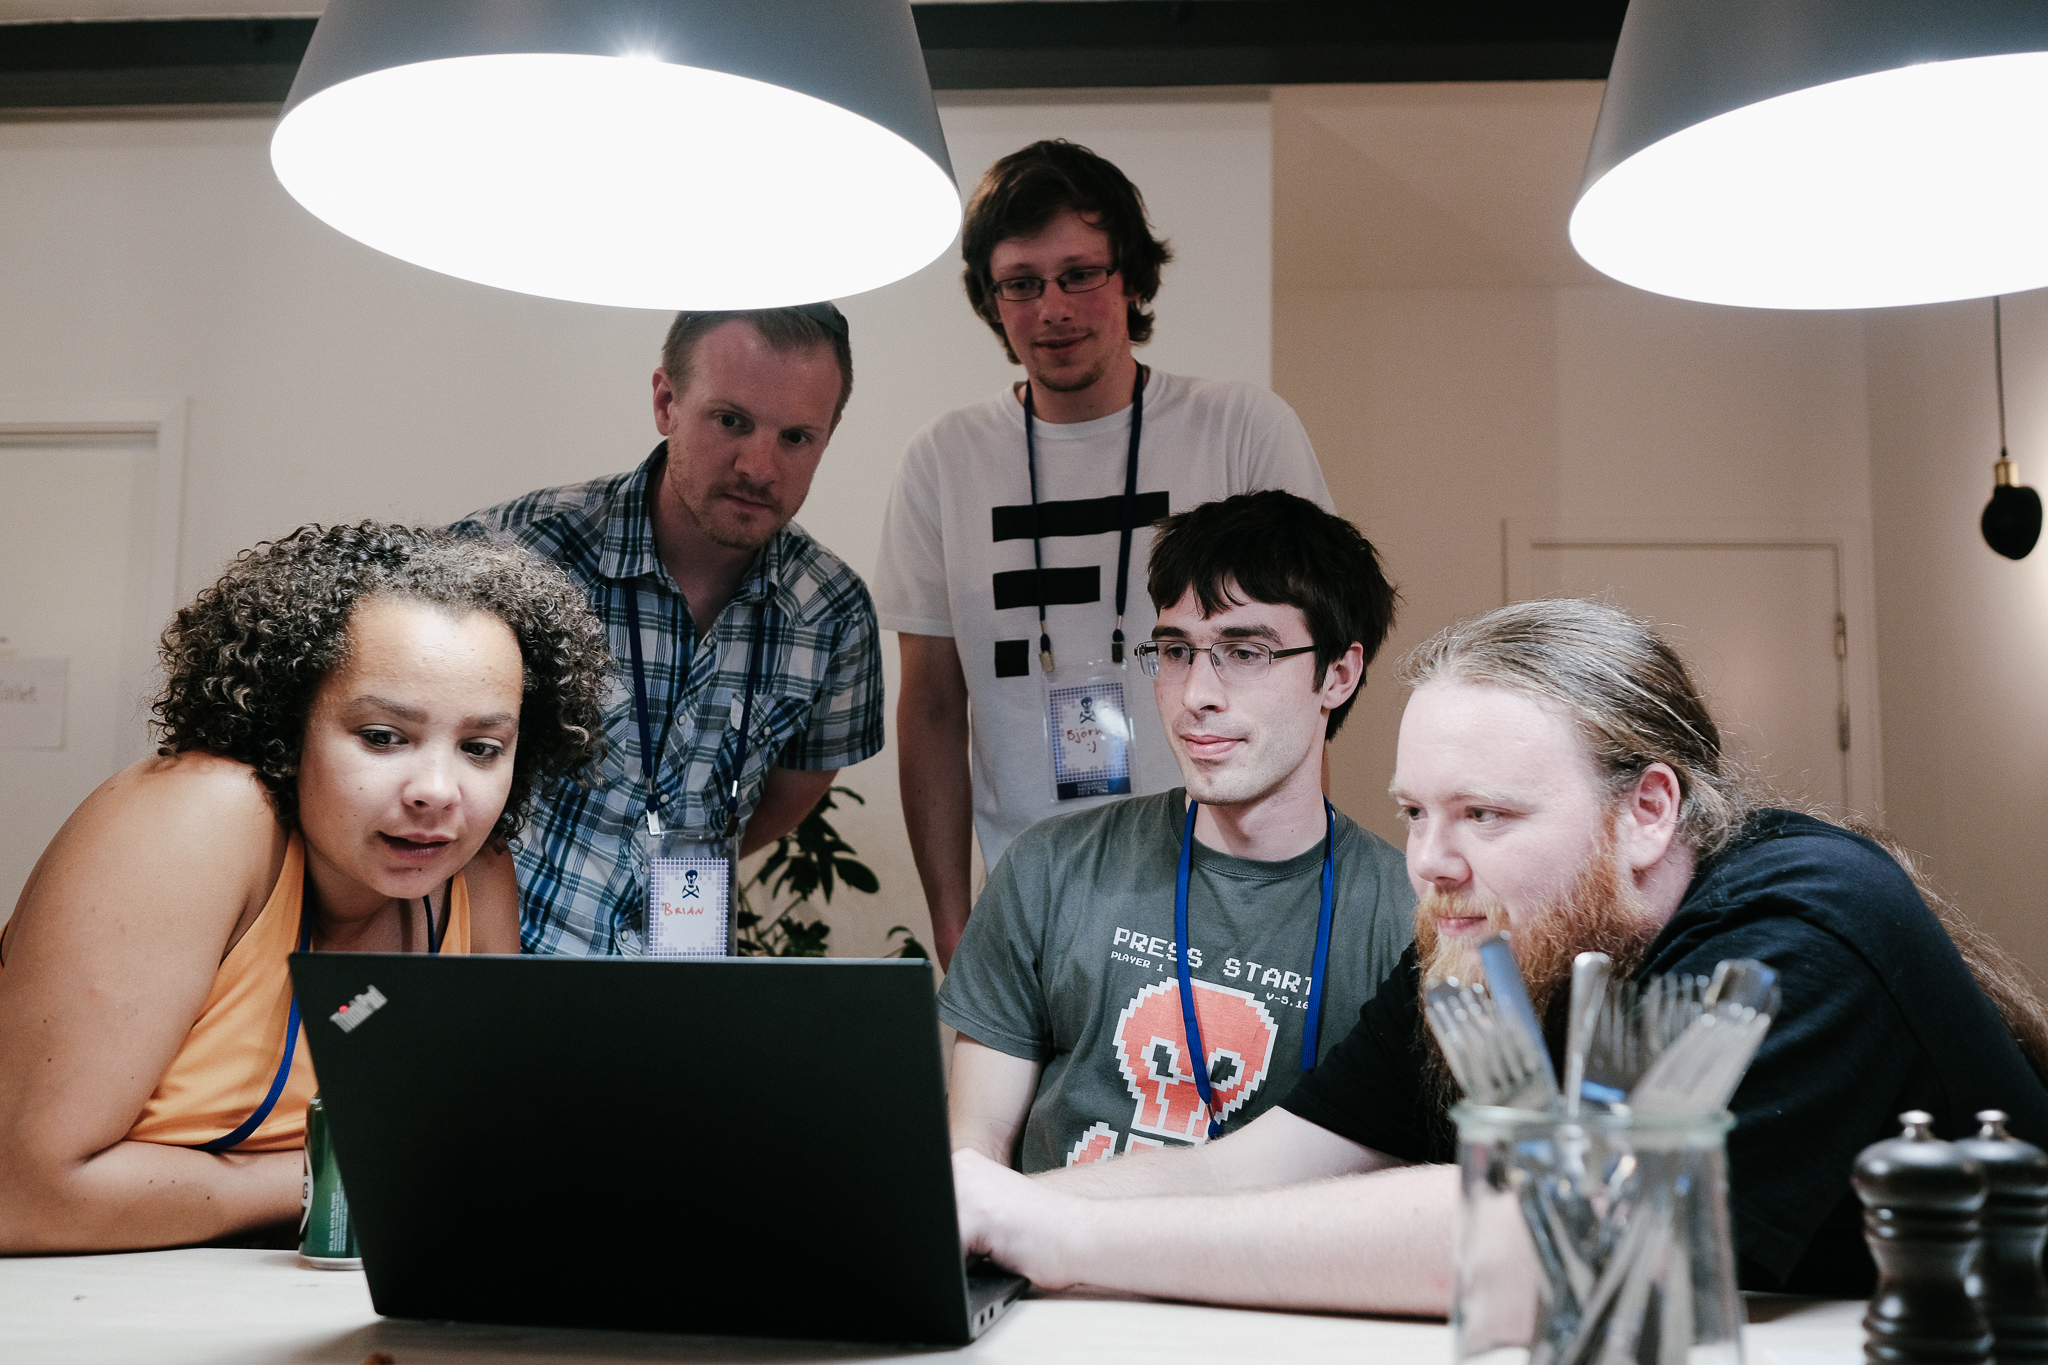
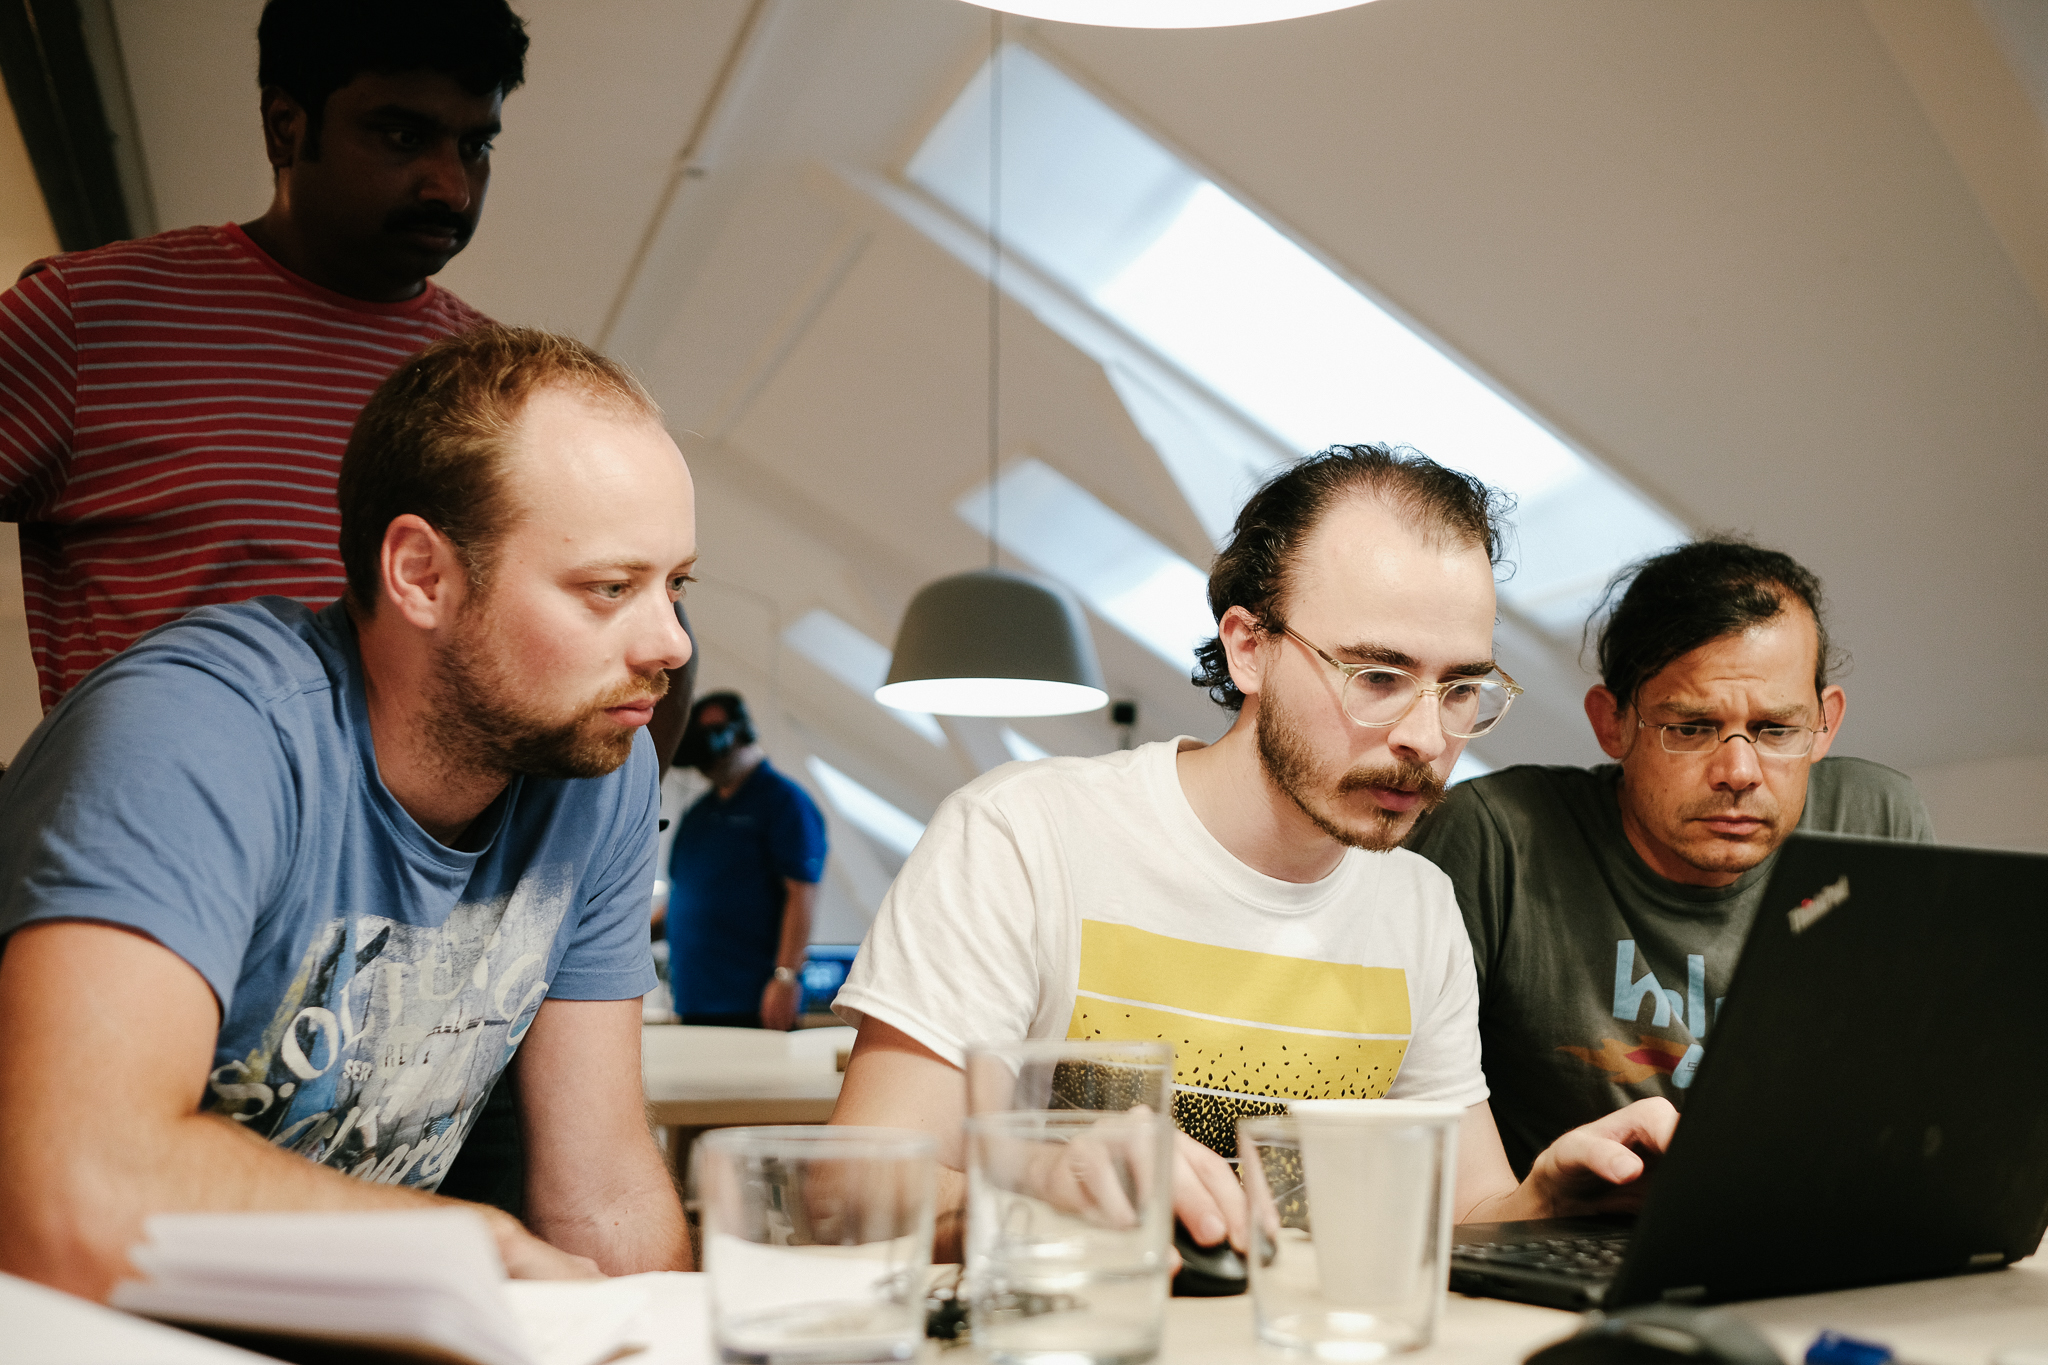
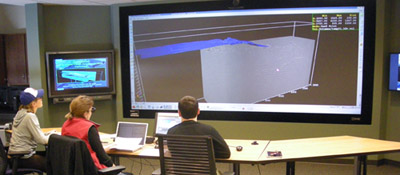
Simon Virgo (centre) and his colleagues in Aachen built an augmented reality sandbox, powered by their research group's software, Gempy. He brought it along and three teams attempted projects based on the technology. Above, some of the participants are having a scrum meeting to keep their project on track.
UPDATED on 27 July
Check out the projects:


 Except where noted, this content is licensed